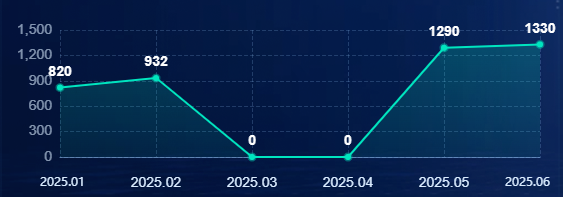
需要实现的效果如下
<script setup lang="ts" name="RepsSingleLineChart">
  import * as echarts from 'echarts'
  import { getInitecharts } from '@/utils/echart'
  import type { EChartsOption } from 'echarts'

  // 定义 props 类型
  interface Props {
    id: string
    dataObj: Record<string, unknown> | null
  }

  // 定义 props
  const props = defineProps<Props>()

  // 定义 ECharts 实例类型
  let myChart: echarts.ECharts | null = null
  // 定义 ECharts 配置项
  const option = ref<EChartsOption>({
    grid: {
      top: '30px',
      left: '17px',
      right: '20px',
      bottom: '9px',
      containLabel: true,
    },
    xAxis: {
      type: 'category',
      boundaryGap: false,
      data: ['2025.01', '2025.02', '2025.03', '2025.04', '2025.05', '2025.06'],
      axisTick: {
        alignWithLabel: true,
        show: false,
      },
      axisLine: {
        show: true, // 确保显示轴线
        lineStyle: {
          color: 'rgba(153,204,255,0.50)',
          type: 'solid', // 设置为实线
          width: 1,
        },
      },
      axisLabel: {
        color: '#DAECFF',
        fontSize: 14,
        fontFamily: 'Arial, Arial-400',
        fontWeight: 400,
        lineHeight: 36,
        formatter: function (value: string, index: number) {
          if (index === 0) {
            return '{a|' + value + '}' // First label
          } else if (index === 5) {
            return '{b|' + value + '}' // Last label
          }
          return value
        },
        rich: {
          a: {
            padding: [0, 0, 0, 5],
          },
          b: {
            padding: [0, 25, 0, 0],
          },
        },
      },
      // 添加X轴网格线配置
      splitLine: {
        show: true, // 不显示X轴方向的网格线
        lineStyle: {
          color: 'rgba(153,204,255,0.20)',
          type: 'dashed',
          width: 1,
        },
      },
    },
    yAxis: {
      type: 'value',
      axisLabel: {
        color: 'rgba(218,236,255,0.60)',
        fontSize: 14,
        fontFamily: 'Arial, Arial-400',
        fontWeight: 400,
        lineHeight: 20,
      },
      // Y轴轴线样式
      axisLine: {
        show: false,
      },
      // Y轴刻度线样式
      axisTick: {
        show: false,
      },
      // Y轴网格线样式(设置为虚线)
      splitLine: {
        show: true,
        lineStyle: {
          color: 'rgba(153,204,255,0.20)', // 浅色虚线
          type: 'dashed', // 虚线样式
          dashOffset: 2, // 虚线偏移量
          width: 1,
        },
      },
    },
    series: [
      {
        data: [820, 932, 0, 0, 1290, 1330],
        type: 'line',
        symbol: 'circle', // 设置拐点为圆形
        symbolSize: 6, // 设置拐点大小为6px
        silent: true,
        label: {
          show: true, // 显示标签
          position: 'top', // 显示在拐点上方
          // distance: 10, // 标签距离拐点的距离
          color: '#ffffff', // 文字颜色
          fontSize: 14, // 文字大小
          fontFamily: 'Arial, Arial-700', // 字体
          fontWeight: 'bold', // 字重
          lineHeight: 12, // 行高
          formatter: '{c}', // 显示数据值
        },
        areaStyle: {
          color: {
            type: 'linear',
            x: 0,
            y: 0,
            x2: 0,
            y2: 1,
            colorStops: [
              {
                offset: 0,
                color: 'rgba(0,230,191,0.30)', // 渐变起始颜色
              },
              {
                offset: 1,
                color: 'rgba(0,230,191,0.10)', // 渐变结束颜色
              },
            ],
          },
        },
        lineStyle: {
          color: '#00E5BF',
          width: 2,
        },
        itemStyle: {
          color: '#00e5bf', // 设置拐点填充色
          borderColor: 'rgba(0,229,191,0.40)', // 设置拐点边框颜色
          borderWidth: 3, // 设置拐点边框宽度
        },
      },
    ],
  })
  // 定义空数据时的提示信息
  const emptyObj = reactive<Record<string, string>>({
    dashboardPtglHyxxs: '暂无学校数据',
    dashboardPtglRzqys: '暂无企业数据',
  })

  /**
   * @description: 渲染
   * @return {void}
   */
  const getRender = () => {
    if (myChart) {
      myChart.dispose()
    }

    myChart = getInitecharts(echarts, props.id)

    nextTick(() => {
      if (!myChart) return

      if (props.dataObj && Object.keys(props.dataObj).length > 0) {
        console.log(props.dataObj)

        myChart.setOption(option.value)
      } else {
        myChart.setOption({
          // 禁用所有交互
          tooltip: {
            show: false,
          },
          graphic: {
            elements: [
              {
                type: 'group',
                left: 'center',
                top: 'center',
                silent: true, // 关键设置:禁用交互
                children: [
                  {
                    type: 'image',
                    style: {
                      image: '/src/assets/img/table-empty.png',
                      width: 88,
                      height: 88,
                    },
                    y: 0,
                  },
                  {
                    type: 'text',
                    style: {
                      text: emptyObj[props.id],
                      fontSize: 14,
                      fontWeight: '400',
                      fill: 'rgba(255, 255, 255, .8)',
                      opacity: '.8',
                      fontFamily: 'Microsoft YaHei UI, Microsoft YaHei UI-400',
                      lineHeight: 24,
                      letterSpacing: 0.07,
                    },
                    y: 88 + 4, // 图片高度 + 间隔
                    x: 2,
                  },
                ],
              },
            ],
          },
        })
      }
    })
  }

  watch(
    () => props.dataObj,
    () => {
      getRender()
    },
    { deep: true },
  )

  onMounted(() => {
    getRender()
  })
</script>

<template>
  <div :id="props.id" class="line"></div>
</template>

<style lang="less" scoped>
  .line {
    width: 100%;
    height: 100%;
  }
</style>
封装echarts统一调用
import * as echarts from 'echarts'

/**
 * @description: 初始化echarts
 * @param {typeof echarts} echartsInstance echarts实例
 * @param {string} id dom的id
 * @param {('canvas' | 'svg')} renderer 渲染方式
 * @returns {echarts.ECharts} echarts实例
 */
export function getInitecharts(
  echartsInstance: typeof echarts,
  id: string,
  renderer: 'canvas' | 'svg' = 'canvas',
): echarts.ECharts {
  const dom = document.getElementById(id)
  if (!dom) {
    throw new Error(`Element with id "${id}" not found`)
  }
  return echartsInstance.init(dom, null, {
    renderer,
    useDirtyRect: false,
  })
}