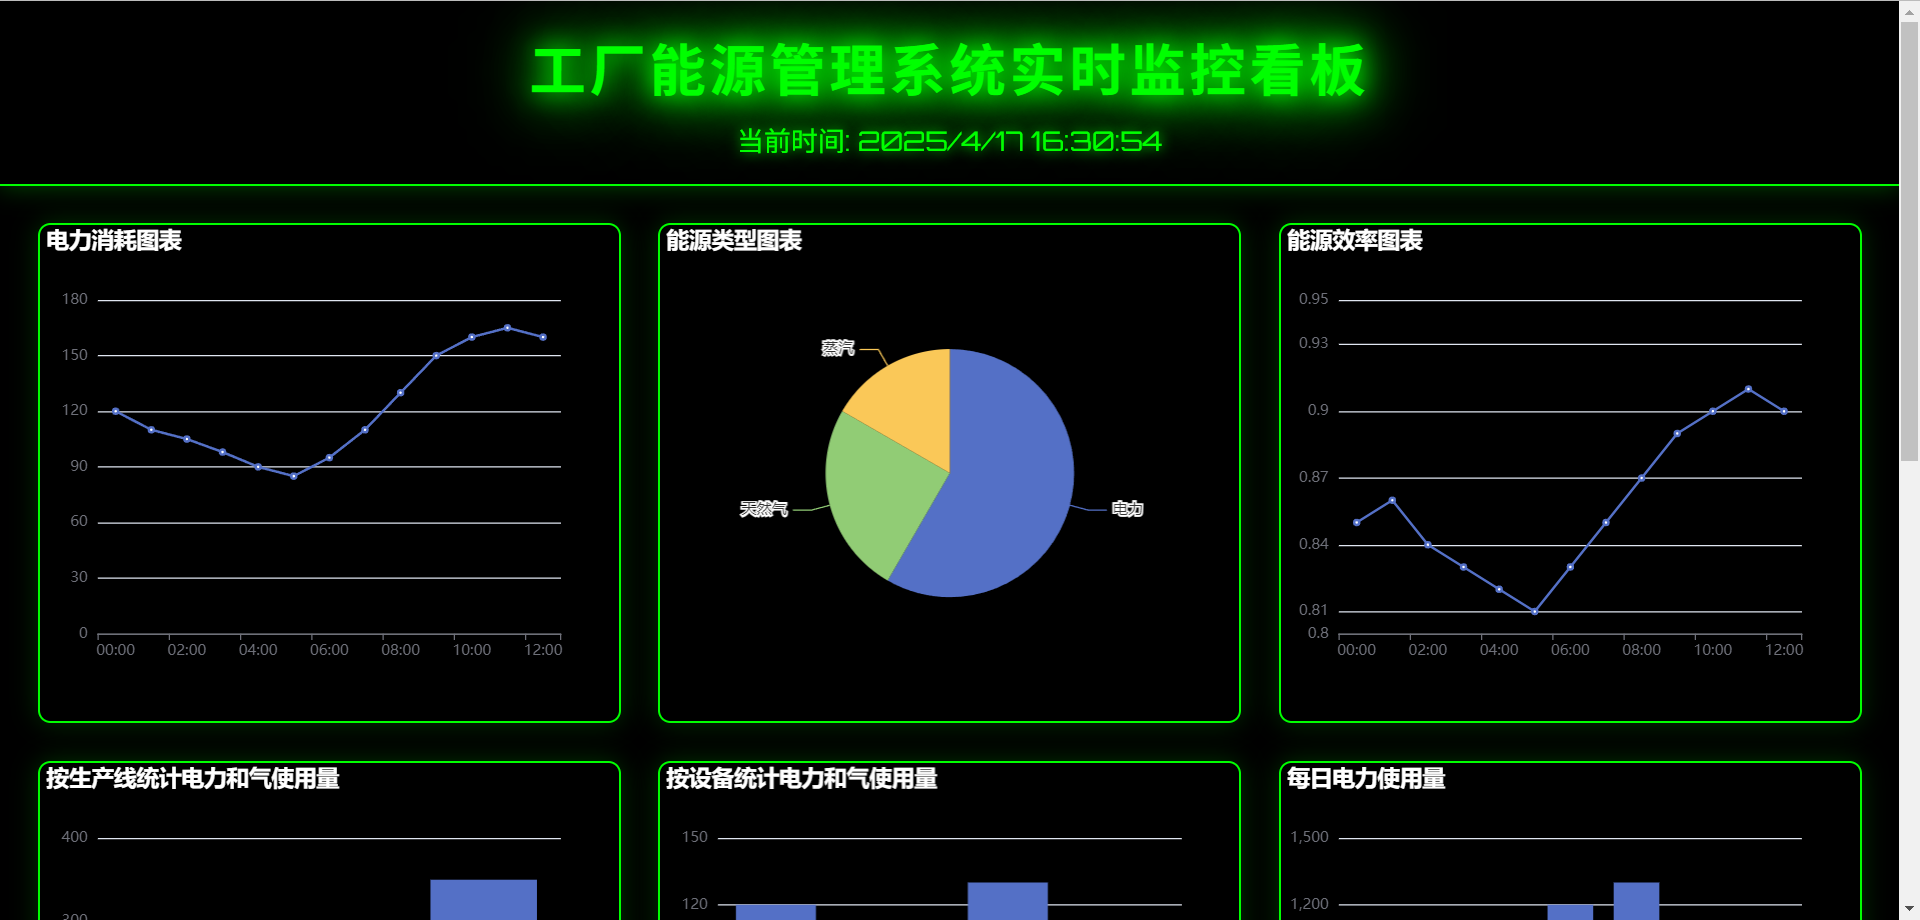
以下的 index.html 、 script.js 和 styles.css 文件,实现一个具有黑科技风格、自动刷新的能源管理系统实时监控看板。

html页面
<!DOCTYPE html>
<html lang="zh-CN">
<head>
    <meta charset="UTF-8">
    <meta name="viewport" content="width=device-width, initial-scale=1.0">
    <title>工厂能源管理系统实时监控看板</title>
    <!-- 引入 ECharts 文件 -->
    <script src="https://cdn.jsdelivr.net/npm/echarts@5.4.3/dist/echarts.min.js"></script>
    <link rel="stylesheet" href="styles.css">
    <link href="https://fonts.googleapis.com/css2?family=Orbitron:wght@400;500;600;700&display=swap" rel="stylesheet">
</head>
<body>
    <header>
        <h1>工厂能源管理系统实时监控看板</h1>
        <div id="timeDisplay"></div>
    </header>
    <div class="container">
        <div id="powerConsumptionChart" class="chart"></div>
        <div id="energyTypeChart" class="chart"></div>
        <div id="energyEfficiencyChart" class="chart"></div>
        <div id="productionLineChart" class="chart"></div>
        <div id="equipmentChart" class="chart"></div>
        <div id="dailyPowerChart" class="chart"></div>
        <div id="monthlyGasChart" class="chart"></div>
        <div id="equipmentEfficiencyChart" class="chart"></div>
        <div id="lineComparisonChart" class="chart"></div>
    </div>
    <script src="script.js"></script>
    <script>
        // 显示当前时间
        function updateTime() {
            const timeDisplay = document.getElementById('timeDisplay');
            const now = new Date();
            const timeString = now.toLocaleString();
            timeDisplay.textContent = `当前时间: ${timeString}`;
        }
        // 初始显示时间
        updateTime();
        // 每秒更新一次时间
        setInterval(updateTime, 1000);

        // 1000 毫秒自动刷新图表
        setInterval(() => {
            if (window.initCharts) {
                window.initCharts();
            }
        }, 1000);
    </script>
</body>
</html>
javascript脚本
// 模拟数据
const mockData = {
    powerConsumption: [
        { time: '00:00', value: 120 },
        { time: '01:00', value: 110 },
        { time: '02:00', value: 105 },
        { time: '03:00', value: 98 },
        { time: '04:00', value: 90 },
        { time: '05:00', value: 85 },
        { time: '06:00', value: 95 },
        { time: '07:00', value: 110 },
        { time: '08:00', value: 130 },
        { time: '09:00', value: 150 },
        { time: '10:00', value: 160 },
        { time: '11:00', value: 165 },
        { time: '12:00', value: 160 }
    ],
    energyType: [
        { name: '电力', value: 700 },
        { name: '天然气', value: 300 },
        { name: '蒸汽', value: 200 }
    ],
    energyEfficiency: [
        { time: '00:00', value: 0.85 },
        { time: '01:00', value: 0.86 },
        { time: '02:00', value: 0.84 },
        { time: '03:00', value: 0.83 },
        { time: '04:00', value: 0.82 },
        { time: '05:00', value: 0.81 },
        { time: '06:00', value: 0.83 },
        { time: '07:00', value: 0.85 },
        { time: '08:00', value: 0.87 },
        { time: '09:00', value: 0.89 },
        { time: '10:00', value: 0.9 },
        { time: '11:00', value: 0.91 },
        { time: '12:00', value: 0.9 }
    ],
    productionLines: [
        { name: '生产线1', power: 300, gas: 150 },
        { name: '生产线2', power: 250, gas: 120 },
        { name: '生产线3', power: 350, gas: 180 }
    ],
    equipments: [
        { name: '设备A', power: 120, gas: 60 },
        { name: '设备B', power: 100, gas: 50 },
        { name: '设备C', power: 130, gas: 70 },
        { name: '设备D', power: 100, gas: 50 }
    ],
    dailyPower: [
        { day: '周一', power: 1000 },
        { day: '周二', power: 1100 },
        { day: '周三', power: 1050 },
        { day: '周四', power: 1200 },
        { day: '周五', power: 1300 },
        { day: '周六', power: 800 },
        { day: '周日', power: 700 }
    ],
    monthlyGas: [
        { month: '1月', gas: 3000 },
        { month: '2月', gas: 3200 },
        { month: '3月', gas: 3500 },
        { month: '4月', gas: 3300 },
        { month: '5月', gas: 3600 },
        { month: '6月', gas: 3400 },
        { month: '7月', gas: 3700 },
        { month: '8月', gas: 3800 },
        { month: '9月', gas: 3500 },
        { month: '10月', gas: 3600 },
        { month: '11月', gas: 3400 },
        { month: '12月', gas: 3300 }
    ],
    equipmentEfficiency: [
        { name: '设备A', efficiency: 0.85 },
        { name: '设备B', efficiency: 0.88 },
        { name: '设备C', efficiency: 0.9 },
        { name: '设备D', efficiency: 0.87 }
    ],
    lineComparison: [
        { name: '生产线1', power: 300, gas: 150 },
        { name: '生产线2', power: 250, gas: 120 },
        { name: '生产线3', power: 350, gas: 180 }
    ]
};

// 初始化用电量图表
function initPowerConsumptionChart() {
    const chartDom = document.getElementById('powerConsumptionChart');
    const myChart = echarts.init(chartDom);
    const option = {
        title: {
            text: '电力消耗图表',
            textStyle: {
                color: '#fff'
            }
        },
        tooltip: {
            trigger: 'axis'
        },
        xAxis: {
            type: 'category',
            data: mockData.powerConsumption.map(item => item.time)
        },
        yAxis: {
            type: 'value'
        },
        series: [{
            data: mockData.powerConsumption.map(item => item.value),
            type: 'line'
        }]
    };
    myChart.setOption(option);
}

// 初始化能源类型图表
function initEnergyTypeChart() {
    const chartDom = document.getElementById('energyTypeChart');
    const myChart = echarts.init(chartDom);
    const option = {
        title: {
            text: '能源类型图表',
            textStyle: {
                color: '#fff'
            }
        },
        tooltip: {
            trigger: 'item'
        },
        series: [
            {
                name: '能源类型',
                type: 'pie',
                radius: '50%',
                data: mockData.energyType,
                emphasis: {
                    itemStyle: {
                        shadowBlur: 10,
                        shadowOffsetX: 0,
                        shadowColor: 'rgba(0, 0, 0, 0.5)'
                    }
                }
            }
        ]
    };
    myChart.setOption(option);
}

// 初始化能源效率图表
function initEnergyEfficiencyChart() {
    const chartDom = document.getElementById('energyEfficiencyChart');
    const myChart = echarts.init(chartDom);
    const option = {
        title: {
            text: '能源效率图表',
            textStyle: {
                color: '#fff'
            }
        },
        tooltip: {
            trigger: 'axis'
        },
        xAxis: {
            type: 'category',
            data: mockData.energyEfficiency.map(item => item.time)
        },
        yAxis: {
            type: 'value',
            min: 0.8,
            max: 0.95
        },
        series: [{
            data: mockData.energyEfficiency.map(item => item.value),
            type: 'line'
        }]
    };
    myChart.setOption(option);
}

// 初始化生产线图表
function initProductionLineChart() {
    const chartDom = document.getElementById('productionLineChart');
    const myChart = echarts.init(chartDom);
    const option = {
        title: {
            text: '按生产线统计电力和气使用量',
            textStyle: {
                color: '#fff'
            }
        },
        tooltip: {
            trigger: 'axis'
        },
        xAxis: {
            type: 'category',
            data: mockData.productionLines.map(item => item.name)
        },
        yAxis: {
            type: 'value'
        },
        series: [{
            data: mockData.productionLines.map(item => item.power),
            type: 'bar'
        }]
    };
    myChart.setOption(option);
}

// 初始化设备图表
function initEquipmentChart() {
    const chartDom = document.getElementById('equipmentChart');
    const myChart = echarts.init(chartDom);
    const option = {
        title: {
            text: '按设备统计电力和气使用量',
            textStyle: {
                color: '#fff'
            }
        },
        tooltip: {
            trigger: 'axis'
        },
        xAxis: {
            type: 'category',
            data: mockData.equipments.map(item => item.name)
        },
        yAxis: {
            type: 'value'
        },
        series: [{
            data: mockData.equipments.map(item => item.power),
            type: 'bar'
        }]
    };
    myChart.setOption(option);
}

// 新增每日电力使用量图表
function initDailyPowerChart() {
    const chartDom = document.getElementById('dailyPowerChart');
    const myChart = echarts.init(chartDom);
    const option = {
        title: {
            text: '每日电力使用量',
            textStyle: {
                color: '#fff'
            }
        },
        tooltip: {
            trigger: 'axis'
        },
        xAxis: {
            type: 'category',
            data: mockData.dailyPower.map(item => item.day)
        },
        yAxis: {
            type: 'value'
        },
        series: [{
            data: mockData.dailyPower.map(item => item.power),
            type: 'bar'
        }]
    };
    myChart.setOption(option);
}

// 新增每月气使用量图表
function initMonthlyGasChart() {
    const chartDom = document.getElementById('monthlyGasChart');
    const myChart = echarts.init(chartDom);
    const option = {
        title: {
            text: '每月气使用量',
            textStyle: {
                color: '#fff'
            }
        },
        tooltip: {
            trigger: 'axis'
        },
        xAxis: {
            type: 'category',
            data: mockData.monthlyGas.map(item => item.month)
        },
        yAxis: {
            type: 'value'
        },
        series: [{
            data: mockData.monthlyGas.map(item => item.gas),
            type: 'line'
        }]
    };
    myChart.setOption(option);
}

// 新增设备效率图表
function initEquipmentEfficiencyChart() {
    const chartDom = document.getElementById('equipmentEfficiencyChart');
    const myChart = echarts.init(chartDom);
    const option = {
        title: {
            text: '设备效率',
            textStyle: {
                color: '#fff'
            }
        },
        tooltip: {
            trigger: 'item'
        },
        xAxis: {
            type: 'category',
            data: mockData.equipmentEfficiency.map(item => item.name)
        },
        yAxis: {
            type: 'value',
            min: 0.8,
            max: 0.95
        },
        series: [{
            data: mockData.equipmentEfficiency.map(item => item.efficiency),
            type: 'bar'
        }]
    };
    myChart.setOption(option);
}

// 新增生产线对比图表
function initLineComparisonChart() {
    const chartDom = document.getElementById('lineComparisonChart');
    const myChart = echarts.init(chartDom);
    const option = {
        title: {
            text: '生产线电力和气对比',
            textStyle: {
                color: '#fff'
            }
        },
        tooltip: {
            trigger: 'axis',
            axisPointer: {
                type: 'cross',
                crossStyle: {
                    color: '#999'
                }
            }
        },
        legend: {
            data: ['电力', '气']
        },
        xAxis: {
            type: 'category',
            data: mockData.lineComparison.map(item => item.name)
        },
        yAxis: {
            type: 'value'
        },
        series: [
            {
                name: '电力',
                type: 'bar',
                data: mockData.lineComparison.map(item => item.power)
            },
            {
                name: '气',
                type: 'bar',
                data: mockData.lineComparison.map(item => item.gas)
            }
        ]
    };
    myChart.setOption(option);
}

// 更新初始化所有图表的函数
function initCharts() {
    initPowerConsumptionChart();
    initEnergyTypeChart();
    initEnergyEfficiencyChart();
    initProductionLineChart();
    initEquipmentChart();
    initDailyPowerChart();
    initMonthlyGasChart();
    initEquipmentEfficiencyChart();
    initLineComparisonChart();
}

// 页面加载完成后初始化图表
window.onload = initCharts;
css样式
/* 全局样式 */
* {
    box-sizing: border-box;
    margin: 0;
    padding: 0;
}

body {
    font-family: 'Orbitron', sans-serif;
    background-color: #000;
    color: #0f0;
    min-height: 100vh;
    overflow-x: hidden;
}

/* 表头样式 */
header {
    background-color: rgba(0, 0, 0, 0.8);
    padding: 20px 0;
    box-shadow: 0 0 20px rgba(0, 255, 0, 0.3);
    border-bottom: 2px solid #0f0;
    display: flex;
    flex-direction: column;
    align-items: center;
    gap: 10px;
}

header h1 {
    text-align: center;
    font-size: 2.5rem;
    text-shadow: 0 0 15px #0f0, 0 0 30px #0f0;
    letter-spacing: 3px;
    animation: neonGlow 1.5s ease-in-out infinite alternate;
}

@keyframes neonGlow {
    from {
        text-shadow: 0 0 10px #0f0, 0 0 20px #0f0, 0 0 30px #0f0;
    }
    to {
        text-shadow: 0 0 20px #0f0, 0 0 40px #0f0, 0 0 60px #0f0;
    }
}

/* 时间显示样式 */
#timeDisplay {
    text-align: center;
    font-size: 1.2rem;
    text-shadow: 0 0 10px #0f0;
}

/* 图表容器样式 */
.container {
    display: grid;
    grid-template-columns: repeat(3, 1fr);
    gap: 30px;
    padding: 30px;
}

.chart {
    background-color: rgba(0, 0, 0, 0.6);
    border-radius: 10px;
    border: 2px solid #0f0;
    box-shadow: 0 0 20px rgba(0, 255, 0, 0.2);
    height: 400px;
    transition: all 0.3s ease;
    position: relative;
    overflow: hidden;
}

.chart::before {
    content: '';
    position: absolute;
    top: -50%;
    left: -50%;
    width: 200%;
    height: 200%;
    background: linear-gradient(45deg, rgba(0, 255, 0, 0.1), rgba(0, 255, 0, 0.3));
    transform-origin: bottom right;
    animation: rotate 6s linear infinite;
    opacity: 0.3;
}

.chart::after {
    content: '';
    position: absolute;
    inset: 4px;
    background: #000;
    border-radius: 10px;
}

.chart:hover {
    transform: translateY(-10px);
    box-shadow: 0 0 30px rgba(0, 255, 0, 0.5);
}

@keyframes rotate {
    0% {
        transform: rotate(0deg);
    }
    100% {
        transform: rotate(360deg);
    }
}

/* 图表内容区域,确保内容显示在遮罩之上 */
.chart > * {
    position: relative;
    z-index: 10;
}