Title
题目
Mammography classification with multi-view deep learning techniques:Investigating graph and transformer-based architectures
《基于多视角深度学习技术的乳腺X线分类:图网络与Transformer架构的研究》
01
文献速递介绍
乳腺X线摄影是乳腺癌筛查的主要影像学手段,因此也是减少乳腺癌死亡率的最重要工具之一(Broeders等,2012;Morra等,2015)。鉴于筛查中阅片量大、诊断任务明确且采集过程相对标准化,乳腺X线摄影成为自动或半自动阅片的理想候选对象。深度学习系统有望提供独立评估,从而减轻放射科医生的负担,这一前景已在最近的几项研究中得到了认可(Rodríguez-Ruiz等,2019;Kyono等,2018;Dembrower等,2020)。然而,设计用于乳腺X线摄影的深度学习系统仍然面临诸多挑战:由于癌症的患病率低于1%,乳腺X线摄影筛查是典型的大海捞针问题,要求使用非常大且富集的数据集才能达到高性能(Wu等,2020;Schaffter等,2020);同时还需处理高分辨率图像(Wu等,2020);并且需要在多个尺度和多个视图中整合信息(Shen等,2021b;Pinto Pereira等,2009;Van Schie等,2011;Samulski和Karssemeijer,2011;Perek等,2018;Famouri等,2020;Ren等,2021)。
用于自动处理乳腺X线摄影筛查的最全面方法之一是所谓的多视图架构,该架构结合了筛查考试中通常包含的四个视图的信息,并生成检查级别的分类评分,指示例如该检查中包含癌症的概率。多视图架构能够执行同侧和对侧分析:前者通过结合颅尾(CC)视图和内外斜位(MLO)视图来补偿高乳腺密度和组织重叠的影响,从而在任一乳房上寻找病灶(Sacchetto等,2016;Wei等,2011;Van Gils等,1998;Ren等,2021;Samulski和Karssemeijer,2011);后者则结合两侧乳房的信息,可以例如检测单独视图无法发现的不对称(Rangayyan等,2007)。
Aastract
摘要
The potential and promise of deep learning systems to provide an independent assessment and relieveradiologists’ burden in screening mammography have been recognized in several studies. However, the lowcancer prevalence, the need to process high-resolution images, and the need to combine information frommultiple views and scales still pose technical challenges. Multi-view architectures that combine informationfrom the four mammographic views to produce an exam-level classification score are a promising approach tothe automated processing of screening mammography. However, training such architectures from exam-levellabels, without relying on pixel-level supervision, requires very large datasets and may result in suboptimalaccuracy. Emerging architectures such as Visual Transformers (ViT) and graph-based architectures can potentially integrate ipsi-lateral and contra-lateral breast views better than traditional convolutional neural networks,thanks to their stronger ability of modeling long-range dependencies. In this paper, we extensively evaluatenovel transformer-based and graph-based architectures against state-of-the-art multi-view convolutional neuralnetworks, trained in a weakly-supervised setting on a middle-scale dataset, both in terms of performance andinterpretability. Extensive experiments on the CSAW dataset suggest that, while transformer-based architectureoutperform other architectures, different inductive biases lead to complementary strengths and weaknesses, aseach architecture is sensitive to different signs and mammographic features. Hence, an ensemble of differentarchitectures should be preferred over a winner-takes-all approach to achieve more accurate and robust results.Overall, the findings highlight the potential of a wide range of multi-view architectures for breast cancerclassification, even in datasets of relatively modest size, although the detection of small lesions remainschallenging without pixel-wise supervision or ad-hoc networks.
深度学习系统在筛查乳腺X线摄影中提供独立评估和减轻放射科医生工作负担的潜力和前景已经在多项研究中得到了认可。然而,低癌症患病率、处理高分辨率图像的需求以及结合来自多个视图和尺度的信息的需求仍然构成了技术挑战。结合来自四个乳腺X线摄影视图的信息以生成检查级别分类得分的多视图架构,是自动化处理筛查乳腺X线摄影的一个有前途的方案。然而,在没有依赖像素级监督的情况下,仅依赖检查级别标签来训练这种架构,往往需要非常庞大的数据集,可能导致精度不佳。新兴架构如视觉Transformer(ViT)和基于图的架构比传统卷积神经网络更能有效整合同侧和对侧乳房视图,因为它们在建模长距离依赖关系方面有更强的能力。在本文中,我们对基于Transformer和基于图的新型架构与最先进的多视图卷积神经网络进行了广泛的评估,这些网络在中等规模的数据集上以弱监督方式进行训练,评估的指标包括性能和可解释性。对CSAW数据集的广泛实验表明,尽管基于Transformer的架构在性能上优于其他架构,不同的归纳偏差导致了各自不同的优势和劣势,因为每种架构对不同的标志和乳腺X线摄影特征敏感。因此,为了获得更准确和稳健的结果,应该优先采用多种架构的集成,而不是单一架构的胜者通吃策略。总体而言,研究结果强调了各种多视图架构在乳腺癌分类中的潜力,即使在相对较小规模的数据集中也是如此,尽管没有像素级监督或专门的网络,小病灶的检测仍然具有挑战性。
Results
结果
In this section, we analyze the results from two distinct perspectives.The first subsection presents the results obtained using the referenceperformance metrics, broken down by breast and patient, while thesecond presents a punctual analysis on single views to evaluate theaccuracy of the provided predictions.
在本节中,我们从两个不同的角度对结果进行分析。
第一小节展示了使用参考性能指标所获得的结果,这些结果按乳房和患者进行细分;而第二小节则对单个视图进行了精确分析,以评估所提供预测的准确性。
Figure
图
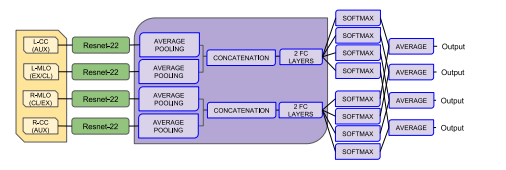
Fig. 1. A schematic representation of the NYU model from Wu et al. (2020). Thebackbone parameters are shared among images of the same view (CC and MLO), asindicated by the different colors. The loss is calculated from the softmax output, andthe predictions of the CC and MLO views are averaged at inference time.
图1. Wu等(2020)提出的NYU模型的示意图。模型中的骨干网络参数在同一视图的图像(颅尾视图CC和内外斜位视图MLO)之间共享,如不同颜色所示。损失函数基于softmax输出进行计算,在推理阶段,颅尾视图(CC)和内外斜位视图(MLO)的预测结果将进行平均。
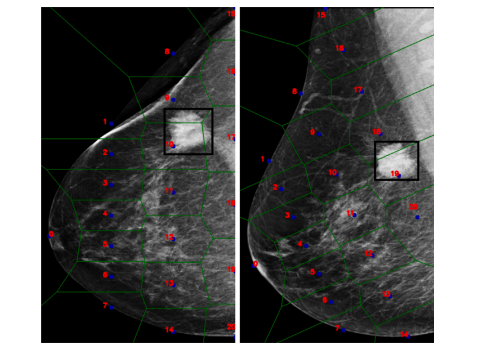
Fig. 2. A representation of pseudo-landmark and the respective tessellation of the samebreast in the two projections.
图2. 伪标志点的表示及其在同一乳房的两个投影中的相应镶嵌分布。

Fig. 3. A representation of the entire AGN4V model. It is worth noting that thisarchitecture requires an additional set of inputs (that is, the pseudo-landmarks andtheir position), which are used by the IGN and BGN modules to simulate radiologists’analysis.
图3. 整个AGN4V模型的表示。值得注意的是,该架构需要一组额外的输入(即伪标志点及其位置),这些输入由IGN和BGN模块使用,以模拟放射科医生的分析过程。
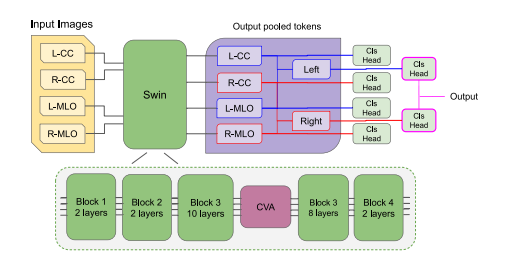
Fig. 4. Representation of the MaMVT architecture used in this work: the four viewsare passed through a shared Swin backbone, with an additional cross-attention blockinserted inside the backbone after the 10th layer of the 3rd block to perform crossattention between each view. The final output for each view is then passed througha classification layer and used for additional loss computation. The two left and rightviews are additionally concatenated to obtain a left and right representation as well,which are also passed through a classification layer and are used to perform both losscomputation and to obtain the final classification result for the exam.
图4. 本研究中使用的MaMVT架构的表示:四个视图通过一个共享的Swin骨干网络,并在骨干网络的第3个模块的第10层后插入一个额外的交叉注意力块,以在各个视图之间执行交叉注意力。每个视图的最终输出随后通过一个分类层,并用于额外的损失计算。左右两侧的视图还被进一步拼接,以获得左侧和右侧的表示,同样通过一个分类层,用于损失计算并获得最终的检查分类结果。
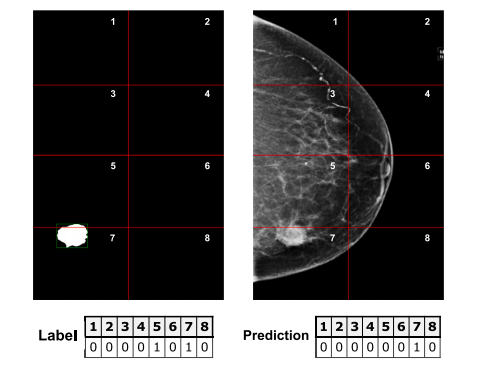
Fig. 5. Simplified example of the patch supervision method: shown on the left is theimage mask, split into patches and converted into the label vector below, where eachvalue corresponds to one patch: indices 5 and 7 are set to 1, since their respectivepatches contain the lesion. Shown on the right is a hypothetical prediction of eachimage patch following the same structure: in this example, all patches were predictedcorrectly with the exception of patch 5.
图5. Patch监督方法的简化示例:左侧显示了图像掩码,掩码被分割为若干小块并转换为下方的标签向量,其中每个值对应一个小块:索引5和7被设置为1,因为其对应的小块包含病灶。右侧显示了一个假设的每个图像小块的预测结果,结构相同:在这个例子中,除了小块5之外,所有小块都被正确预测。
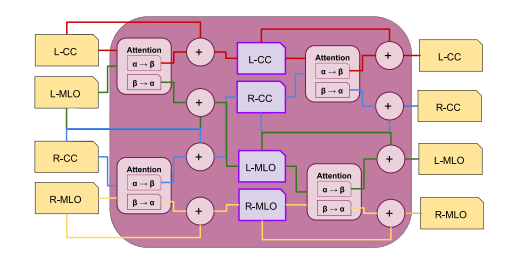
Fig. 6. Side-variant four-view cross-attention module scheme. First, for each side (L-CCand L-MLO, R-CC and R-MLO), the pair-wise attention operations are performed andthen added to their respective views. Then the same operation is applied for each typeof view (L-CC and L-MLO, R-CC and R-MLO).
图6. 侧变四视图交叉注意模块方案。首先,对于每一侧(左侧颅尾视图L-CC和左侧内外斜位视图L-MLO,右侧颅尾视图R-CC和右侧内外斜位视图R-MLO),执行成对的注意力操作,然后将结果加到其各自的视图中。接着,对每种视图类型(左侧颅尾视图L-CC和左侧内外斜位视图L-MLO,右侧颅尾视图R-CC和右侧内外斜位视图R-MLO)应用相同的操作。
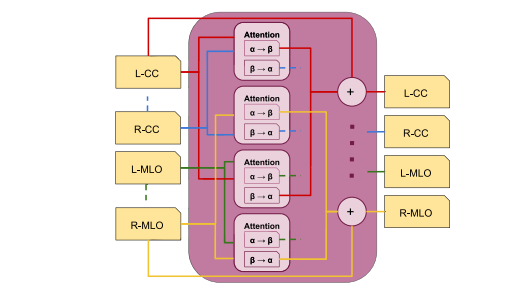
Fig. 7. Side-invariant four-view cross-attention module scheme. All the pair-wiseattention operations are performed first, and then added to their respective views.Only the sum operations for the L-CC and R-MLO views are shown for clarity
图7. 侧不变四视图交叉注意模块方案。首先执行所有成对的注意力操作,然后将结果加到其各自的视图中。为了清晰起见,仅展示了左侧颅尾视图(L-CC)和右侧内外斜位视图(R-MLO)的求和操作。

Fig. 8. Flowchart for exam selection and stratification in training, validation and test set, with number of exams and images included at each step.
图8. 训练、验证和测试集中的检查选择和分层流程图,展示了每个步骤中包含的检查和图像数量。
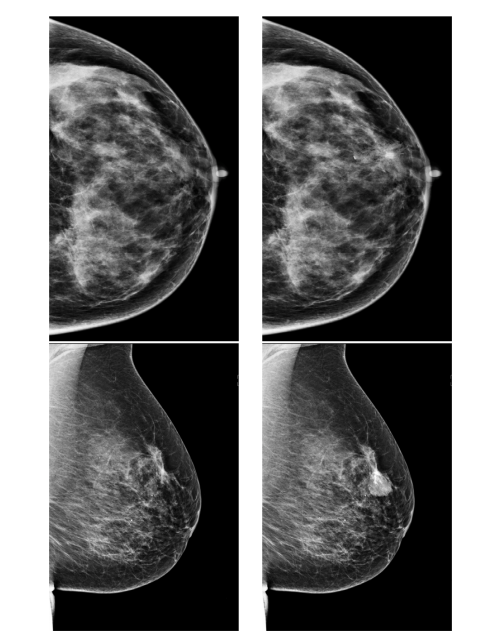
Fig. 9. Two examples of synthetic cases comparing the original healthy control image(left) and the result of the synthetic lesion insertion (right). The network was trainedon both the original healthy control and the synthetic lesions
图9. 两个合成病例的示例,比较了原始的健康对照图像(左)与合成病灶插入后的结果(右)。网络同时在原始健康对照图像和合成病灶上进行了训练。
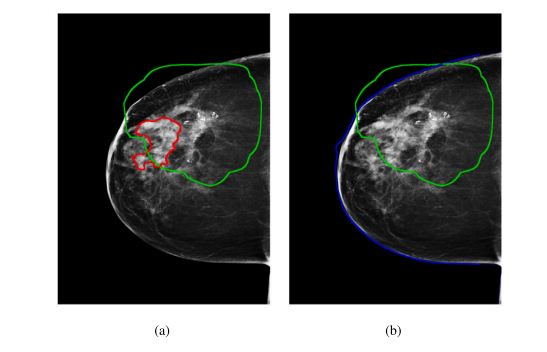
Fig. 10. The red line (a) represents the lesion annotation pixel (AP), while the greenone (a) underlines the area covered by the Grad-CAM heatmap (𝐺𝑃**𝑡 ). These twoquantities were used to calculate the DICE score and the Intersection over Lesion. Theblue (b) represents the area covered by the entire breast (BP), and is used to calculatethe Intersection over Breast.
图10. 红线 (a) 表示病灶标注的像素 (AP),而绿线 (a) 标注了Grad-CAM热力图覆盖的区域 (𝐺𝑃**𝑡)。这两个值用于计算DICE得分和病灶重叠率。蓝色区域 (b) 表示整个乳房覆盖的区域 (BP),用于计算乳房重叠率。
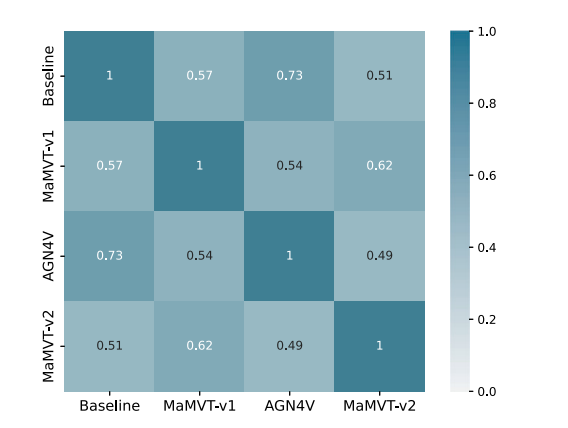
Fig. 11. Correlation between the predictions of three best run of each architecture onthe validation set.
图11. 每种架构的三个最佳运行结果在验证集上的预测之间的相关性
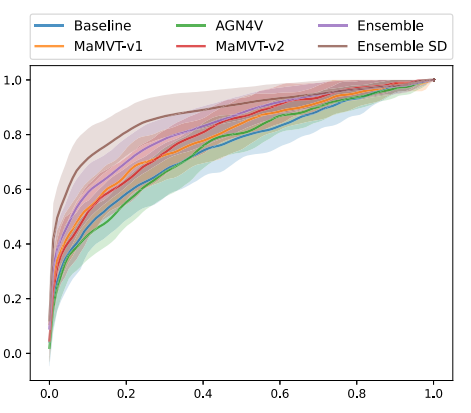
Fig. 12. ROC curve on the test with 95% confidence intervals calculated by bootstrapping. All ROCs are calculated on all cancers, except for the ensemble that are calculatedon both all cancers and SD cancers.
图12. 测试集上的ROC曲线,95%置信区间通过bootstrap方法计算。所有ROC曲线均在所有癌症数据上计算,除了集成模型,它们的ROC曲线分别计算于所有癌症和筛查检测(SD)癌症数据。
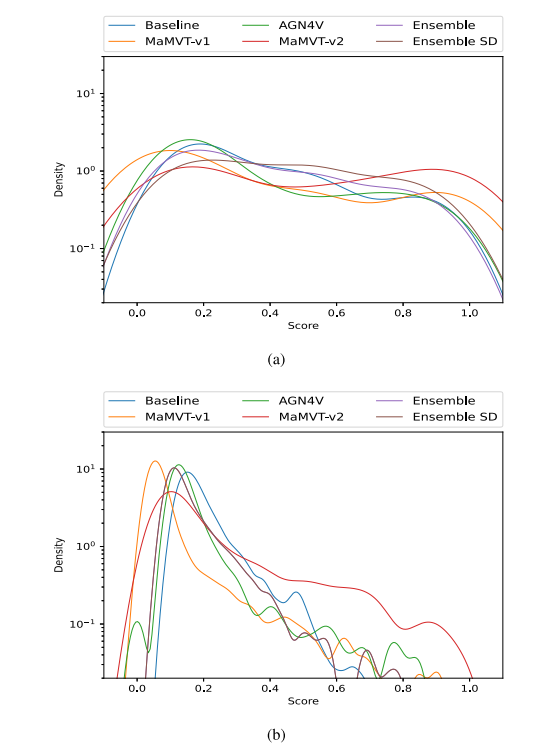
Fig. 13. Score distribution on the cancer cases (a) and negative control (b) exams foreach architecture and ensemble (y axis in logarithmic scale). The best performing runis selected for each architecture on the validation set. MaMVT-v2 assigns high score tothe most cancer cases, but also generates the highest percentage of highly scored falsepositives. For the ensemble, distribution of positive cases is reported for all cancersand for screen detected cancers (SD) separately
图13. 每种架构和集成模型在癌症病例 (a) 和阴性对照 (b) 检查中的分数分布(y轴为对数尺度)。每种架构在验证集上选择了表现最好的运行结果。MaMVT-v2对大多数癌症病例赋予了高分,但也生成了最高比例的高分假阳性结果。对于集成模型,分别报告了所有癌症和筛查检测(SD)癌症的阳性病例分布。
Fig. 14. Example of negative control that was classified as positive by the AGN4Varchitecture. Note the asymmetry between the left and right breast.
图14. 一个被AGN4V架构分类为阳性的阴性对照示例。请注意左侧和右侧乳房之间的不对称性。
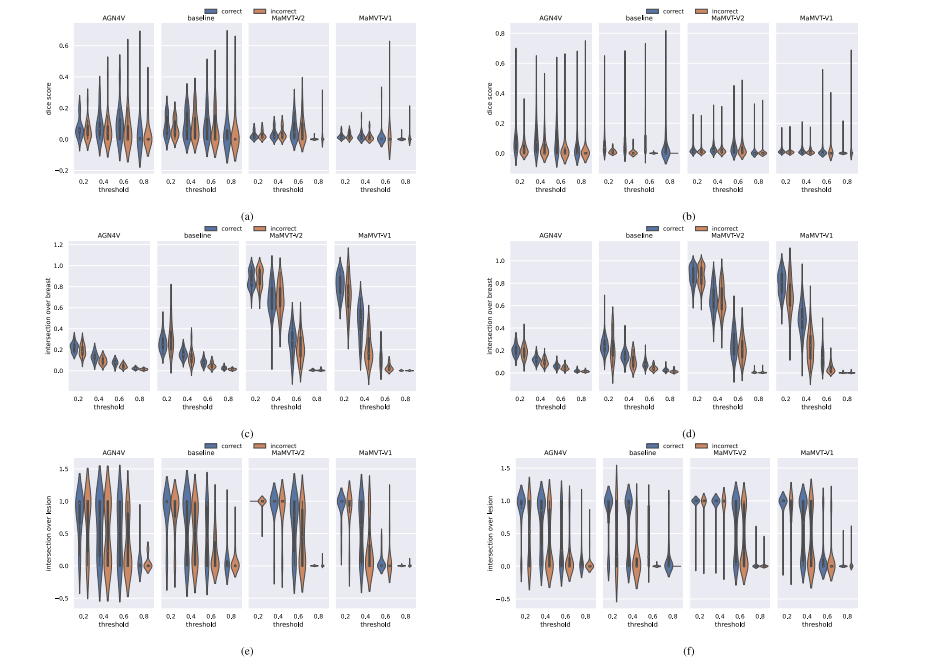
Fig. 15. DICE (a–b), IOB (c–d) and IOL (e–f) scores calculated on the cancer cases of Validation Test set (a,c,e) and Training set (b,d,f), divided by architecture and by correctand incorrect predictions (in other words, for detected and missed cancers). Each metric compares the GradCAM heatmaps with the lesion segmentation as detailed in Section 5.7.The scores at various thresholds were obtained by normalizing the GradCAM heatmaps with values between 0 and 1, and then binarizing the maps by applying the correspondingthreshold.
图15. 在验证集(a, c, e)和训练集(b, d, f)的癌症病例上计算的DICE(a–b)、IOB(c–d)和IOL(e–f)评分,按架构以及正确和错误预测(即检测到和未检测到的癌症)进行划分。每个指标将GradCAM热图与病灶分割进行了比较,具体见第5.7节。通过将GradCAM热图的值归一化到0到1之间,并在对应的阈值下对热图进行二值化后,获得了不同阈值下的评分。
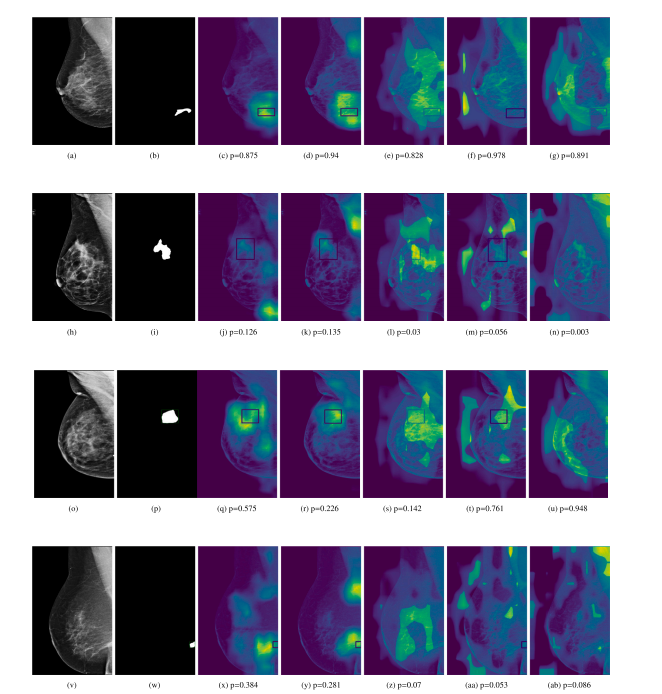
Fig. 16. Grad-CAM heatmap for the cancer prediction task. From left to right, each row displays the original image, the corresponding lesion annotation mask, and the GRADCAMsobtained from the Baseline, AGN4V and MaMVT-(v1 Imagenet, v1 PEAC and v2) architectures along with the corresponding prediction score. While the GRADCAM for the baselineand AGN4V architectures are more focused on local areas, the MaMVT architectures attend to larger portion of the breast parenchyma independently of the prediction score.
图16. 癌症预测任务的Grad-CAM热图。从左到右,每行依次显示原始图像、相应的病灶标注掩膜,以及从Baseline、AGN4V和MaMVT(v1 Imagenet、v1 PEAC和v2)架构中获得的GRADCAM热图及相应的预测评分。与Baseline和AGN4V架构的GRADCAM热图更集中于局部区域相比,MaMVT架构的热图无论预测评分如何,都会关注到更大范围的乳腺实质。
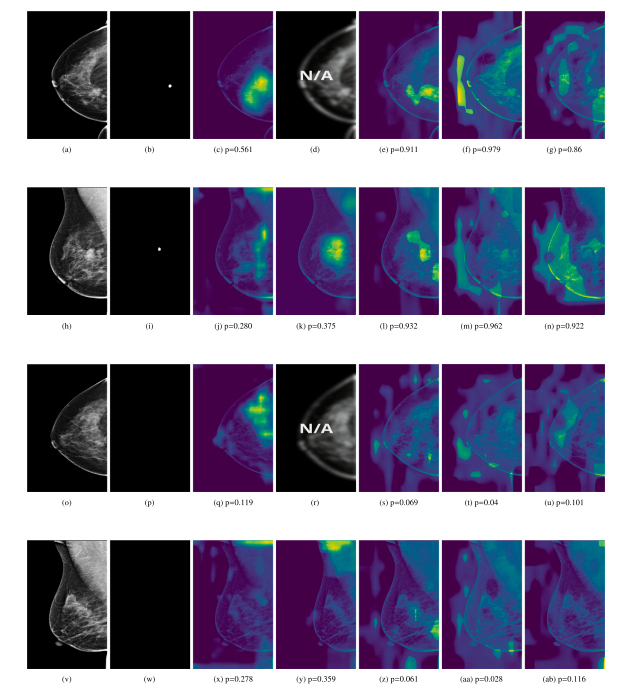
Fig. 17. Grad-CAM heatmap for the cancer prediction task on different views of the same exam. From top to bottom, each column displays the L-CC, L-MLO, R-CC and R-MLO.From left to right, each row displays the original view image, the corresponding lesion annotation mask, and the GRADCAMs obtained from the Baseline, AGN4V (when possible)and MaMVT-(v1 Imagenet, v1 PEAC and v2) architectures along with the corresponding prediction score. While the GRADCAM for the baseline and AGN4V architectures are more focused on local areas, the MaMVT architectures attend to larger portion of the breast parenchyma independently of the prediction score.
图17. 不同视图下的同一检查中的癌症预测任务的Grad-CAM热图。从上到下,每列依次显示L-CC、L-MLO、R-CC和R-MLO视图。从左到右,每行依次显示原始视图图像、相应的病灶标注掩膜,以及从Baseline、AGN4V(如果适用)和MaMVT(v1 Imagenet、v1 PEAC和v2)架构中获得的GRADCAM热图及相应的预测评分。与Baseline和AGN4V架构的GRADCAM热图更集中于局部区域相比,MaMVT架构的热图无论预测评分如何,都会关注到更大范围的乳腺实质
Table
表
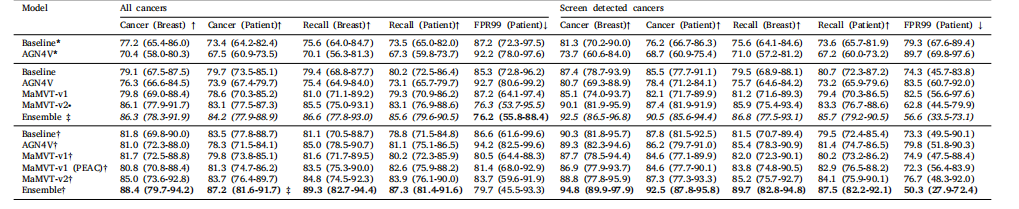
Table 1Performance metrics, at breast and patient level, calculated on the validation set. Performance metrics reported include the Area under the ROC Curve (AUC) for cancer detection(Cancer, for brevity) and recall prediction (Recall, for brevity). Performances are separately calculated on all cancers (including screen detected and interval cancers), and screendetected cancer only; 95% confidence intervals are calculated based on 1000 bootstrap repetitions from three training runs. Models indicated with (top rows) are trained fromscratch. All other models are either pre-trained on ImageNet (MaMVT-v1, MaMVT-v2) or using self-supervised learning (Baseline, AGN4V, MaMVT-v1 (PEAC)). All models indicatedwith † (bottom rows in the table) are trained using random swapping of the left and right breast. The remaining models (intermediate rows) are trained using standard dataaugmentation. MaMVT models indicated with ∙ are trained using the side invariant version of the cross-attention module. Best and second–best models are indicated in bold andunderline characters, respectively.
表1在验证集上按乳房和患者级别计算的性能指标。报告的性能指标包括癌症检测的ROC曲线下面积(AUC,简写为Cancer)和召回率预测(Recall,简写为Recall)。性能分别在所有癌症(包括筛查发现的癌症和间隔癌症)和仅筛查发现的癌症上进行计算;95%置信区间基于三个训练运行的1000次bootstrap重复计算。用标记的模型(表格顶部行)从头开始训练。所有其他模型要么在ImageNet上进行预训练(MaMVT-v1,MaMVT-v2),要么使用自监督学习进行预训练(Baseline,AGN4V,MaMVT-v1 (PEAC))。用†标记的模型(表格底部行)使用左右乳房随机交换训练。其余模型(中间行)使用标准数据增强进行训练。标有∙的MaMVT模型使用侧不变版本的交叉注意力模块进行训练。最佳和次佳*模型分别用粗体和下划线字符表示。
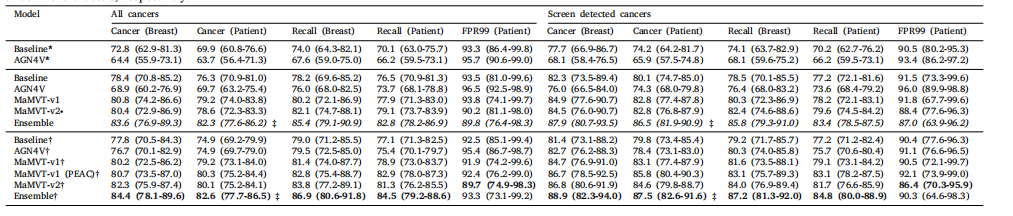
Table 2Performance metrics, at breast and patient level, calculated on the test set. Performance metrics reported include the Area under the ROC Curve (AUC) for cancer detection(Cancer, for brevity) and recall prediction (Recall, for brevity). Performances are separately calculated on all cancers (including screen detected and interval cancers), and screendetected cancer only; 95% confidence intervals are calculated based on 1000 bootstrap repetitions from three training runs. Models indicated with (top rows) are trained fromscratch. All other models are either pre-trained on ImageNet (MaMVT-v1, MaMVT-v2) or using self-supervised learning (Baseline, AGN4V, MaMVT-v1 (PEAC)). All models indicatedwith † (bottom rows in the table) are trained using random swapping of the left and right breast. The remaining models (intermediate rows) are trained using standard dataaugmentation. MaMVT models indicated with ∙ are trained using the side invariant version of the cross-attention module. Best and second–best models are indicated in bold andunderline characters, respectively
表2在测试集上按乳房和患者级别计算的性能指标。报告的性能指标包括癌症检测的ROC曲线下面积(AUC,简写为Cancer)和召回率预测(Recall,简写为Recall)。性能分别在所有癌症(包括筛查发现的癌症和间隔癌症)和仅筛查发现的癌症上进行计算;95%置信区间基于三个训练运行的1000次bootstrap重复计算。用标记的模型(表格顶部行)从头开始训练。所有其他模型要么在ImageNet上进行预训练(MaMVT-v1,MaMVT-v2),要么使用自监督学习进行预训练(Baseline,AGN4V,MaMVT-v1 (PEAC))。用†标记的模型(表格底部行)使用左右乳房随机交换训练。其余模型(中间行)使用标准数据增强进行训练。标有∙的MaMVT模型使用侧不变版本的交叉注意力模块进行训练。最佳和次佳*模型分别用粗体和下划线字符表示。
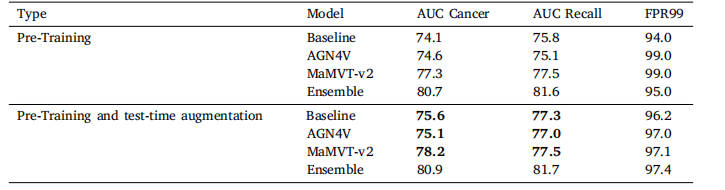
Table 3Patient-level AUC calculated for the best run of each architecture and for the ensemble with and without test-time augmentation(TTA). TTA increases performance for each individual architecture, but has minimal effect on the ensemble.
表3为每种架构的最佳运行结果以及集成模型在有和没有测试时增强(TTA)的情况下计算的患者级AUC。TTA提高了每个单独架构的性能,但对集成模型的影响最小。
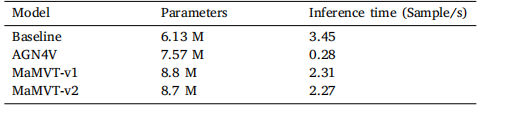
Table 4Comparison of model parameters (millions) and throughput (exams processed persecond) for the four architectures
表4 四种架构的模型参数量(百万)和吞吐量(每秒处理的检查数量)比较。