SCENIC教程中给出三个方法进行下游的可视化分析,分别可以选择网页(SCope)平台,R或者python进行分析。
1、网页版:https://scope.aertslab.org/


把数据从左侧工具栏处上传之后就可以个性化分析了~
2、R和Python就殊途同归啦~
笔者基于github和曾老师的分享进行简单可视化的练习和整理。
关于GRN调控网络知识和pyscenic流程可以见笔者之前的推文: 基因调控网络(gene regulatory network-GRN)分析基础概念 https://mp.weixin.qq.com/s/sL_8YFulHsZ42L8G5DyY8w
pySCENIC报错、解决和完整流程(IOS系统) https://mp.weixin.qq.com/s/Y6Z3tjGVj-7unTirRak5tA
分析流程
1.导入
rm(list = ls())
library(stringr)
library(Seurat)
library(patchwork)
library(SummarizedExperiment)
library(SCopeLoomR)
library(AUCell)
library(SCENIC)
library(dplyr)
library(KernSmooth)
library(RColorBrewer)
library(plotly)
library(BiocParallel)
library(grid)
library(ComplexHeatmap)
library(data.table)
library(SCENIC)
library(qs)
library(BiocParallel)
register(MulticoreParam(workers = 4, progressbar = TRUE))
loom <- open_loom("out_SCENIC.loom")
sce <- qread("sce.qs")
2.数据预处理
regulons_incidMat <- get_regulons(loom, column.attr.name="Regulons")
regulons_incidMat[1:4,1:4]

# 将regulons_incidMat转换成一个含有不同regulon的列表
regulons <- regulonsToGeneLists(regulons_incidMat)
class(regulons)

# 在loom文件中提取名称为RegulonsAUC的信息
regulonAUC <- get_regulons_AUC(loom,column.attr.name='RegulonsAUC')
# head(regulonAUC)[1:3,1:3]
# AUC for 3 regulons (rows) and 3 cells (columns).
#
# Top-left corner of the AUC matrix:
#            cells
# regulons    HN75_AGTGTCAAGGAGCGTT-1 ACACCGGTCATTTGGG.14 HN60_GACGTTAGTACAGCAG-1
#   ADNP2(+)              0.066205203          0.00000000              0.00245618
#   AR(+)                 0.000000000          0.00000000              0.00000000
#   ARID3A(+)             0.006903197          0.03178398              0.22804942

# 提取regulon的阈值
regulonAucThresholds <- get_regulon_thresholds(loom)
tail(regulonAucThresholds[order(as.numeric(names(regulonAucThresholds)))])

# 提取loom文件的嵌入信息(事实上按照之前的pyscenic分析时没有坐标信息的)
embeddings <- get_embeddings(loom)
embeddings
3.导入seurat对象和加载的regulon信息进行匹配应对
# 取交集
sub_regulonAUC <- regulonAUC[,match(colnames(sce),colnames(regulonAUC))]
dim(sub_regulonAUC)
# [1] 401 800
sce
# An object of class Seurat
# 30269 features across 800 samples within 2 assays
# Active assay: RNA (28269 features, 0 variable features)
#  1 other assay present: integrated
#  3 dimensional reductions calculated: pca, umap, tsne

#确认是否一致
identical(colnames(sub_regulonAUC), colnames(sce))

# # 构建簇注释信息
# cellClusters <- data.frame(row.names = colnames(sce),
#                            seurat_clusters = as.character(sce$subsite))
# 构建细胞类型注释信息
cellTypes <- data.frame(row.names = colnames(sce),
                        celltype = sce$celltype)
head(cellTypes)
sub_regulonAUC[1:4,1:4]
save(sub_regulonAUC,
     cellTypes,
     sce,
     file = 'for_rss_and_visual.Rdata')

table(sce$celltype)
# 根据自己需要的信息进行划分
selectedResolution <- "celltype"
cellsPerGroup <- split(rownames(cellTypes),cellTypes[,selectedResolution])
# 保留唯一/非重复的 regulon
sub_regulonAUC <- sub_regulonAUC[onlyNonDuplicatedExtended(rownames(sub_regulonAUC)),]
dim(sub_regulonAUC)
4.scenic自带的方式-regulon特异性分数(RSS)
# regulon特异性分数(Regulon Specificity Score, RSS)
selectedResolution <- "celltype"
rss <- calcRSS(AUC=getAUC(sub_regulonAUC),
               cellAnnotation=cellTypes[colnames(sub_regulonAUC),selectedResolution])
rss=na.omit(rss)
rssPlot <- plotRSS(rss,
  labelsToDiscard = NULL, # 指定需要在热图中排除的行或列标签
  zThreshold = 1, # 设定调控子的阈值,默认1
  cluster_columns = FALSE, # 是否对列进行聚类
  order_rows = T, # 是否对行进行排序
  thr = 0.01, # 阈值参数,用于过滤 RSS 值。默认0.01
  varName = "cellType",
  col.low = '#330066',
  col.mid = '#66CC66',
  col.high= '#FFCC33',
  revCol = F,
  verbose = TRUE
)
rssPlot
p <- plotly::ggplotly(rssPlot$plot)
p <- p %>%
  layout(
    title = "RSS Plot",
    xaxis = list(title = "Celltypes"),
    yaxis = list(title = "Regulons")
  )
p

#########
plotRSS_oneSet(rss, setName = "C1(TME Adapted)") # cluster ID
plotRSS 结果:
官网提供了plotRSS结果,里面比较关键的是Z.value值,越高就说明该regulon与某一群细胞的关系最显著。

plotRSS_oneSet 结果,将气泡图的结果进一步可视化了。

5.计算TFs平均活性
# 计算每个细胞组中各调控子(regulon)的平均活性,并将这些平均活性值存储在一个矩阵中
# cellsPerGroup这里得到是不同细胞群中的样本列表
# function(x)rowMeans(getAUC(sub_regulonAUC)[,x])可以计算每个细胞群的regulon平均AUC值
regulonActivity_byGroup <- sapply(cellsPerGroup,
                                  function(x)
                                  rowMeans(getAUC(sub_regulonAUC)[,x]))
range(regulonActivity_byGroup)

# 过滤—但是这种方法可能不太对
# regulonActivity_byGroup_filtered <- regulonActivity_byGroup[apply(regulonActivity_byGroup, 1, function(row) all(row >= 0.05)), ]
# regulonActivity_byGroup <- regulonActivity_byGroup_filtered

# 对结果进行归一化
regulonActivity_byGroup_Scaled <- t(scale(t(regulonActivity_byGroup),
                                          center = T, scale=T))

# 同一个regulon在不同cluster的scale处理
dim(regulonActivity_byGroup_Scaled)
regulonActivity_byGroup_Scaled=regulonActivity_byGroup_Scaled[]
regulonActivity_byGroup_Scaled=na.omit(regulonActivity_byGroup_Scaled)
6.可视化-展示转录因子平均活性(全部)
library(ComplexHeatmap)
library(circlize)
Heatmap(
  regulonActivity_byGroup_Scaled,
  name                         = "z-score",
  col                          = colorRamp2(seq(from=-2,to=2,length=11),
                                            rev(brewer.pal(11, "Spectral"))),
  show_row_names               = TRUE,
  show_column_names            = TRUE,
  row_names_gp                 = gpar(fontsize = 12),
  clustering_method_rows = "ward.D2",
  clustering_method_columns = "ward.D2",
  row_title_rot                = 0,
  cluster_rows                 = TRUE,
  cluster_row_slices           = FALSE,
  cluster_columns              = FALSE
  )
要注意这里虽然写了是z-score但是并非RSS值,不过这种评分方式也是官网所推荐的。

6. 曾老师的方案—基于平均活性
这种方式采用了将得到的scaled Data进行不同组别的差异分析
library(dplyr)
rss=regulonActivity_byGroup_Scaled
head(rss)
df = do.call(rbind,
             lapply(1:ncol(rss), function(i){
               dat= data.frame(
                 path  = rownames(rss), # 当前regulon的名称
                 cluster = colnames(rss)[i], # 当前cluster的名称
                 sd.1 = rss[,i], # 当前cluster中每个调控因子的值
                 sd.2 = apply(rss[,-i], 1, median)  #除了当前cluster之外的所有cluster 中该调控因子的中位值
               )
             }))
df$fc = df$sd.1 - df$sd.2

top5 <- df %>%
  group_by(cluster) %>%
  top_n(5, fc)
rowcn = data.frame(path = top5$cluster)
n = rss[top5$path,]

breaksList = seq(-1.5, 1.5, by = 0.1)
colors <- colorRampPalette(c("#336699", "white", "tomato"))(length(breaksList))
pdf("TFs_output.pdf", width = 6, height = 10)
pheatmap(n,
         annotation_row = rowcn,
         color = colors,
         cluster_rows = F,
         cluster_cols = FALSE,
         show_rownames = T,
         #gaps_col = cumsum(table(annCol$Type)),  # 使用排序后的列分割点
         #gaps_row = cumsum(table(annRow$Methods)), # 行分割
         fontsize_row = 12,
         fontsize_col = 12,
         annotation_names_row = FALSE)
dev.off()

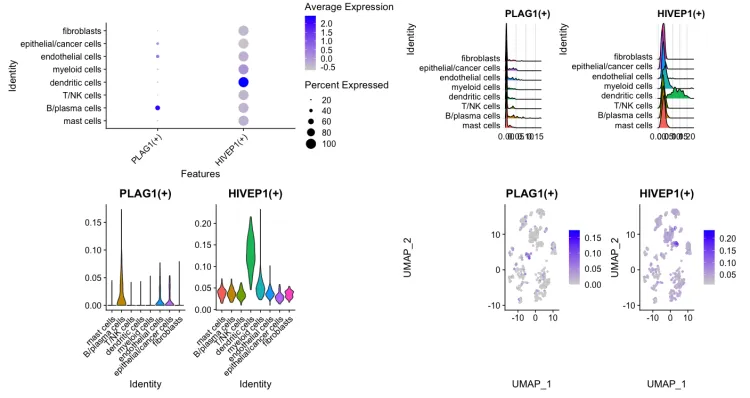
7. 特定转录因子绘图
library(SummarizedExperiment)
seurat.data <- sce
Idents(seurat.data) <- "celltype"
regulonsToPlot = c("PLAG1(+)","HIVEP1(+)")
regulonsToPlot %in% row.names(sub_regulonAUC)
seurat.data@meta.data = cbind(seurat.data@meta.data ,
                              t(assay(sub_regulonAUC[regulonsToPlot,])))

# Vis
p1 = DotPlot(seurat.data, features = unique(regulonsToPlot)) + RotatedAxis()
p2 = RidgePlot(seurat.data, features = regulonsToPlot , ncol = 2)
p3 = VlnPlot(seurat.data, features = regulonsToPlot,pt.size = 0)
p4 = FeaturePlot(seurat.data,features = regulonsToPlot)

wrap_plots(p1,p2,p3,p4)

参考资料:
-
scenic:
https://scenic.aertslab.org/tutorials/
-
SCopeLoomR:
https://htmlpreview.github.io/?https://github.com/aertslab/SCopeLoomR/blob/master/vignettes/SCopeLoomR_Seurat_tutorial.nb.html
-
生信技能树/生信随笔:
https://mp.weixin.qq.com/s/GCpeNvZ9BjtC_TXlb69xjw
https://mp.weixin.qq.com/s/pN4qWdUszuGqr8nOJstn8w
致谢:感谢曾老师以及生信技能树团队全体成员。
注:若对内容有疑惑或者有发现明确错误的朋友,请联系后台(欢迎交流)。更多内容可关注公众号:生信方舟
- END -


