概念
什么是Prometheus?
Prometheus受启发于Google的Brogmon监控系统(相似kubernetes是从Brog系统演变而来), 从
2012年开始由google工程师Soundclouds使用Go语言开发的开源监控报警系统和时序列数据库
(TSDB)。,并且与2015年早起对外发布早期版本。
2016年由Google发起Linux基金会旗下的原生云基金会(Cloud Native Computing Foundation), 将
Prometheus纳入其下第二大开源项目。
Prometheus的特点
多维度数据模型。
灵活的查询语言PromQL。
不依赖分布式存储,单个服务器节点是自主的。
通过基于HTTP的pull方式采集时序数据。
可以通过中间网关进行时序列数据推送。
通过服务发现或者静态配置来发现目标服务对象。
支持多种多样的图表和界面展示,比如Grafana等。
Prometheus组件
Prometheus Server 根据配置完成数据采集, 服务发现以及数据存储,提供PromQL查询语言的
支持。
Alertmanager 警告管理器,用来进行报警。
Exporters(探针): 是Prometheus的一类数据采集组件的总称。它负责从目标处搜集数据,并将
其转化为Prometheus支持的格式。与传统的数据采集组件不同的是,它并不向中央服务器发送数
据,而是等待中央服务器主动前来抓取。
Push Gateway 支持临时性Job主动推送指标的中间网关。
Prometheus原理
Prometheus的基本原理是通过HTTP协议周期性抓取被监控组件的状态,任意组件只要提供对应的HTTP接口就可以接入监控。不需要任何SDK或者其他的集成过程。这样做非常适合做虚拟化环境监控系统,比如VM、Docker、Kubernetes等。输出被监控组件信息的HTTP接口被叫做exporter 。目前互联网公司常用的组件大部分都有exporter可以直接使用,比如Varnish、Haproxy、Nginx、MySQL、Linux系统信息(包括磁盘、内存、CPU、网络等等)。
系统说明
三台centos7虚拟机
[root@node1 ~]# cat /etc/redhat-release CentOS Linux release 7.9.2009 (Core)
| 角色 | 主机名 | ip |
|---|---|---|
| Prometheus服务器 | server | 192.168.50.162 |
| grafana服务器 | grafana | 192.168.50.163 |
| 被监控的linux主机 | agent | 192.168.50.164 |
环境准备
1.各自配置好主机名
hostnamectl set-hostname xxx
2.三台都互相绑定IP与主机名
192.168.50.162 server
192.168.50.163 agent
192.168.50.164 grafana
3.配置时间同步
yum install -y chronyd
vim /etc/chronyd.conf
#添加一下内容
server ntp1.aliyun.com iburst
重启服务
···
systemctl restart chronyd
[root@master prometheus]# chronyc sources
^* 120.25.115.20 2 7 40 879 -33us[ -261us] +/- 19ms
···
4.关闭防火墙和selinux
systemctl stop firewalld
systemctl disable firewalld
sed -i '/^SELINUX=/ cSELINUX=disabled' /etc/selinux/config
setenforce 0
Prometheus安装与使用
安装
下载软件
1.前往官网https://prometheus.io/download/,找到对应版本
wget -c https://github.com/prometheus/prometheus/releases/download/v2.53.2/prometheus-2.53.2.linux-amd64.tar.gz
2.解压软件
tar -xf prometheus-2.53.2.linux-amd64.tar.gz
#创建软连接
cd /usr/local
ln -sv prometheus-2.53.2.linux-amd64/ prometheus
3.创建数据目录
mkdir /usr/local/prometheus/data
4.创建服务运行用户
useradd prometheus -M -s /sbin/nologin
修改权限
chown -R prometheus.prometheus /usr/local/prometheus/*
5.创建服务运行脚本
vim /usr/lib/systemd/system/prometheus.service
[Unit]
cription=prometheus
After=network.target
[Service]
Type=simple
User=prometheus
ExecStart=/usr/local/prometheus-2.53.2.linux-amd64/prometheus --config.file=/usr/local/prometheus-2.53.2.linux-amd64/prometheus.yml --storage.tsdb.path=/usr/local/prometheus-2.53.2.linux-amd64/prometheus-2.53.2.linux-amd64/data
Restart=on-failure
ExecReload=/bin/kill -HUP $MAINPID
[Install]
WantedBy=multi-user.target
6.启动服务
systemctl daemon-reload
systemctl enable --now prometheus.service
检查服务
systemctl is-active prometheus.service
active
systemctl is-enabled prometheus.service
enabled
检查端口
[root@master prometheus]# netstat -lnupt | grep 9090
tcp6       0      0 :::9090                 :::*                    LISTEN      77034/prometheus
3.web界面
访问ip:9090即可进入web页面
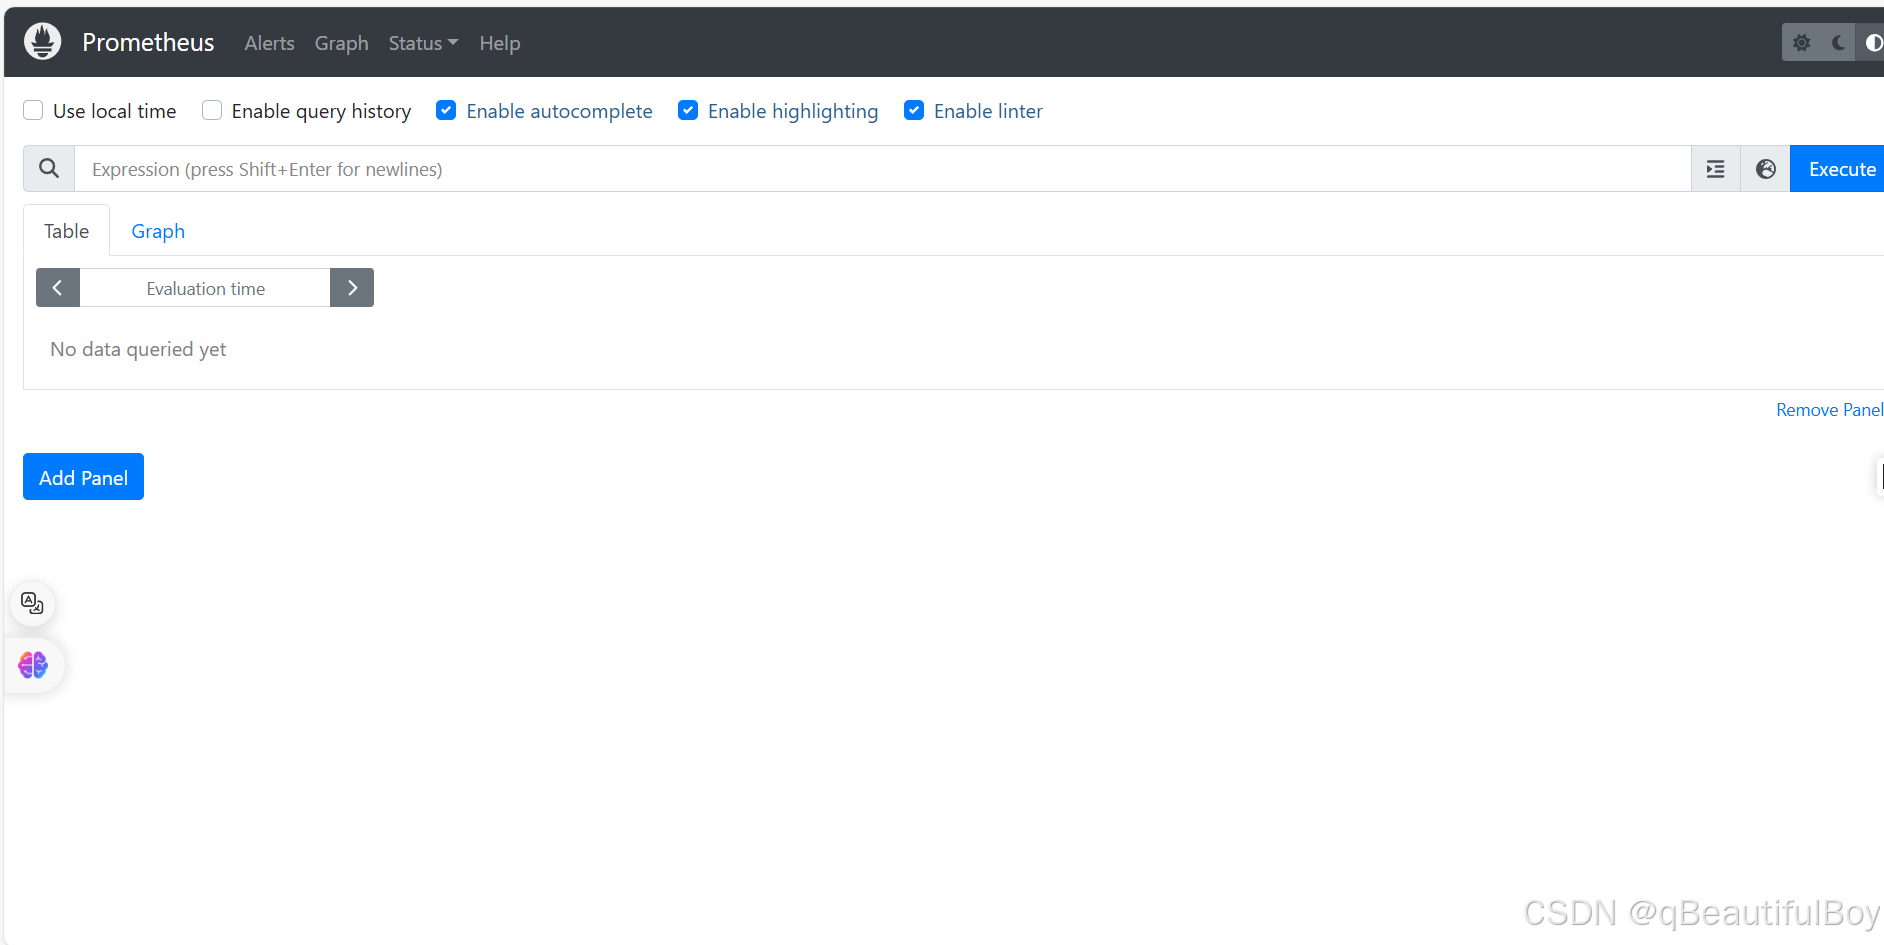
默认只监视当前一台主机
此时点击http://master:9090/metrics会显示无法访问

将master改为主机ip即可
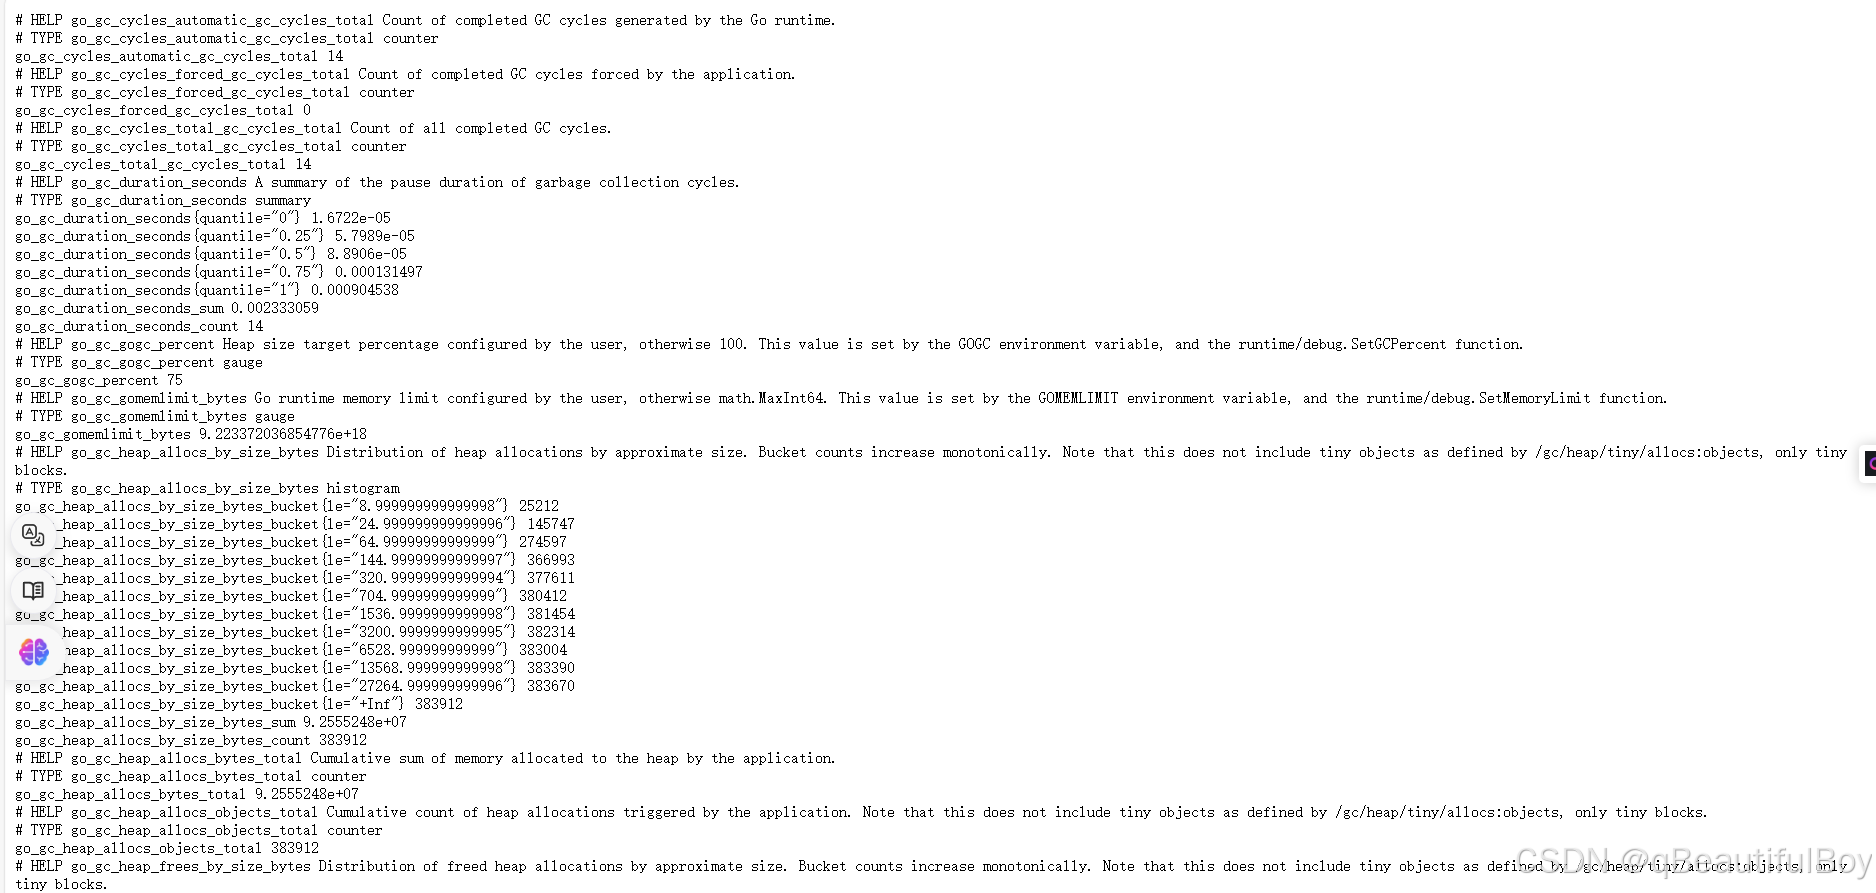
通过http://服务器IP:9090/metrics可以查看到监控的数据
[root@master prometheus]# curl http://192.168.50.162:9090/metrics
# HELP go_gc_cycles_automatic_gc_cycles_total Count of completed GC cycles generated by the Go runtime.
# TYPE go_gc_cycles_automatic_gc_cycles_total counter
go_gc_cycles_automatic_gc_cycles_total 11
# HELP go_gc_cycles_forced_gc_cycles_total Count of completed GC cycles forced by the application.
# TYPE go_gc_cycles_forced_gc_cycles_total counter
go_gc_cycles_forced_gc_cycles_total 0
# HELP go_gc_cycles_total_gc_cycles_total Count of all completed GC cycles.
# TYPE go_gc_cycles_total_gc_cycles_total counter
go_gc_cycles_total_gc_cycles_total 11
# HELP go_gc_duration_seconds A summary of the pause duration of garbage collection cycles.
# TYPE go_gc_duration_seconds summary
go_gc_duration_seconds{quantile="0"} 1.6722e-05
go_gc_duration_seconds{quantile="0.25"} 5.7989e-05
go_gc_duration_seconds{quantile="0.5"} 8.8906e-05
go_gc_duration_seconds{quantile="0.75"} 0.000240731
go_gc_duration_seconds{quantile="1"} 0.000904538
go_gc_duration_seconds_sum 0.002091826
go_gc_duration_seconds_count 11
# HELP go_gc_gogc_percent Heap size target percentage configured by the user, otherwise 100. This value is set by the GOGC environment variable, and the runtime/debug.SetGCPercent function.
# TYPE go_gc_gogc_percent gauge
go_gc_gogc_percent 75
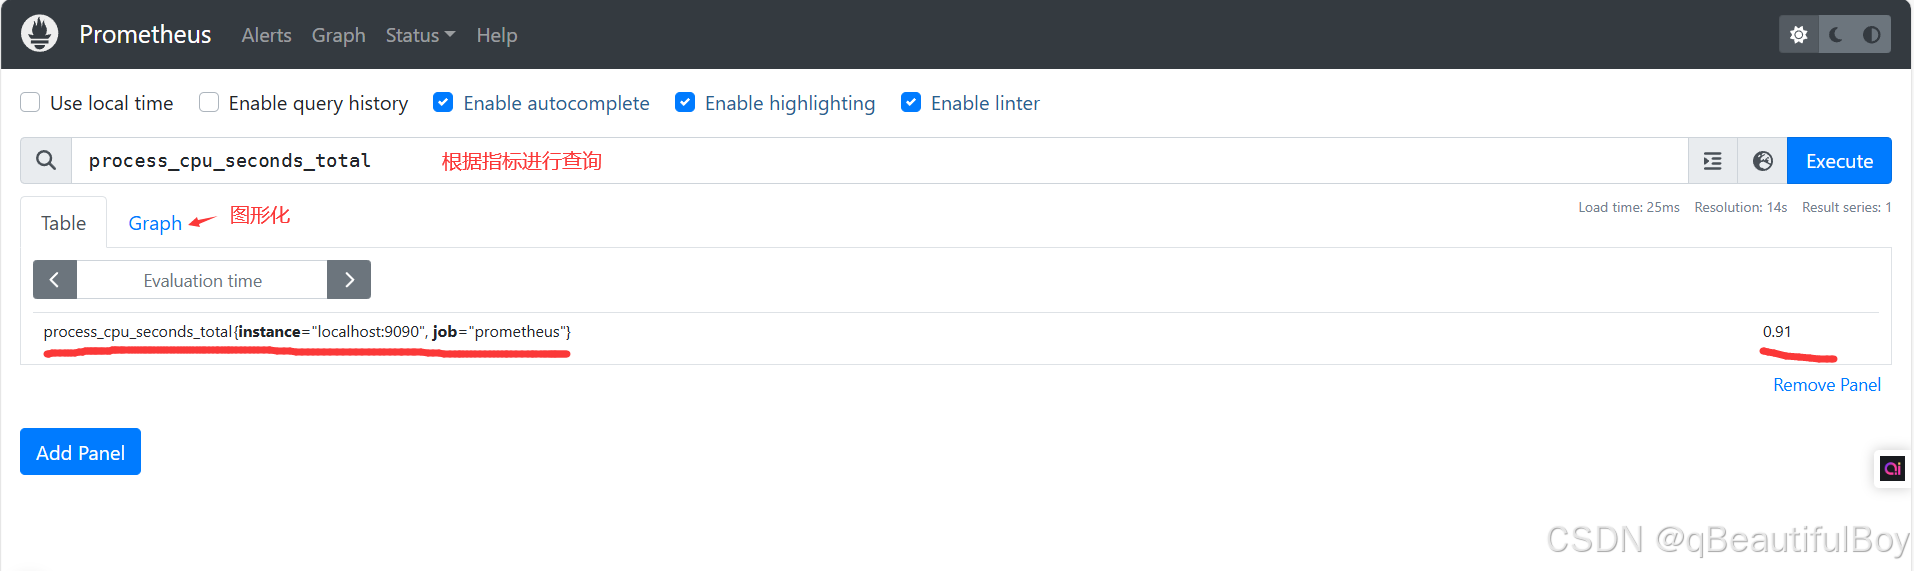
查询数据
监控案例练习
1.监控linux主机
使用Node Exporter采集主机运行数据
在Prometheus的架构设计中, Prometheus Server并不直接服务监控特定的目标, 其主要任务负责数据的收集,存储并且对外提供数据查询支持。 因此为了能够能够监控到某些东西, 如主机的CPU使用率, 我们需要使用到Exporter。 Prometheus周期性的从Exporter暴露的HTTP服务地址( 通常
是/metrics) 拉取监控样本数据。
为了能够采集到主机的运行指标如CPU, 内存, 磁盘等信息。 可以使用Node Exporter。
Node Exporter同样采用Golang编写, 并且不存在任何的第三方依赖, 只需要下载, 解压即可运行。
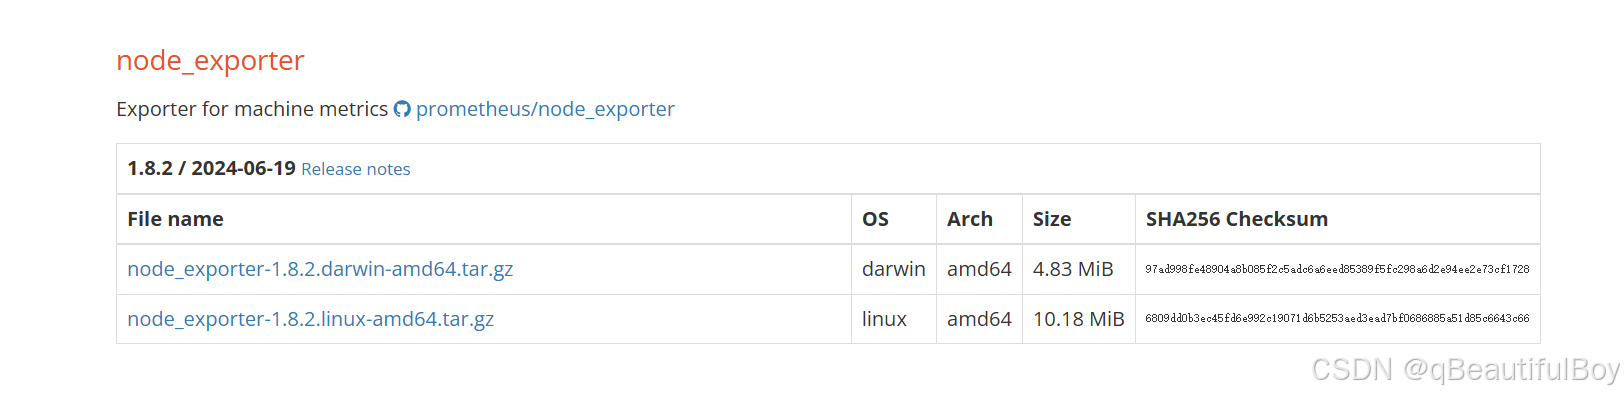
在官网中找到,复制下载链接,在被监控的linux主机上下载Node Exporter
[root@node2 local]# wget -c https://github.com/prometheus/node_exporter/releases/download/v1.8.2/node_exporter-1.8.2.linux-amd64.tar.gz
解压:
[root@node2 local]# tar -xf node_exporter-1.8.2.linux-amd64.tar.gz
[root@node2 local]# ll
total 10428
drwxr-xr-x. 2 root root        6 Apr 10  2018 bin
drwxr-xr-x. 2 root root        6 Apr 10  2018 etc
drwxr-xr-x. 2 root root        6 Apr 10  2018 games
drwxr-xr-x. 2 root root        6 Apr 10  2018 include
drwxr-xr-x. 2 root root        6 Apr 10  2018 lib
drwxr-xr-x. 2 root root        6 Apr 10  2018 lib64
drwxr-xr-x. 2 root root        6 Apr 10  2018 libexec
drwxr-xr-x. 2 1001 1002       56 Jul 14 04:58 node_exporter-1.8.2.linux-amd64
-rw-r--r--. 1 root root 10676343 Jul 14 04:58 node_exporter-1.8.2.linux-amd64.tar.gz
drwxr-xr-x. 2 root root        6 Apr 10  2018 sbin
drwxr-xr-x. 5 root root       49 Aug 10 04:08 share
drwxr-xr-x. 2 root root        6 Apr 10  2018 src
创建服务运行用户
useradd prometheus -M -s /sbin/nologin
修改权限
chown -R prometheus.prometheus /usr/local/node_exporter-1.8.2.linux-amd64/*
添加系统服务
vim /usr/lib/systemd/system/node_exporter.service
[Unit]
Description=node_exporter
After=network.target
[Service]
Type=simple
User=prometheus
ExecStart=/usr/local/node_exporter-1.8.2.linux-amd64/node_exporter
Restart=on-failure
[Install]
WantedBy=multi-user.target
启动服务:
systemctl daemon-reload
systemctl start node_exporter.service
[root@node2 local]# systemctl is-active node_exporter.service
active
[root@node2 local]# netstat -lnupt | grep 9100
tcp6       0      0 :::9100                 :::*                    LISTEN      85999/node_exporter
验证:
此时浏览器访问 http://被监控端IP:9100/metrics 就可以查看到node_exporter在被监控端收集的监控信息

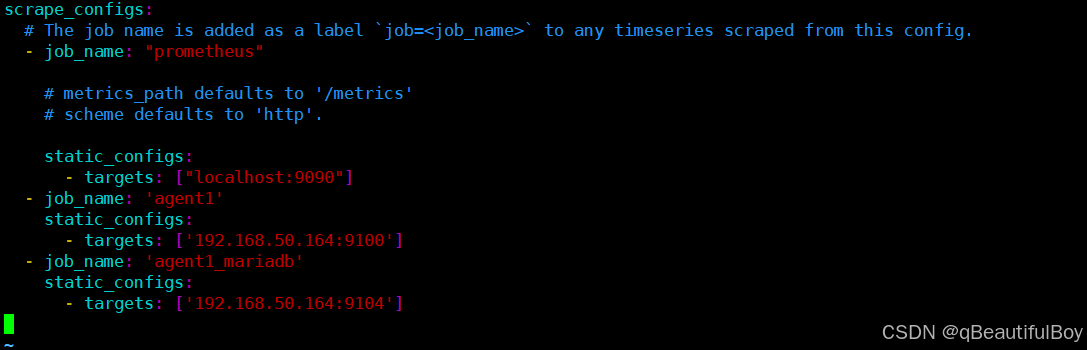
要想在prumetheus server端的web界面中看到被监控端linux主机的数据,还要在Prometheus主配置文件中加入一下配置
[root@master prometheus]# vim /usr/local/prometheus/prometheus.yml
  - job_name: 'agent1'
    static_configs:
      - targets: ['192.168.50.164:9100']

重启服务
[root@master prometheus]# systemctl daemon-reload
[root@master prometheus]#  systemctl restart prometheus.service
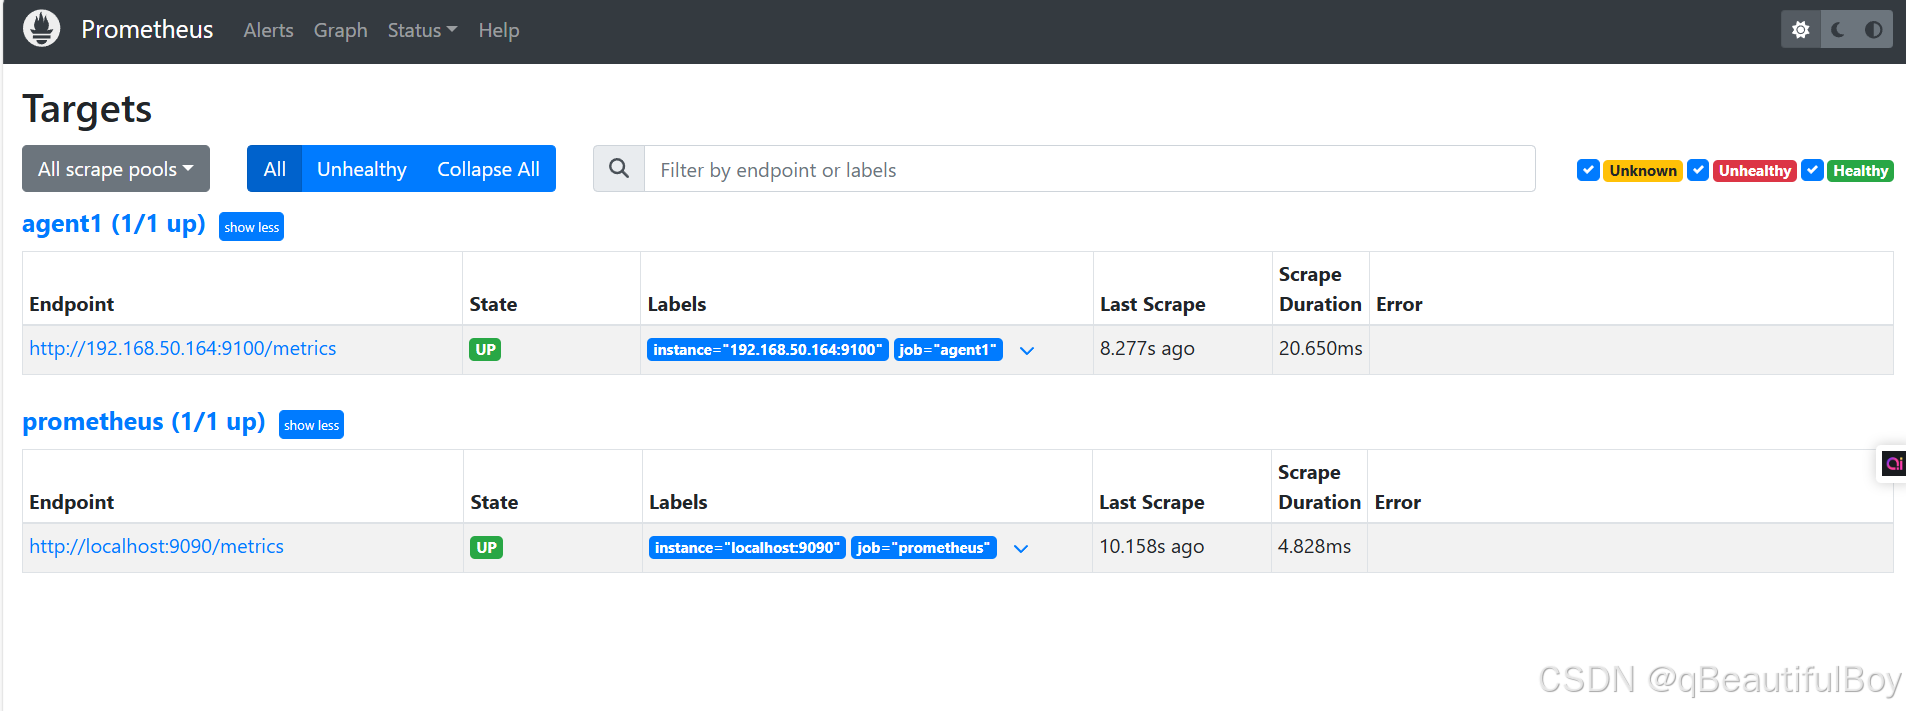
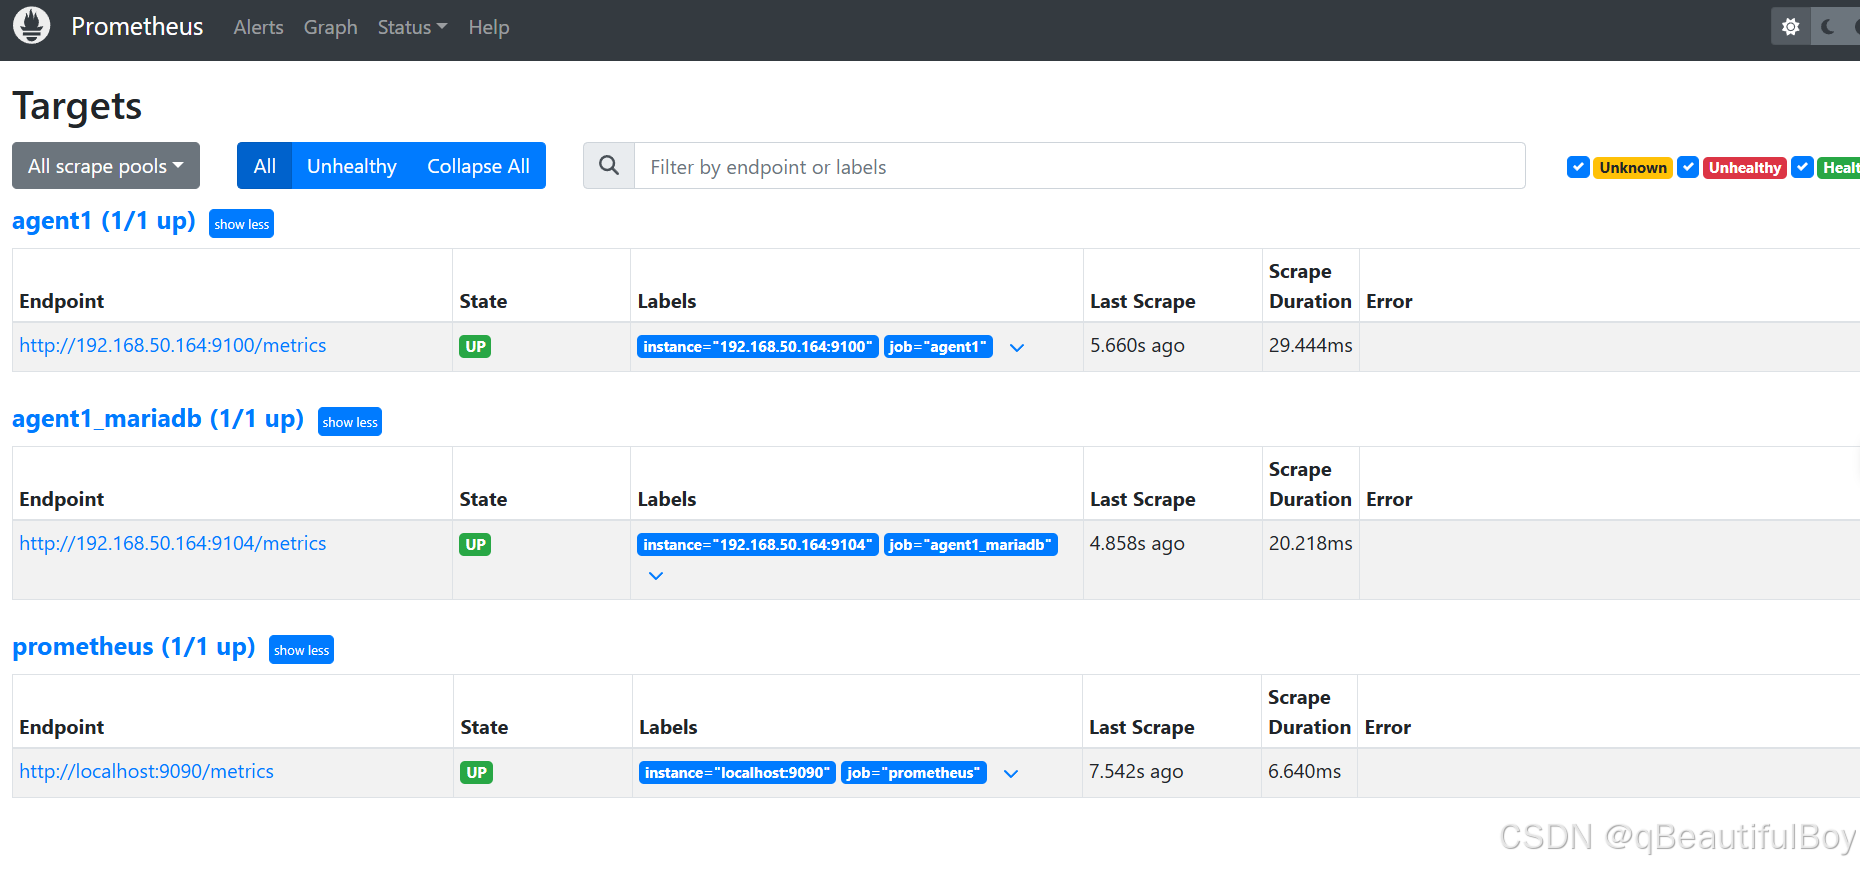
在访问web页面即可看到被监控端主机
2.监控远程Mysql
依旧是去官网下载mysql_exporter组件
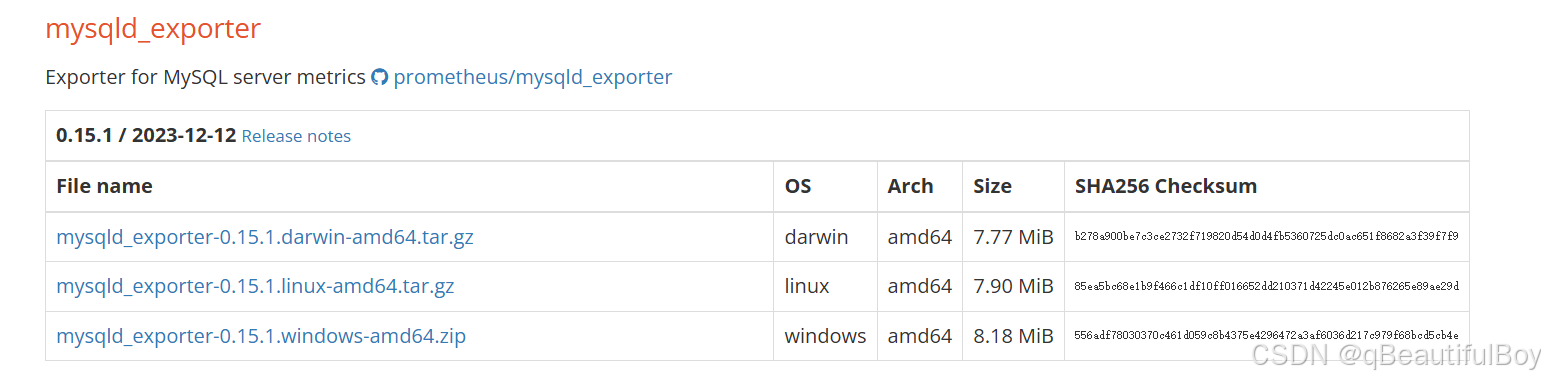
下载组件:
wget -c https://github.com/prometheus/mysqld_exporter/releases/download/v0.15.1/mysqld_exporter-0.15.1.linux-amd64.tar.gz
解压组件:
tar -xf mysqld_exporter-0.15.1.linux-amd64
安装mariadb数据库,授权账户
yum install -y mariadb-server
systemctl enable --now mariadb

mysql -e "grant select,replication client,process ON *.* to 'mysql_monitor'@'localhost' identified by '123'"
注意:授权ip为localhost,因为不是prometheus服务器来直接找mariadb获取数据,而是prometheus
服务器找mysql_exporter,mysql_exporter再找mariadb。所以这个localhost是指的
mysql_exporter的IP
创建一个mariadb配置文件,写上连接的用户名与密码(和上面的授权的用户名和密码要对应)
vim /usr/local/mysqld_exporter/.my.cnf

[client]
user=mysql_monitor
password=123
添加系统服务
vim /usr/lib/systemd/system/mysql_exporter.service

[Unit]
Description=mysqld_exporter
After=network.target
[Service]
Type=simple
User=prometheus
ExecStart=/usr/local/mysqld_exporter-0.15.1.linux-amd64/mysqld_exporter --config.my-cnf=/usr/local/mysqld_exporter-0.15.1.linux-amd64/.my.cnf
Restart=on-failure
[Install]
WantedBy=multi-user.target
启动服务
[root@node2 local]# chown -R prometheus.prometheus /usr/local/mysqld_exporter/*
[root@node2 local]# systemctl daemon-reload
[root@node2 local]# systemctl start mysql_exporter.service
[root@node2 local]# netstat -lnupt | grep 9104
tcp6 0 0 :::9104 :::* LISTEN
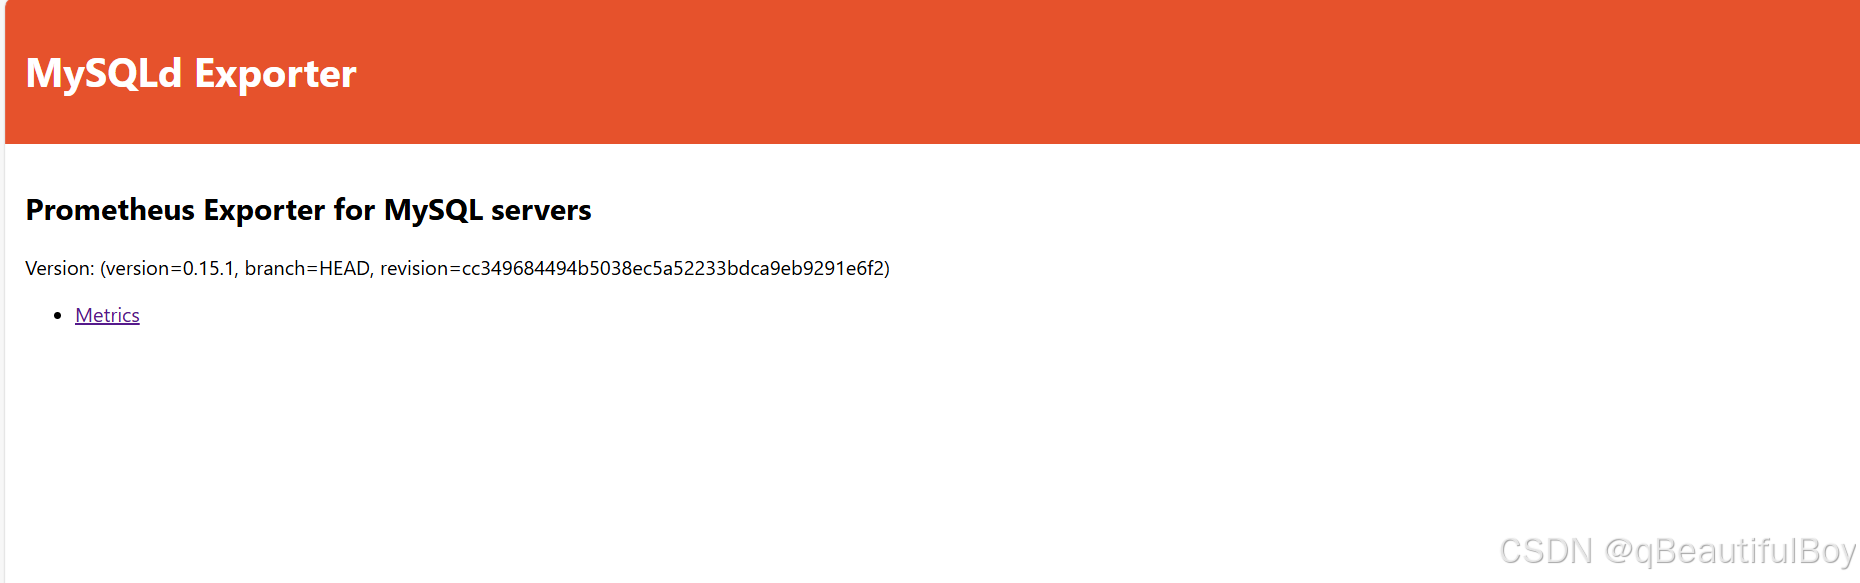
验证:
通过浏览器访问http://被监控端IP:9104/metrics就可以查看到mysql_exporter在被监控端收集的监控信息 配置文件中可更改端口
修改Prometheus配置:
添加如下配置:
[root@master prometheus]# vim /usr/local/prometheus/prometheus.yml
- job_name: 'agent1_mariadb'
static_configs:
- targets: ['192.168.50.164:9104']
重启prometheus
[root@master prometheus]# systemctl restart prometheus.service
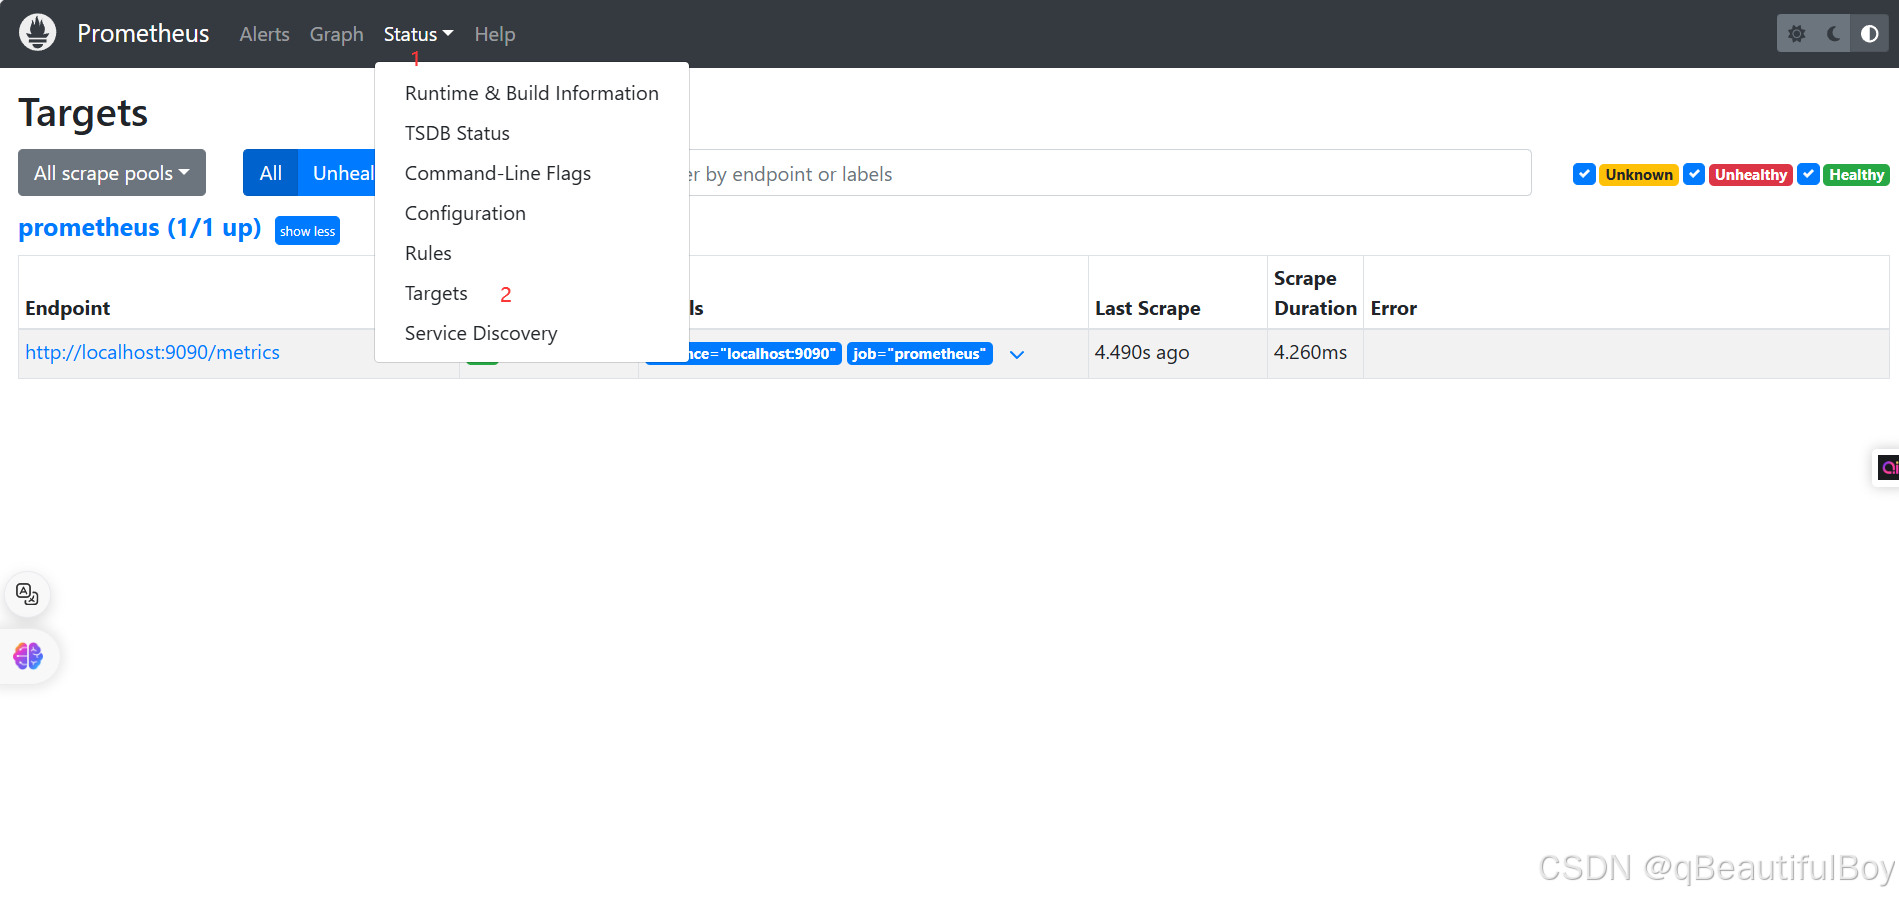
Prometheus web管理界面查看:
Grafana安装与使用
Grafana是一个跨平台的开源的度量分析和可视化工具,可以通过将采集的数据查询然后可视化的展
示,并及时通知。它主要有以下六大特点:
1、展示方式:快速灵活的客户端图表,面板插件有许多不同方式的可视化指标和日志,官方库中具有丰富的仪表盘插件,比如热图、折线图、图表等多种展示方式;
2、数据源:Graphite,InfluxDB,OpenTSDB,Prometheus,Elasticsearch,CloudWatch和KairosDB等;
3、通知提醒:以可视方式定义最重要指标的警报规则,Grafana将不断计算并发送通知,在数据达到阈值时通过Slack、PagerDuty等获得通知;
4、混合展示:在同一图表中混合使用不同的数据源,可以基于每个查询指定数据源,甚至自定义数据源;
5、注释:使用来自不同数据源的丰富事件注释图表,将鼠标悬停在事件上会显示完整的事件元数据和标记;
6、过滤器:Ad-hoc过滤器允许动态创建新的键/值过滤器,这些过滤器会自动应用于使用该数据源的所有查询。
安装
在grafana主机下载软件包
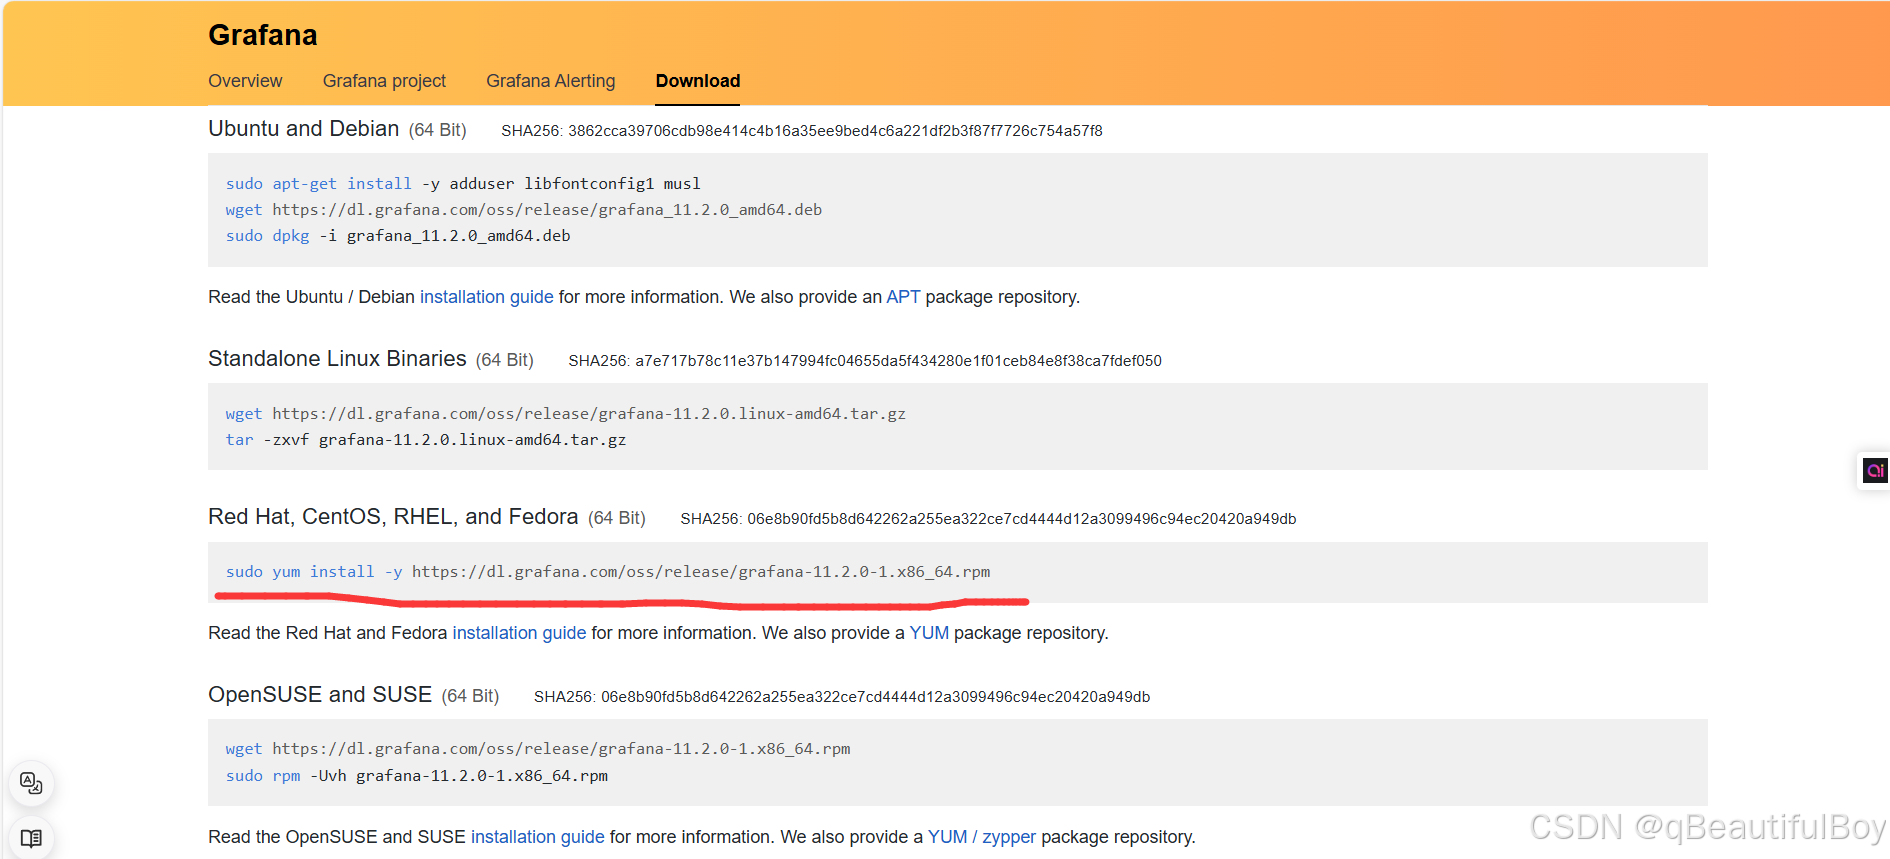
yum install -y https://dl.grafana.com/oss/release/grafana-11.2.0-1.x86_64.rpm
由于下载速度过慢,因此去阿里镜像仓库下载
增加repo源:
sudo vim /etc/yum.repos.d/grafana.repo
[grafana]
name=grafana
baseurl=https://mirrors.aliyun.com/grafana/yum/rpm
repo_gpgcheck=0
enabled=1
gpgcheck=0


##再执行
sudo yum makecache
sudo yum install grafana
如果再不行,就直接:
yum install -y https://mirrors.aliyun.com/grafana/yum/rpm/Packages/grafana-10.0.11-1.x86_64.rpm
启动服务:
[root@node1 local]# systemctl enable --now grafana-server
Created symlink from /etc/systemd/system/multi-user.target.wants/grafana-server.service to /usr/lib/systemd/system/grafana-server.service.
[root@node1 local]# netstat -lnupt | grep 3000
tcp6       0      0 :::3000                 :::*                    LISTEN      17688/grafana
使用grafana-cli 安装插件
# grafana-cli plugins list-remote 列出所有可用的插件
# grafana-cli plugins install grafana-worldmap-panel 安装世界地图插件
# grafana-cli plugins install grafana-clock-panel 安装时间插件
# grafana-cli plugins install grafana-piechart-panel 安装圆饼插件
# grafana-cli plugins ls 列出已经安装的插件
安装完毕需要重启服务
# systemctl restart grafana-server
·
使用Grafana连接Prometheus
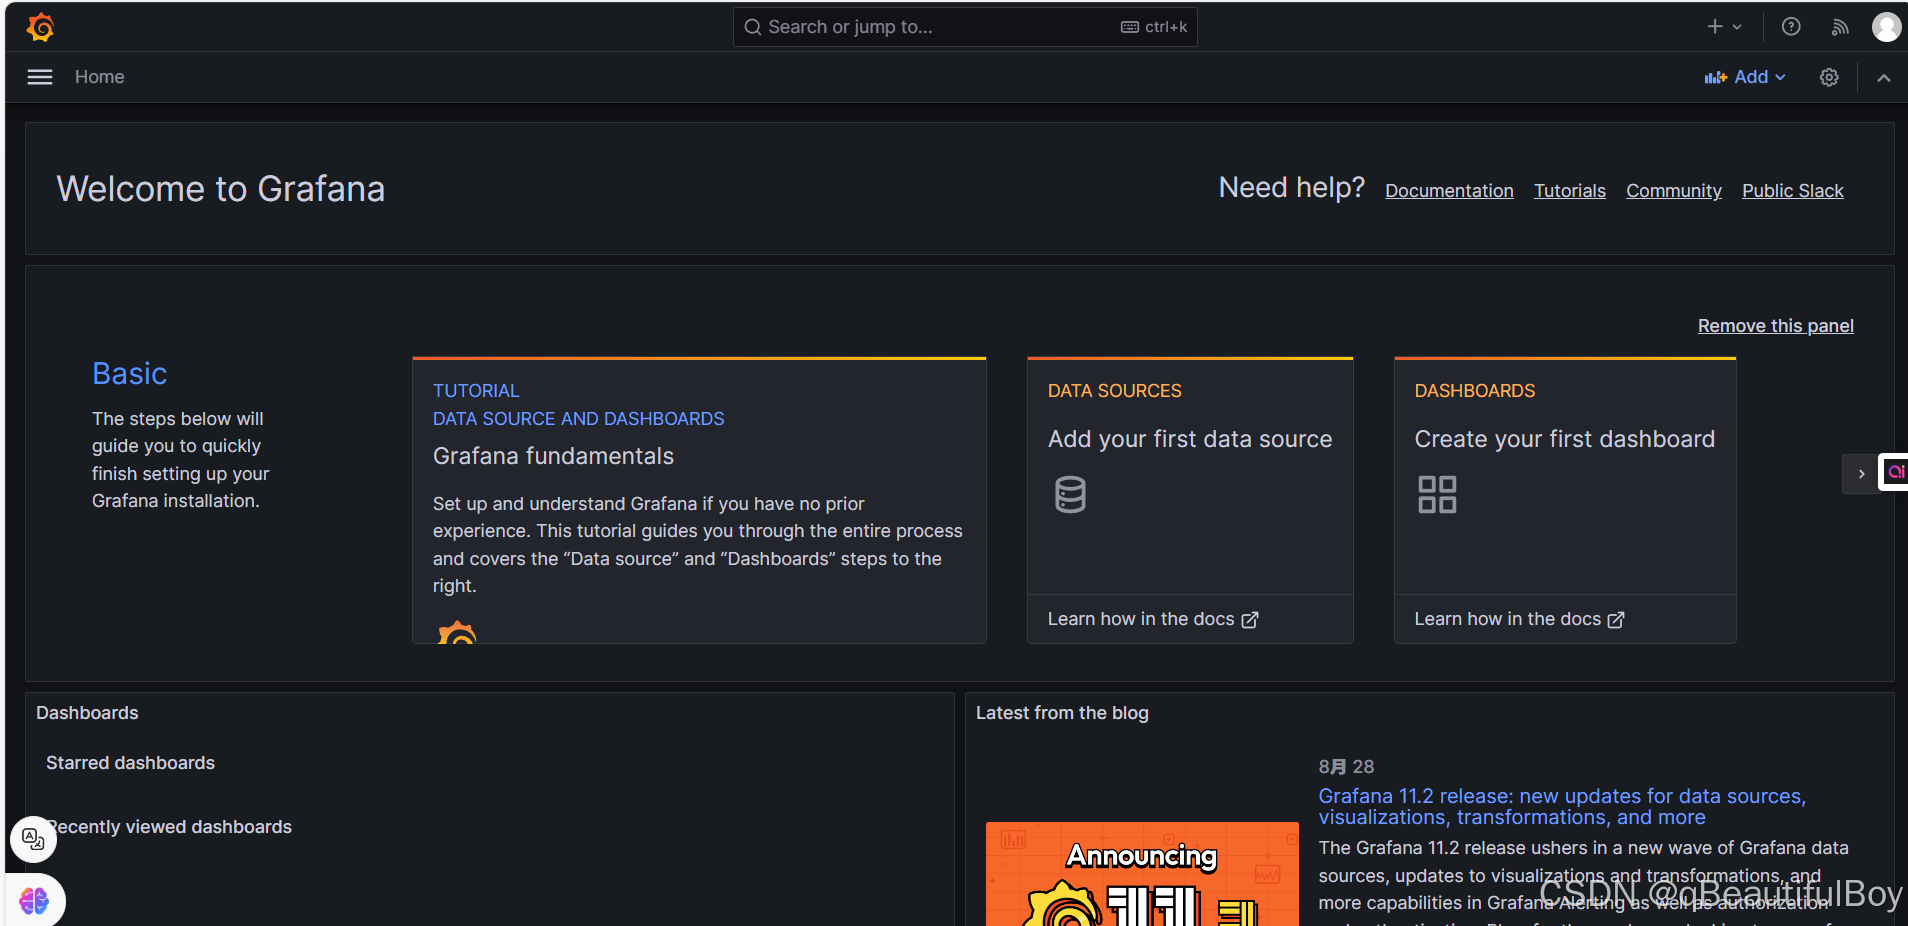
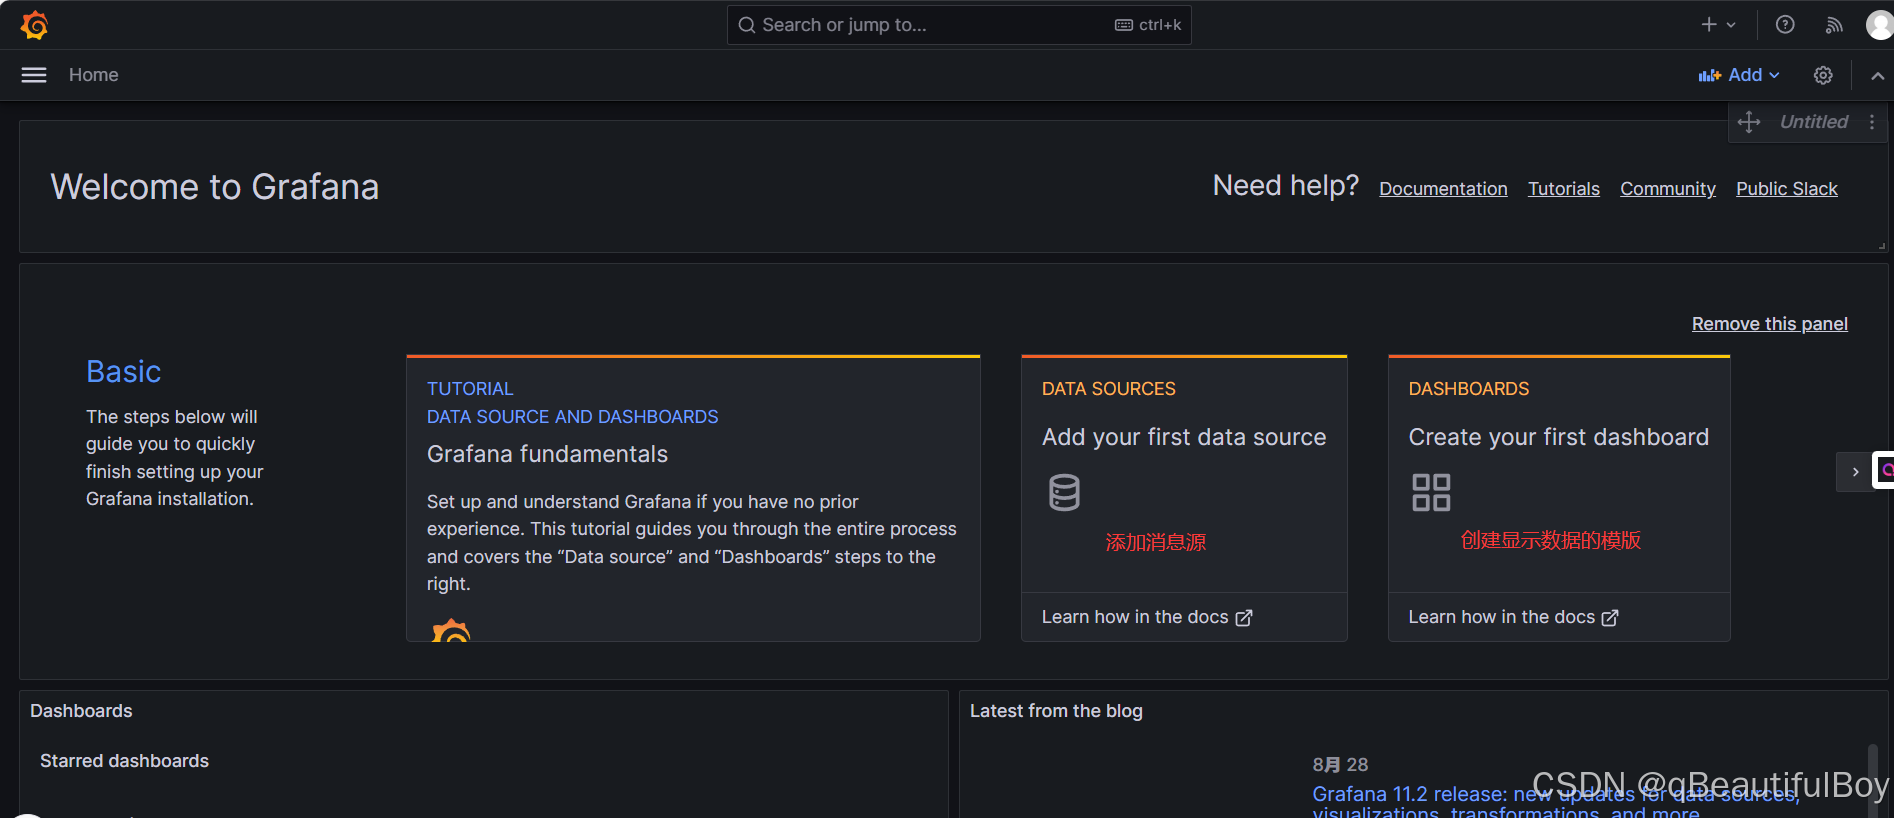
1.登录web界面
通过浏览器访问 http:// grafana服务器IP:3000就到了登录界面,使用默认的admin用户,admin密码就可以登陆了 192.168.50.163:3000
第一次需要修改admin密码
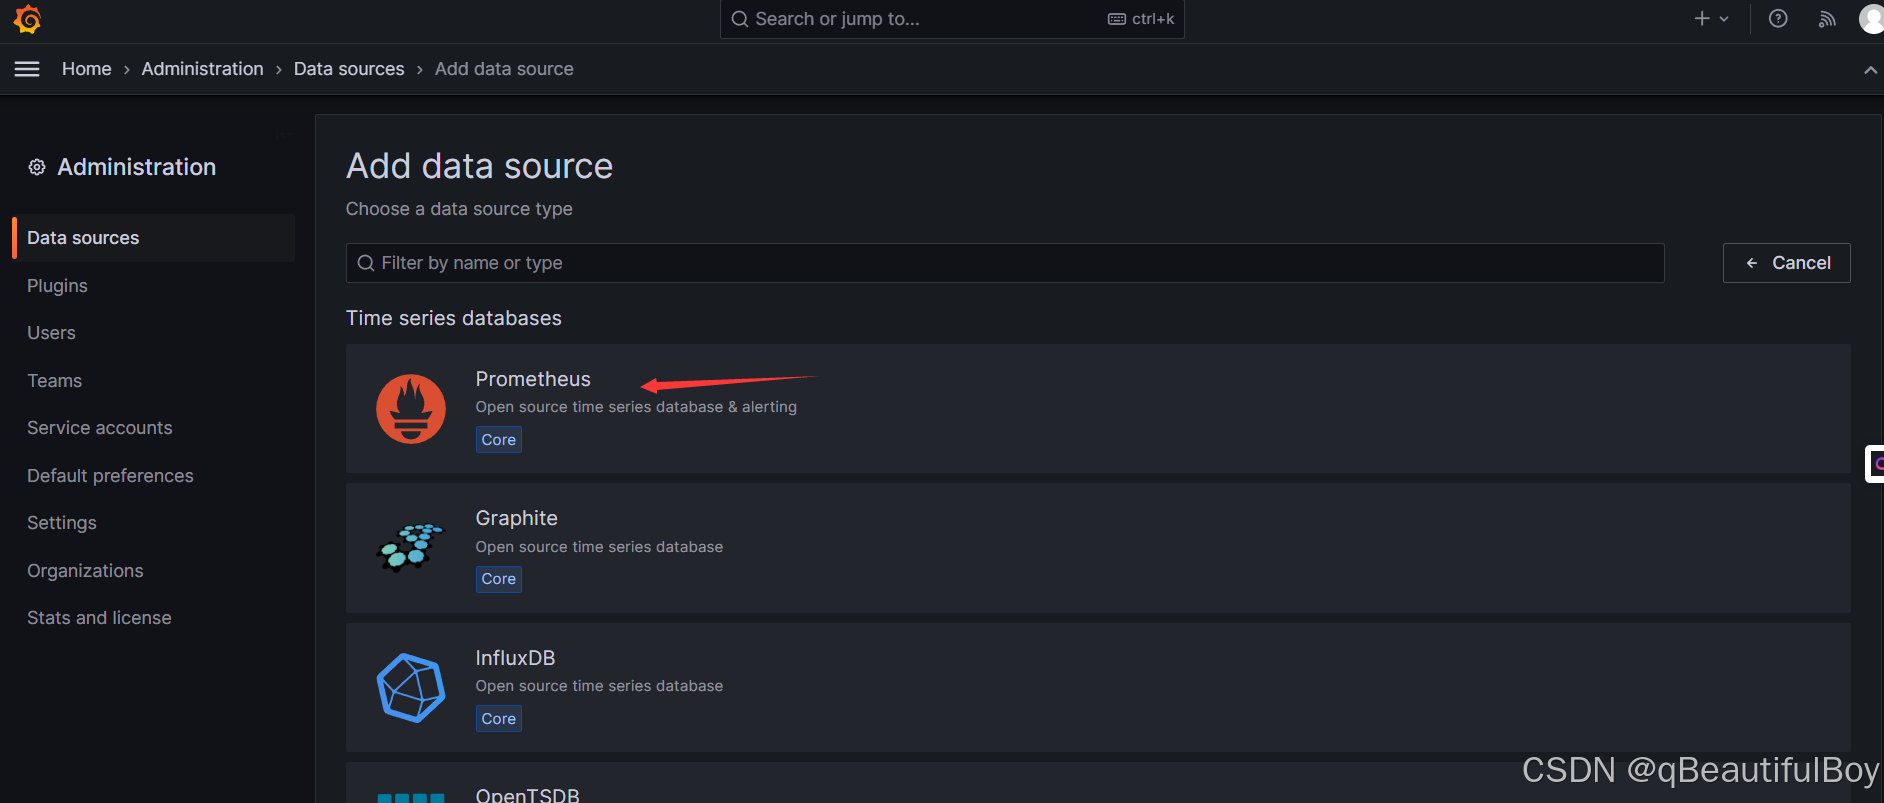
2.添加数据源
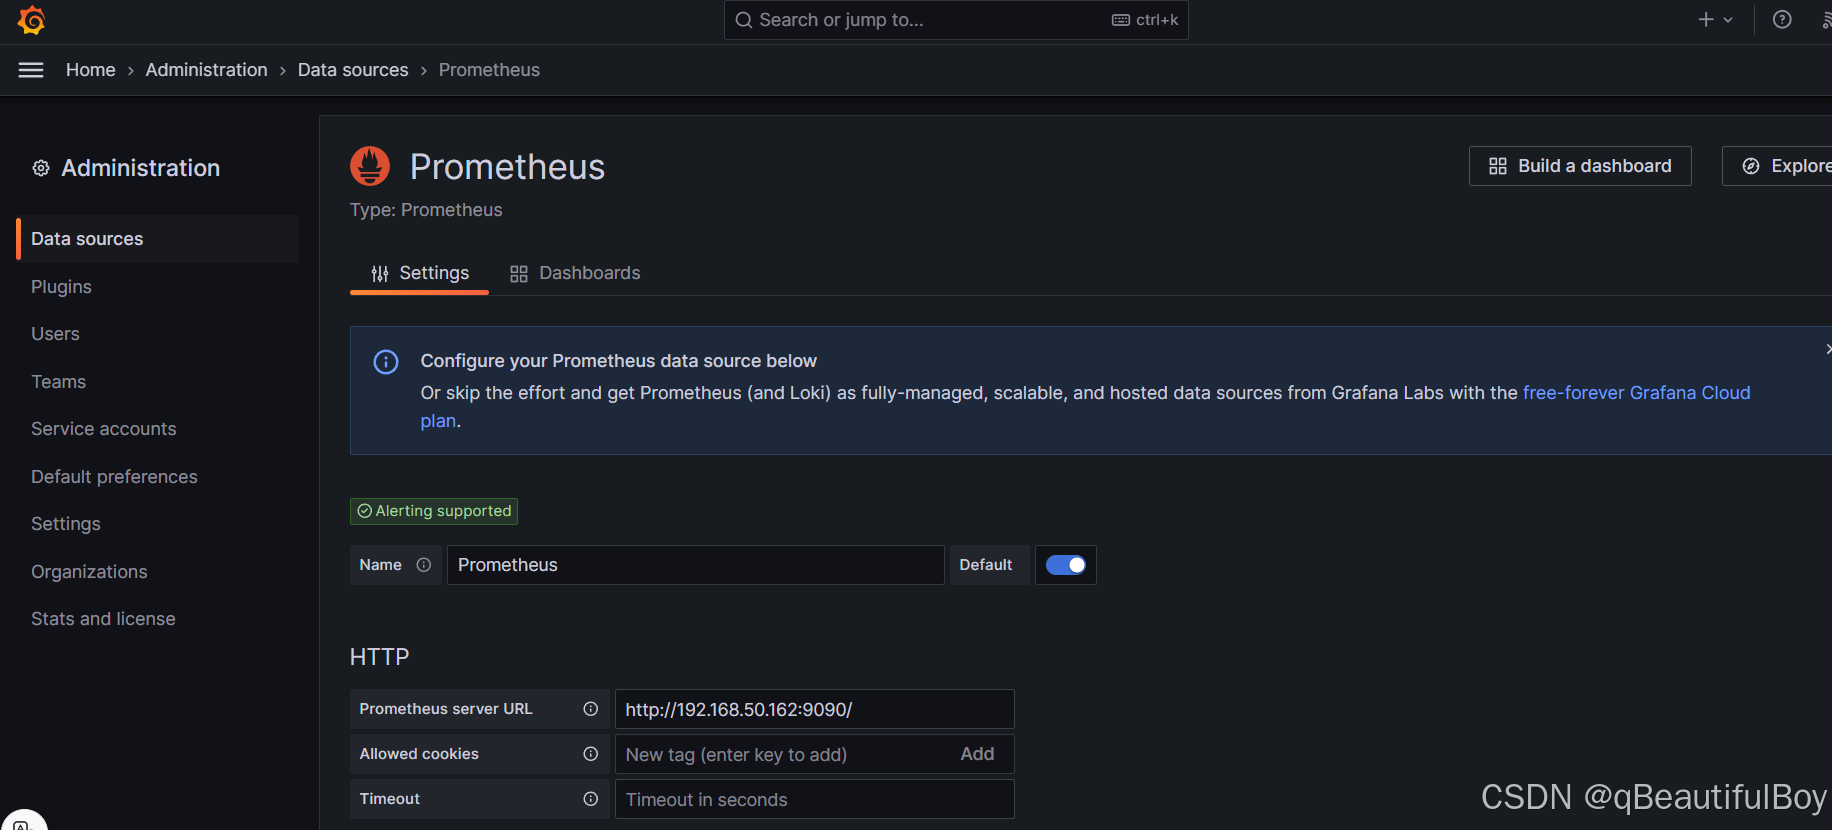
点击Prometheus
填入Prometheus端的主机ip:9090 192.168.50.162:9090
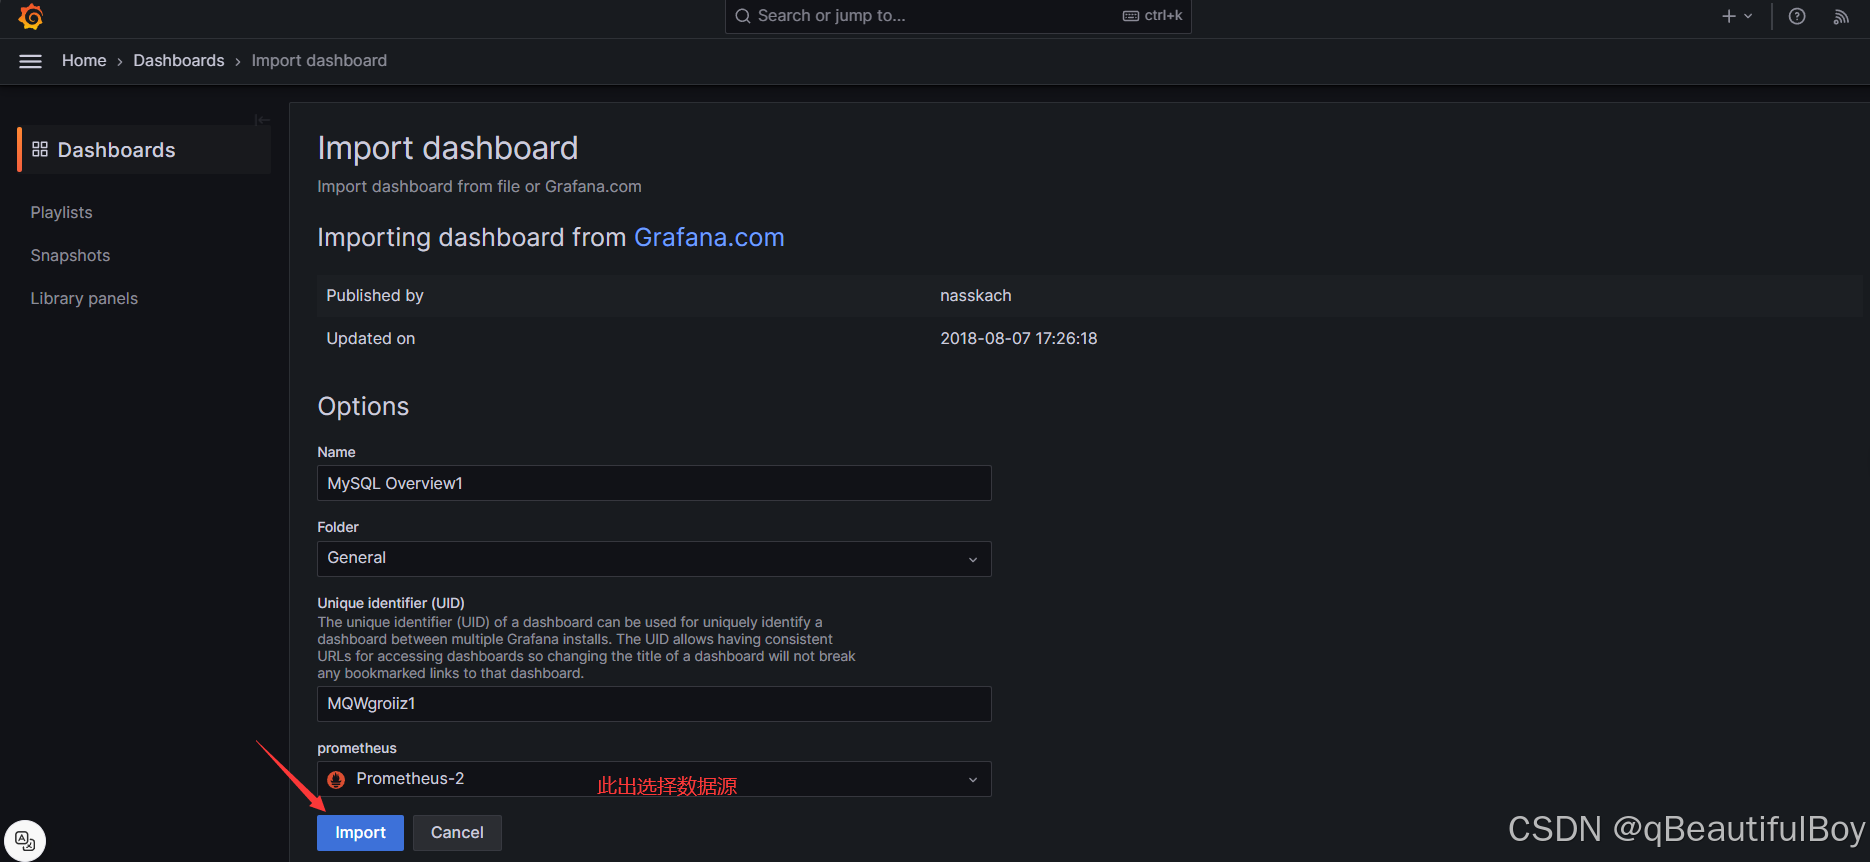
为数据源挑选展示的模版

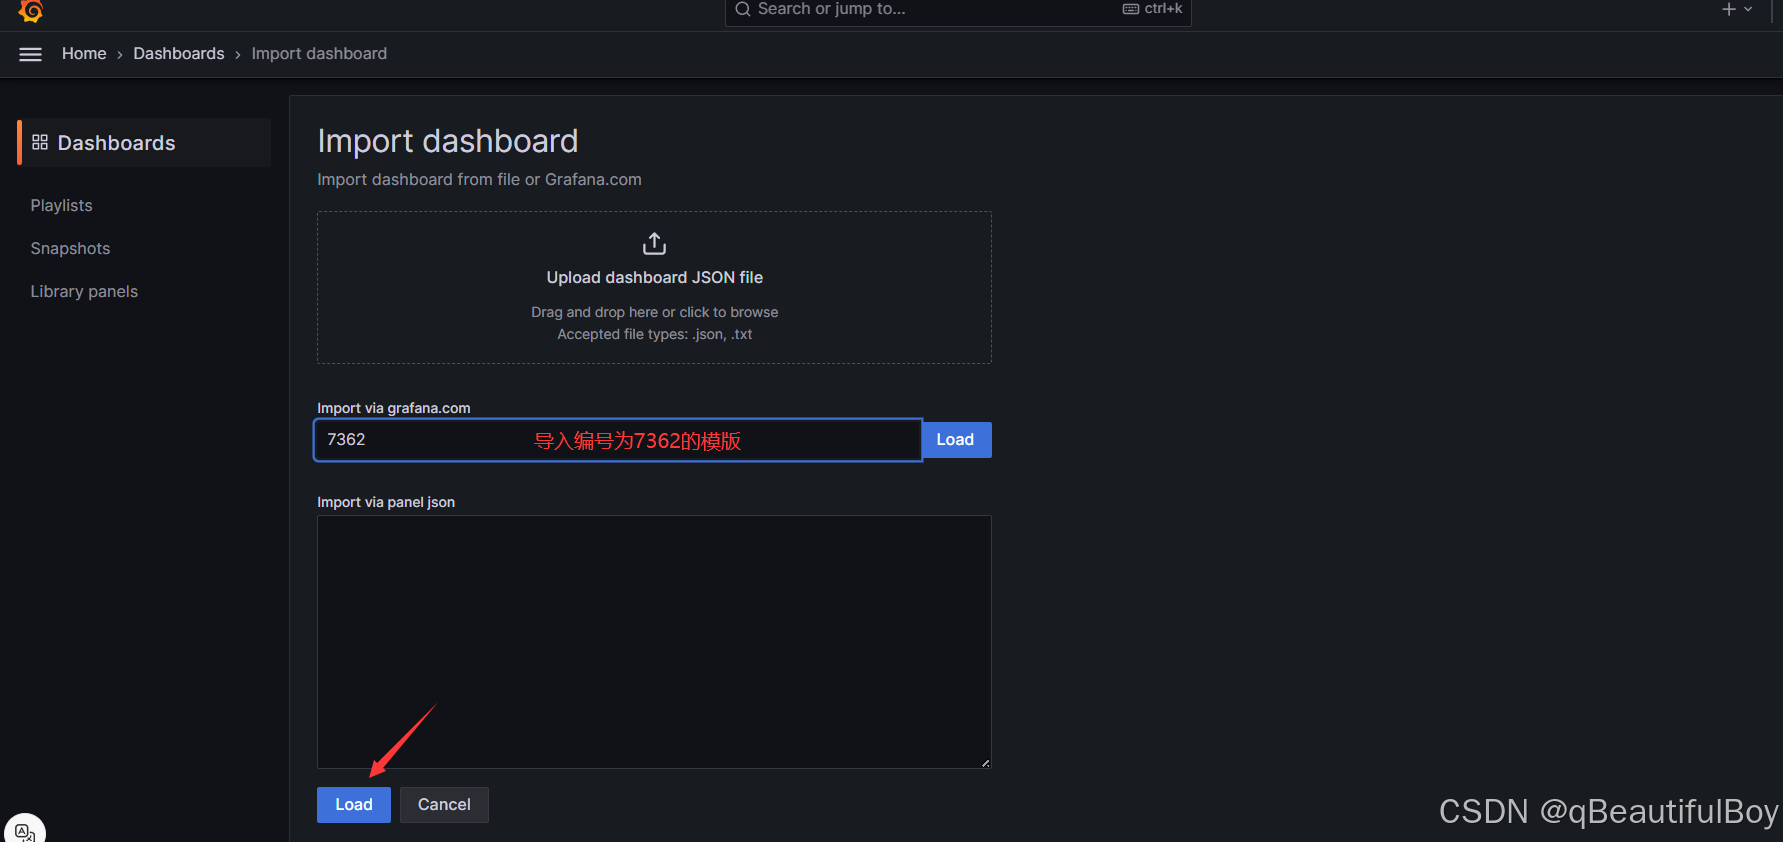 点击中间那个load,标错了
选择数据源之后,点击import
效果展示:


![[海思3403] 初始配置](https://i-blog.csdnimg.cn/direct/d992e1a8737b406e99233f67b1fbb89c.png)
