这是我的第342篇原创文章。
一、引言
Hyperopt是一个强大的python库,用于超参数优化,由jamesbergstra开发。Hyperopt使用贝叶斯优化的形式进行参数调整,允许你为给定模型获得最佳参数。它可以在大范围内优化具有数百个参数的模型。
在本节中,我们将介绍使用hyperopt在经典数据集 Iris 上调参的完整示例。
二、实现过程
2.1 准备数据
data = pd.read_csv(r'Dataset.csv')
df = pd.DataFrame(data)
print(df.head())
df:

2.2 划分数据集
target = 'target'
features = df.columns.drop(target)
print(data["target"].value_counts()) # 顺便查看一下样本是否平衡
X_train, X_test, y_train, y_test = train_test_split(df[features], df[target], test_size=0.2, random_state=0)
X = X_train
y = y_train
2.3 定义搜索空间
space4rf = {
    'max_depth': hp.choice('max_depth', range(1,20)),
    'max_features': hp.choice('max_features', range(1,5)),
    'n_estimators': hp.choice('n_estimators', range(1,20)),
    'criterion': hp.choice('criterion', ["gini", "entropy"]),
    'scale': hp.choice('scale', [0, 1]),
    'normalize': hp.choice('normalize', [0, 1])
}
2.4 搜索最优超参数
best = 0
def f(params):
    global best
    acc = hyperopt_train_test(params)
    if acc > best:
        best = acc
        print ('new best:', best, params)
    return {'loss': -acc, 'status': STATUS_OK}

trials = Trials()
best = fmin(f, space4rf, algo=tpe.suggest, max_evals=300, trials=trials)
print('best:')
print(best)
结果:

best:
![]()
2.5 可视化
parameters = ['n_estimators', 'max_depth', 'max_features', 'criterion', 'scale', 'normalize']
cmap = plt.cm.jet
for i, val in enumerate(parameters):
    print (i, val)
    xs = np.array([t['misc']['vals'][val] for t in trials.trials]).ravel()
    ys = [-t['result']['loss'] for t in trials.trials]
    xs, ys = zip(*sorted(zip(xs, ys)))
    ys = np.array(ys)
    plt.scatter(xs, ys, s=20, linewidth=0.01, alpha=0.5, c=cmap(float(i)/len(parameters)))
    plt.title(val)
    plt.show()
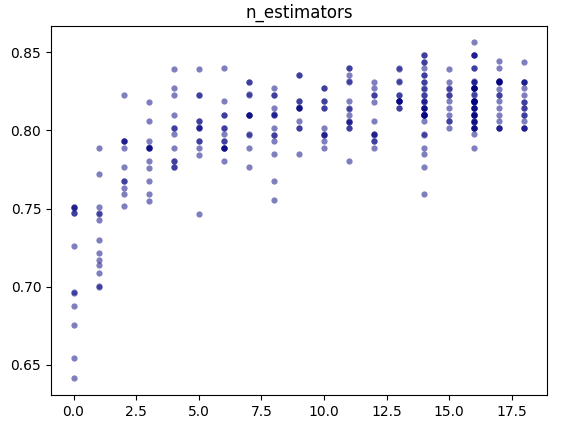
结果(仅展示一个):

可见'n_estimators': 16时准确率最高。
作者简介:
读研期间发表6篇SCI数据挖掘相关论文,现在某研究院从事数据算法相关科研工作,结合自身科研实践经历不定期分享关于Python、机器学习、深度学习、人工智能系列基础知识与应用案例。致力于只做原创,以最简单的方式理解和学习,关注我一起交流成长。需要数据集和源码的小伙伴可以关注底部公众号添加作者微信。


