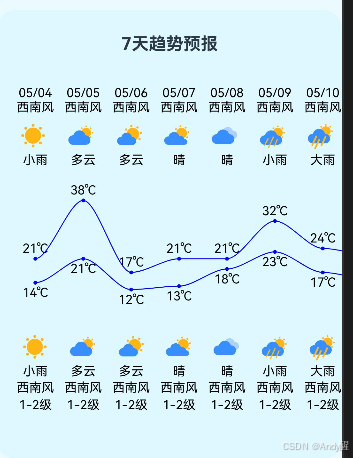
参考下文: 鸿蒙征文 | 使用Canvas组件绘制天气曲线图_harmonyos_鸑鷟407-HarmonyOS开发者社区效果图: 原理 使用贝塞尔曲线 首先可以了解一下贝塞尔曲线。 如果看不懂也没关系,这里会直接讲绘制曲线的步骤。 使用CanvasRenderingContext2D对象。 首先使用beginPath方法确定起始点。 这里会循环地用到bezierCurveTo(三次贝塞尔曲线)方法。该方法需要三个点的坐标,即图上的点1、2、3。 这里的点3就表示温度的点。为了让曲线更平滑,我们让点1的高度与起始 鸑鷟407 HarmonyOS开发者社区![]() https://harmonyosdev.csdn.net/660cdf2c9ab37021bfa7a47c.html
https://harmonyosdev.csdn.net/660cdf2c9ab37021bfa7a47c.html
效果图:(左右可以滑动)
@Entry
@Component
struct csPage {
  tempMax : number[] = [21, 38, 17, 21, 21, 32, 24, 22, 25, 33, 24, 26, 25, 34, 28];
  tempMin : number[] = [14, 21, 12, 13, 18, 23, 17, 15, 13, 18, 18, 10, 15, 24, 20];
  weatherDates: string[] = ['05/04', '05/05', '05/06', '05/07', '05/08', '05/09', '05/10', '05/11', '05/12', '05/13', '05/14', '05/15', '05/16', '05/17', '05/18'];
  weatherConditions: string[] = ['小雨', '多云', '多云', '晴', '晴', '小雨', '大雨', '晴', '多云', '多云', '小雨', '晴', '晴', '多云', '小雨'];
  icon: string[] =              ['100', '101', '102', '103', '104', '300', '301', '302', '303', '304', '305', '306', '307', '308', '309'];
  windDirDay: string[] =              ['西南风', '西南风', '西南风', '西南风', '西南风', '西南风', '西南风', '西南风', '西南风', '西南风', '西南风', '西南风', '西南风', '西南风', '西南风'];
  windScaleDay: string[] =              ['1-2', '1-2', '1-2', '1-2', '1-2', '1-2', '1-2', '1-2', '1-2', '1-2', '1-2', '1-2', '1-2', '1-2', '1-2'];

  // 定义左右边距
  sideMargin: number = 40; // 根据需要调整
  //使用RenderingContext在Canvas组件上进行绘制,绘制对象可以是矩形、文本、图片等。
  settings: RenderingContextSettings = new RenderingContextSettings(true);
  context: CanvasRenderingContext2D = new CanvasRenderingContext2D(this.settings);
  // canvasHeight:表示曲线图高度,itemWidth:表示每两天的温度点之间的距离。
  canvasHeight: number = 250;
  itemWidth: number = 50;


  build() {
    Row() {
      Column({ space: 15 }) {
        Text('7天趋势预报')
          .fontSize(18)
          .padding(10)
          .margin({top:15})
          .fontWeight(FontWeight.Bold)
        Scroll() {
          Canvas(this.context)
            .width(this.tempMax.length * this.itemWidth + this.itemWidth + this.sideMargin * 2)
            .height('100%')
            .onReady(() => {
              //找出高温曲线的最大值,和低温曲线的最小值,用于后续确定曲线竖直方向的比例
              const maxTemperature: number = Math.max(...this.tempMax);
              const minTemperature: number = Math.min(...this.tempMin);
              //最高-最低温度的上下距离 step 表示每改变 1℃,纵坐标改变的高度
              const step: number = this.canvasHeight * 0.4 / (maxTemperature - minTemperature);
              const curveChartMargin: number = this.canvasHeight * 0.09;

              //设置曲线样式
              this.context.lineWidth = 1;
              this.context.font = '13vp sans-serif';
              this.context.fillStyle = '#000000';
              this.context.strokeStyle = 'blue'
              this.context.globalAlpha = 1;
              this.context.textAlign='start'

              //由于同一天的高温点、低温点的x坐标相同,所以x坐标使用同一组数据。
              let xPos: number[] = [];
              let tempMaxPos: number[] = [];
              let tempMin: number[] = [];
              //确定温度点的坐标,再绘制,并绘制温度文字
              for (let i: number = 0; i < this.tempMax.length; i++) {
                // 确定每个点的坐标,包括高温和低温,其中,高温和低温坐标的横坐标都是一致的
                let x: number = this.sideMargin + (i * this.itemWidth);
                let yHeight: number = this.canvasHeight - (curveChartMargin + (this.tempMax [i] - minTemperature) * step);
                let yLow: number = this.canvasHeight - (curveChartMargin + (this.tempMin[i] - minTemperature) * step);

                // 存放数据
                xPos.push(x);
                tempMaxPos.push(yHeight);
                tempMin.push(yLow);

                // 给每个点画出一个圆并填充颜色,这里设置圆的半径为2
                this.context.fillStyle = "blue"; // 设置低温点颜色为蓝色
                let region: Path2D = new Path2D();
                region.ellipse(x, yHeight, 2, 2, 0, 0, Math.PI * 2);
                region.ellipse(x, yLow, 2, 2, 0, 0, Math.PI * 2);
                this.context.fill(region);


                // 绘制日期
                this.context.fillStyle = "black"; // 可以设置文字颜色
                let dateStr: string = this.weatherDates[i];
                this.context.fillText(dateStr, x - this.context.measureText(dateStr).width / 2,  20);
                let highWindDirDayStr:string=this.windDirDay[i]
                this.context.fillText(highWindDirDayStr,x-this.context.measureText(highWindDirDayStr).width/2,35)
                // 绘制天气图标
                let icon: string = Q_Weather_Image(this.icon[i]);
                let   imgIcon = new ImageBitmap(icon)
                this.context.drawImage(imgIcon,x - this.context.measureText(dateStr).width / 2,45, 30, 30);
                // 绘制天气状态
                let  highConditionStr: string = this.weatherConditions[i];
                this.context.fillText(highConditionStr, x - this.context.measureText(highConditionStr).width / 2, 90);


                // 绘制高温低温的文字
                this.context.fillStyle = "black"; // 可以设置文字颜色
                let maxTemperatureStr: string = `${this.tempMax[i]}℃`;
                let minTemperatureStr: string = `${this.tempMin[i]}℃`;
                this.context.fillText(maxTemperatureStr, x - this.context.measureText(maxTemperatureStr).width / 2, yHeight - 6);
                this.context.fillText(minTemperatureStr, x - this.context.measureText(minTemperatureStr).width / 2, yLow + 15);


                // 绘制天气状态
                let conditionStr: string = this.weatherConditions[i];
                this.context.fillText(conditionStr, x - this.context.measureText(conditionStr).width / 2, this.canvasHeight + 60);
                //绘制风向
                let  windDirDayStr:string=this.windDirDay[i]
                this.context.fillText(windDirDayStr,x-this.context.measureText(windDirDayStr).width/2,this.canvasHeight+77)
                //绘制风向等级
                let windScaleDayStr:string= `${this.windScaleDay[i]}级`
                this.context.fillText(windScaleDayStr,x-this.context.measureText(windScaleDayStr).width/2,this.canvasHeight+95)
                // 绘制天气图标
                // 下载并绘制天气图标
                let iconUrl: string = Q_Weather_Image(this.icon[i]);
                let   img = new ImageBitmap(iconUrl)
                this.context.drawImage(img,x - this.context.measureText(windScaleDayStr).width / 2.2, this.canvasHeight+ 15, 30, 30);


              }

              // 绘制高温曲线
              this.context.beginPath();
              this.context.moveTo(xPos[0], tempMaxPos[0]);
              for (let i: number = 1; i < xPos.length; i++) {
                //let x0: number = i * this.itemWidth;
                // let x0: number = sideMargin + i * this.itemWidth;
                // let y0: number = this.canvasHeight - (curveChartMargin + (this.tempMax[i - 1] - minTemperature) * step);
                let x0: number = xPos[i - 1];
                let y0: number = tempMaxPos[i - 1];
                this.context.bezierCurveTo(x0 + (xPos[i] - x0) * 0.3, y0, xPos[i] - (xPos[i] - x0) * 0.3, tempMaxPos[i], xPos[i], tempMaxPos[i]);
              }
              this.context.stroke();

              // 绘制低温曲线
              this.context.beginPath();
              this.context.moveTo(xPos[0], tempMin[0]);
              for (let i: number = 1; i < xPos.length; i++) {
               // let x0: number = i * this.itemWidth;
               //  let x0: number = sideMargin + i * this.itemWidth;
               //  let y0: number = this.canvasHeight - (curveChartMargin + (this.tempMin[i - 1] - minTemperature) * step);
                let x0: number = xPos[i - 1];
                let y0: number = tempMin[i - 1];
                this.context.bezierCurveTo(x0 + (xPos[i] - x0) * 0.3, y0, xPos[i] - (xPos[i] - x0) * 0.3, tempMin[i], xPos[i], tempMin[i]);
              }
              this.context.stroke();
            });
        }
        .scrollable(ScrollDirection.Horizontal)
        .scrollBar(BarState.Off);
      }
      .width('100%')
      .height('60%')
      .backgroundColor($r('app.color.home_bg'))
      .borderRadius(20)
    }
    .width('100%')
    .height('100%')
    .justifyContent(FlexAlign.Center)
    .backgroundColor($r('app.color.daily_bg'))

  }
}

function Q_Weather_Image(img: string): string {
  let url = `https://a.hecdn.net/img/common/icon/202106d/${img}.png`;
  return url;
}