盐分反演关键:批量计算常用的盐分指数反演变量
一、引言
盐分指数反演是遥感应用中的一个重要方面,尤其在农业和环境监测中有着广泛的应用。通过遥感影像,研究人员可以高效地获取和分析地表盐分信息,为土地管理和作物生产提供重要支持。本文将介绍如何利用哨兵2号影像批量计算常用的盐分指数反演变量。
二、哨兵2号影像简介
哨兵2号(Sentinel-2)卫星是欧空局(ESA)哨兵计划中的一部分,主要用于地表监测。其多光谱仪(MSI)包含13个波段,覆盖可见光、近红外和短波红外波段,分辨率从10米到60米不等。这些波段为计算各种植被和盐分指数提供了丰富的数据源。
| Sentinel-2 Bands | Central Wavelength (µm) | Resolution (m) |
|---|---|---|
| Band 1 - Coastal aerosol | 0.443 | 60 |
| Band 2 - Blue | 0.490 | 10 |
| Band 3 - Green | 0.560 | 10 |
| Band 4 - Red | 0.665 | 10 |
| Band 5 - Vegetation Red Edge | 0.705 | 20 |
| Band 6 - Vegetation Red Edge | 0.740 | 20 |
| Band 7 - Vegetation Red Edge | 0.783 | 20 |
| Band 8 - NIR | 0.842 | 10 |
| Band 8A - Vegetation Red Edge | 0.865 | 20 |
| Band 9 - Water vapour | 0.945 | 60 |
| Band 10 - SWIR - Cirrus | 1.375 | 60 |
| Band 11 - SWIR | 1.610 | 20 |
| Band 12 - SWIR | 2.190 | 20 |
三、常用盐分指数
盐分指数(Salinity Index,SI)是一种通过遥感数据定量描述地表盐分状况的指标。以下是几种常用的盐分指数公式和盐分反演需要用到的植被指数公式:
盐分指数
| 特征参数 | 变量名称 | 公式及描述 |
|---|---|---|
| 盐分指数 (SI_T) | salinity index, SI_T | ( R e d − N I R ) × 100 (Red - NIR) \times 100 (Red−NIR)×100 |
| 盐分指数 (SI1) | salinity index, SI1 | G r e e n × R e d \sqrt{Green \times Red} Green×Red |
| 盐分指数 (SI2) | salinity index, SI2 | G r e e n 2 + R e d 2 + N I R 2 \sqrt{Green^2 + Red^2 + NIR^2} Green2+Red2+NIR2 |
| 盐分指数 (SI3) | salinity index, SI3 | G r e e n 2 + R e d 2 \sqrt{Green^2 + Red^2} Green2+Red2 |
| 盐分指数 (SI4) | salinity index, SI4 | B l u e × R e d G r e e n \frac{Blue \times Red}{Green} GreenBlue×Red |
| 盐分指数 (SI5) | salinity index, SI5 | G r e e n + R e d 2 \frac{Green + Red}{2} 2Green+Red |
| 盐分指数 (S1) | salinity index, S1 | B l u e R e d \frac{Blue}{Red} RedBlue |
| 盐分指数 (S2) | salinity index, S2 | B l u e − R e d B l u e + R e d \frac{Blue - Red}{Blue + Red} Blue+RedBlue−Red |
| 盐分指数 (S3) | salinity index, S3 | G r e e n × R e d B l u e \frac{Green \times Red}{Blue} BlueGreen×Red |
| 盐分指数 (SAIO) | salinity index, SAIO | R e d − N I R G r e e n + N I R \frac{Red - NIR}{Green + NIR} Green+NIRRed−NIR |
| 复合盐分指数 (CRSI) | composite salinity index, CRSI | ( N I R − R e d ) × ( 1 + L ) N I R + R e d + L ; L = 0.5 \frac{(NIR - Red) \times (1 + L)}{NIR + Red + L}; L = 0.5 NIR+Red+L(NIR−Red)×(1+L);L=0.5 |
植被指数
| 特征参数 | 变量名称 | 公式及描述 |
|---|---|---|
| 土壤调整植被指数 (SAVI) | soil-adjusted vegetation index, SAVI | ( N I R − R ) × 1.5 N I R + R + 0.5 \frac{(NIR - R) \times 1.5}{NIR + R + 0.5} NIR+R+0.5(NIR−R)×1.5 |
| 归一化植被指数 (NDVI) | normalized vegetation index, NDVI | N I R − R N I R + R \frac{NIR - R}{NIR + R} NIR+RNIR−R |
| 重整化差异植被指数 (RDVI) | renormalize differential vegetation index, RDVI | N I R − R N I R + R \frac{\sqrt{NIR - R}}{NIR + R} NIR+RNIR−R |
| 绿色归一化差异植被指数 (GNDVI) | green normalized differential vegetation index, GNDVI | N I R − G N I R + G \frac{NIR - G}{NIR + G} NIR+GNIR−G |
| 三角植被指数 (TVI) | triangular vegetation index, TVI | N I R − R N I R + R + 0.5 \frac{NIR - R}{NIR + R + 0.5} NIR+R+0.5NIR−R |
| 差值植被指数 (DVI) | differential vegetation index, DVI | N I R − R NIR - R NIR−R |
| 归一化差异绿色指数 (NDGI) | normalized difference green index, NDGI | G − R G + R \frac{G - R}{G + R} G+RG−R |
| 增强归一化植被指数 (ENDVI) | enhanced normalized vegetation index, ENDVI | N I R + S W I R 2 − R N I R + S W I R 2 + R \frac{NIR + SWIR_2 - R}{NIR + SWIR_2 + R} NIR+SWIR2+RNIR+SWIR2−R |
四、GDAL简介
GDAL(Geospatial Data Abstraction Library)是一个用于处理栅格数据和矢量数据的开源库,是地理信息系统(GIS)和遥感领域的重要工具之一。GDAL的详细介绍及其安装可以查看这篇文章:GDAL介绍及安装。
五、 批量计算植被指数
1.指数命令
使用 gdal_calc.py 工具可以批量计算上述表格中各盐分指数和植被指数。以下是计算这些植被指数的命令示例:
python gdal_calc.py -A S2.tif --A_band=8 -B S2.tif --B_band=4 --outfile=savi.tif --calc="((A-B) * 1.5) / (A+B+0.5)"
python gdal_calc.py -A S2.tif --A_band=8 -B S2.tif --B_band=4 --outfile=ndvi.tif --calc="(A-B) / (A+B)"
python gdal_calc.py -A S2.tif --A_band=8 -B S2.tif --B_band=4 --outfile=rdvi.tif --calc="sqrt(A-B) / (A+B)"
python gdal_calc.py -A S2.tif --A_band=8 -B S2.tif --B_band=3 --outfile=gndvi.tif --calc="(A-B) / (A+B)"
python gdal_calc.py -A S2.tif --A_band=8 -B S2.tif --B_band=4 --outfile=tvi.tif --calc="(A-B) / (A+B+0.5)"
python gdal_calc.py -A S2.tif --A_band=8 -B S2.tif --B_band=4 --outfile=dvi.tif --calc="A-B"
python gdal_calc.py -A S2.tif --A_band=3 -B S2.tif --B_band=4 --outfile=ndgi.tif --calc="(A-B) / (A+B)"
python gdal_calc.py -A S2.tif --A_band=8 -B S2.tif --B_band=4 -C S2.tif --C_band=12 --outfile=endvi.tif --calc="(A+C-B)/(A+C+B)"
python gdal_calc.py -A S2.tif --A_band=4 -B S2.tif --B_band=8 --outfile=si_t.tif --calc="(A-B) * 100"
python gdal_calc.py -A S2.tif --A_band=3 -B S2.tif --B_band=4 --outfile=si1.tif --calc="sqrt(A*B)"
python gdal_calc.py -A S2.tif --A_band=3 -B S2.tif --B_band=4 -C S2.tif --C_band=8 --outfile=si2.tif --calc="sqrt(A**2 + B**2 + C**2)"
python gdal_calc.py -A S2.tif --A_band=3 -B S2.tif --B_band=4 --outfile=si3.tif --calc="sqrt(A**2 + B**2)"
python gdal_calc.py -A S2.tif --A_band=2 -B S2.tif --B_band=4 -C S2.tif --C_band=3 --outfile=si4.tif --calc="(A*B)/C"
python gdal_calc.py -A S2.tif --A_band=3 -B S2.tif --B_band=4 --outfile=si5.tif --calc="(A+B)/2"
python gdal_calc.py -A S2.tif --A_band=2 -B S2.tif --B_band=4 --outfile=s1.tif --calc="A/B"
python gdal_calc.py -A S2.tif --A_band=2 -B S2.tif --B_band=4 --outfile=s2.tif --calc="(A-B)/(A+B)"
python gdal_calc.py -A S2.tif --A_band=3 -B S2.tif --B_band=4 -C S2.tif --C_band=2 --outfile=s3.tif --calc="(A*B)/C"
python gdal_calc.py -A S2.tif --A_band=4 -B S2.tif --B_band=8 -C S2.tif --C_band=3 --outfile=saio.tif --calc="(A-B)/(C+B)"
python gdal_calc.py -A S2.tif --A_band=8 -B S2.tif --B_band=4 --outfile=crsi.tif --calc="(A-B)*(1+0.5)/(A+B+0.5)"
这些命令使用 gdal_calc.py 工具来计算表格中的各个植被指数,其中 A_band、B_band 和 C_band 分别对应 哨兵2号 的不同波段。请根据实际数据文件调整命令中的文件名和波段编号。
2.批处理脚本自动计算
手动运行每条命令会非常麻烦,因此可以将这些命令写入一个批处理文件(.bat),实现自动计算。
3.创建批处理文件
-
打开记事本,将上述命令内容复制进去。
-
保存文件,将文件名命名为
run.bat。 -
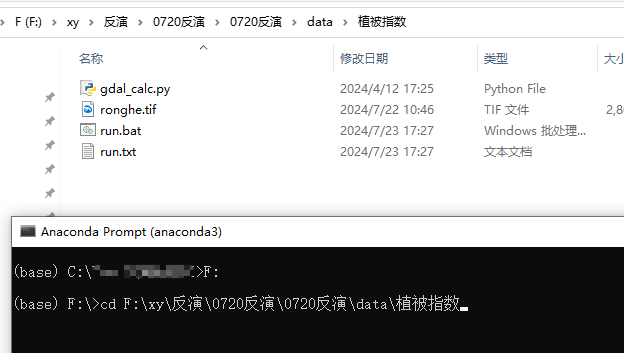
将gdal_calc.py文件和遥感影像文件放入同一文件夹下。
gdal.py/ run.bat/ run.txt文件已经上传到百度网盘,需要可搜索关注作者微信公众号:Python与遥感 获取

4.运行批处理文件
- 打开Anaconda Prompt。
- 输入以下命令进入相应的驱动器和目录:
F: cd path\to\your\folder - 输入并运行批处理文件:
run.bat
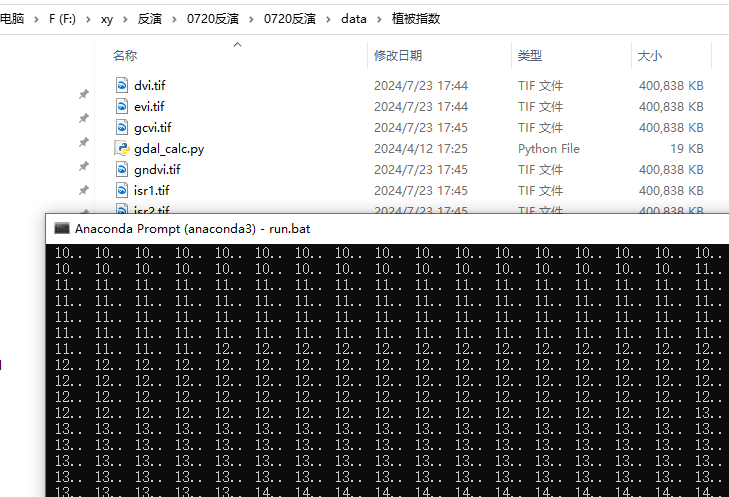
运行后,批处理文件将自动依次执行每个命令,计算所有植被指数和盐分指数,并将结果保存到相应的文件中。
注:这里的图示范,采用的是上一篇文章代替的,能看懂就行。

5. 结果展示
每条命令运行后,对应的植被指数会保存在文件夹中,黑窗里的数字到99就代表计算完了一个植被指数。只需等待一小会儿,即可计算完所有的植被指数计算。

六、 总结
盐分指数反演在农业和环境监测中具有重要意义。利用哨兵2号影像和GDAL工具,研究人员可以批量计算常用的盐分指数,获取详细的地表盐分信息。这不仅提高了工作效率,还为科学研究和实际应用提供了强有力的支持。
欢迎关注我的公众号:python与遥感,或许里面有你想要的免费教程。


