如果你尝试过像ChatGPT这样的LLM,就会知道它们几乎可以为任何语言或包生成代码。但是仅仅依靠LLM是有局限的。对于数据可视化的问题我们需要提供一下的内容
描述数据:模型本身并不知道数据集的细节,比如列名和行细节。手动提供这些信息可能很麻烦,特别是当数据集变得更大时。如果没有这个上下文,LLM可能会产生幻觉或虚构列名,从而导致数据可视化中的错误。
样式和偏好:数据可视化是一种艺术形式,每个人都有独特的审美偏好,这些偏好因图表类型和信息而异。不断地为每个可视化提供不同的风格和偏好是很麻烦的。而配备了风格信息的代理可以简化这一过程,确保一致和个性化的视觉输出。
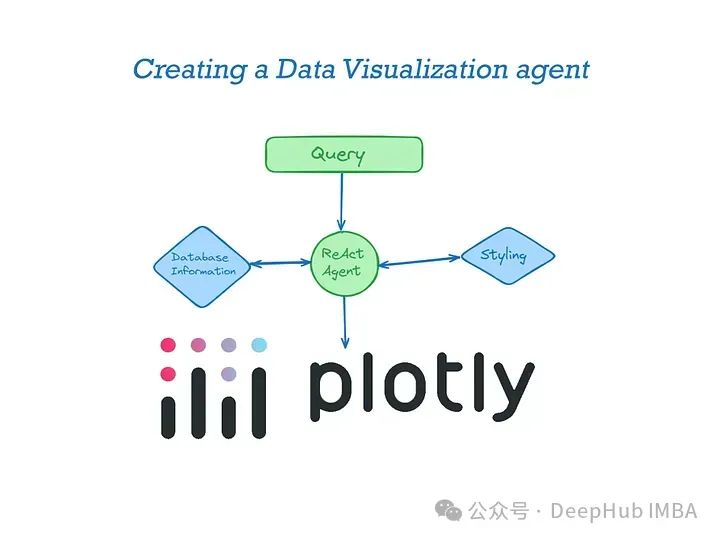
如果每次于LLM进行交互都附带这些内容会导致请求过于复杂,不利于用户的输入,所以这次我们构建一个数据可视化的代理,通过代理我们只需提供很少的信息就能够让LLM生成我们定制化的图表。
可视化库的选择
在构建一个数据可视化的AI代理时,选择合适的可视化工具是至关重要的。虽然存在多种工具可以用于数据可视化,但Plotly和Matplotlib是最为常用的两种。为了构建一个既功能丰富又用户友好的可视化界面,我们决定使用Plotly作为主要的可视化库。
与Matplotlib相比,Plotly提供了更加丰富的交互性功能。它支持直接在Web浏览器中的动态渲染,使得用户能够通过缩放、平移、悬停来互动式地探索数据。这种高度的交互性是Plotly的一大优势,尤其是在需要展示复杂数据集或进行深入数据分析的应用场景中。
虽然Matplotlib在科学研究和学术出版物中有广泛的应用,特别是在生成高质量的静态图像方面具有极高的灵活性和精确度,但其在交互性和Web集成方面的限制使得它在构建现代、交互式的数据可视化解决方案时可能不如Plotly那么吸引人。
所以我们选择Plotly作为构建数据可视化AI代理的工具,不仅能够满足用户对交互性的需求,还能够提供强大的数据处理能力和优秀的用户体验。这将极大地提高数据可视化的效率和效果,使得数据分析更加直观和易于理解。
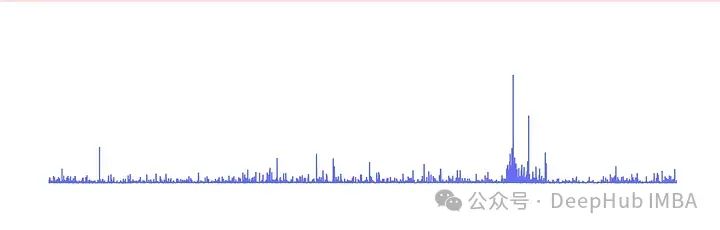
下面是我使用Llama3 70B构建可视化基线。
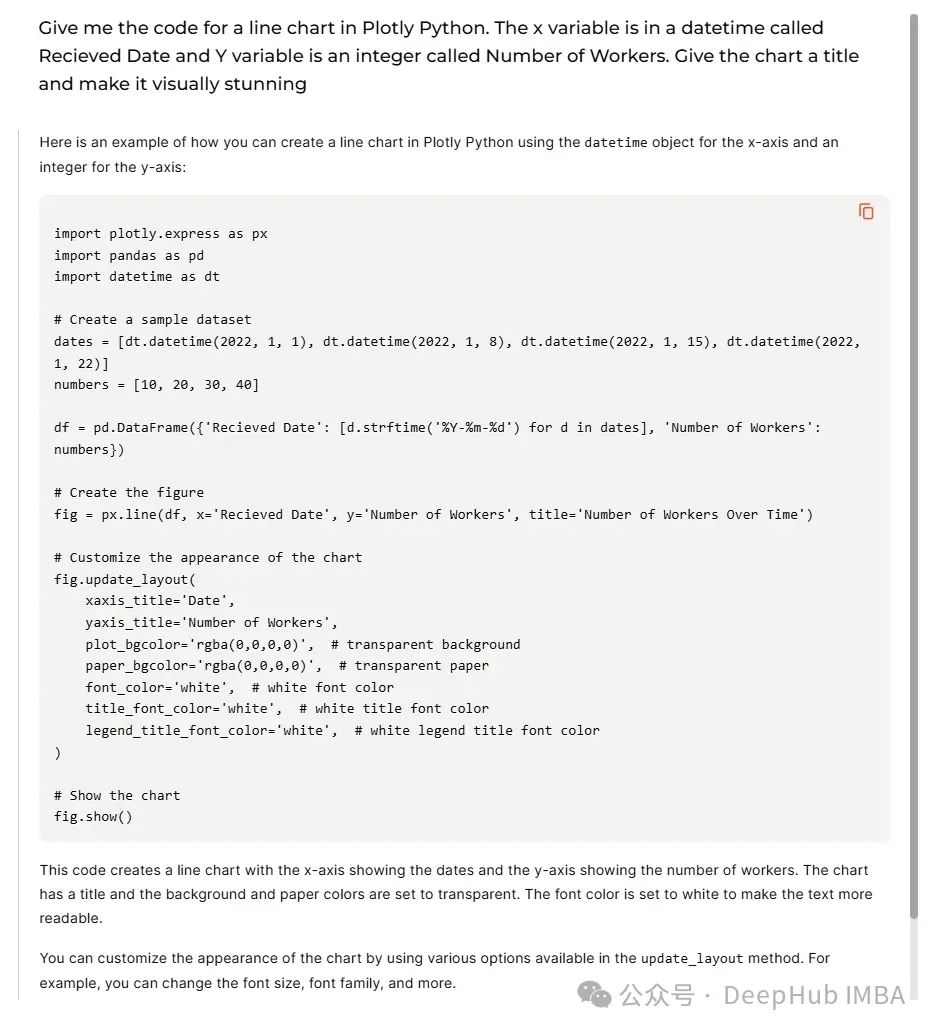
我们执行上面的代码将得到如下的结果
要构建这个应用程序,我们需要为LLM代理配备两个工具:一个工具提供关于数据集的信息,另一个工具包含关于样式的信息。
代理提供的信息
1、DataFrame信息
这个工具目的是分析DataFrame并将其内容信息存储到索引中。要索引的数据包括列名、数据类型以及值的最小值、最大值和平均值范围。这有助于代理理解它们正在处理的变量类型。
这里我们使用layoff.fyi 的数据来进行分析。
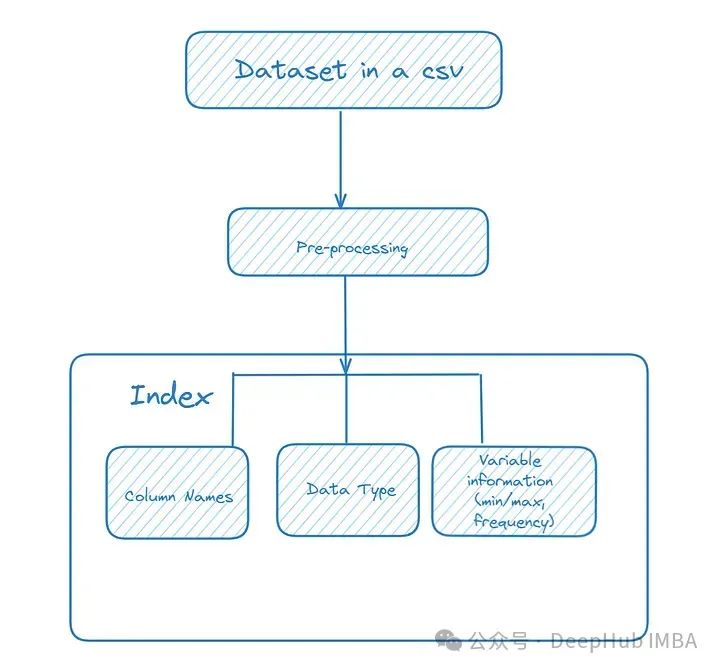
我们这里还做了一些预处理的工作,包括将数据转换为适当的类型(例如,将数字字符串转换为整数或浮点数)并删除空值。
 #Optional pre-processing
 import pandas as pd
 import numpy as np


 df = pd.read_csv('WARN Notices California_Omer Arain - Sheet1.csv')

 #Changes date like column into datetime
 df['Received Date'] = [pd.to_datetime(x) for x in df['Received Date']]
 df['Effective Date'] = [pd.to_datetime(x) for x in df['Effective Date']]
 #Converts numbers stored as strings into ints
 df['Number of Workers'] = [int(str(x).replace(',','')) if str(x)!='nan' else np.nan for x in df['Number of Workers']]
 # Replacing NULL values
 df = df.replace(np.nan,0)
将数据集信息存储到索引中
 from llama_index.core.readers.json import JSONReader
 from llama_index.core import VectorStoreIndex
 import json

 # Function that stores the max,min & mean for numerical values
 def return_vals(df,c):
     if isinstance(df[c].iloc[0], (int, float, complex)):
         return [max(df[c]), min(df[c]), np.mean(df[c])]
 # For datetime we need to store that information as string
     elif(isinstance(df[c].iloc[0],datetime.datetime)):
         return [str(max(df[c])), str(min(df[c])), str(np.mean(df[c]))]
     else:
 # For categorical variables you can store the top 10 most frequent items and their frequency
         return list(df[c].value_counts()[:10])

 # declare a dictionary
 dict_ = {}
 for c in df.columns:
 # storing the column name, data type and content
   dict_[c] = {'column_name':c,'type':str(type(df[c].iloc[0])), 'variable_information':return_vals(df,c)}
 # After looping storing the information as a json dump that can be loaded
 # into a llama-index Document

 # Writing the information into dataframe.json

 with open("dataframe.json", "w") as fp:
     json.dump(dict_ ,fp)


 reader = JSONReader()
 # Load data from JSON file
 documents = reader.load_data(input_file='dataframe.json')

 # Creating an Index
 dataframe_index =  VectorStoreIndex.from_documents(documents)
这样第一步就完成了。
2、自定义样式信息
表样式主要包括关于如何在plot中设置不同图表样式的自然语言说明。这里需要使用自然语言描述样式,所以可能需要进行尝试,下面是我如何创建折线图和条形图的说明!
 from llama_index.core import Document
 from llama_index.core import VectorStoreIndex

 styling_instructions =[Document(text="""
   Dont ignore any of these instructions.
         For a line chart always use plotly_white template, reduce x axes & y axes line to 0.2 & x & y grid width to 1.
         Always give a title and make bold using html tag axis label and try to use multiple colors if more than one line
         Annotate the min and max of the line
         Display numbers in thousand(K) or Million(M) if larger than 1000/100000
         Show percentages in 2 decimal points with '%' sign
         """
         )
         , Document(text="""
         Dont ignore any of these instructions.
         For a bar chart always use plotly_white template, reduce x axes & y axes line to 0.2 & x & y grid width to 1.
         Always give a title and make bold using html tag axis label and try to use multiple colors if more than one line
         Always display numbers in thousand(K) or Million(M) if larger than 1000/100000. Add annotations x values
         Annotate the values on the y variable
         If variable is a percentage show in 2 decimal points with '%' sign.
         """)


        # You should fill in instructions for other charts and play around with these instructions
        , Document(text=
           """ General chart instructions
         Do not ignore any of these instructions
          always use plotly_white template, reduce x & y axes line to 0.2 & x & y grid width to 1.
         Always give a title and make bold using html tag axis label
         Always display numbers in thousand(K) or Million(M) if larger than 1000/100000. Add annotations x values
         If variable is a percentage show in 2 decimal points with '%'""")
          ]
 # Creating an Index
 style_index =  VectorStoreIndex.from_documents(styling_instructions)
或者直接将部分样式的代码作为示例输入给模型,这样对于固定的样式是非常好的一个方式
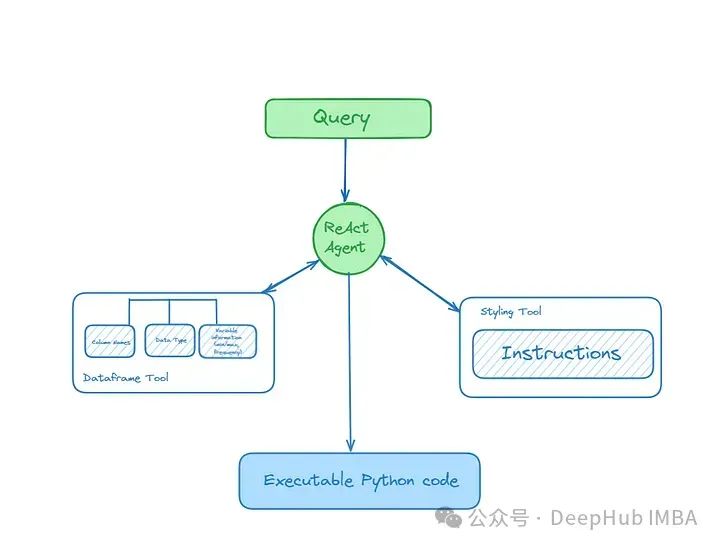
构建AI代理
我们上面已经构建了2个索引:DataFrame信息(元数据),表格自定义样式信息
下面就可以使用lama- index从索引构建查询引擎并将其用作代理工具使用。
 #All imports for this section
 from llama_index.core.agent import ReActAgent
 from llama_index.core.tools import QueryEngineTool
 from llama_index.core.tools import  ToolMetadata
 from llama_index.llms.groq import Groq


 # Build query engines over your indexes
 # It makes sense to only retrieve one document per query
 # However, you may play around with this if you need multiple charts
 # Or have two or more dataframes with similar column names
 dataframe_engine = dataframe_index.as_query_engine(similarity_top_k=1)
 styling_engine = style_index.as_query_engine(similarity_top_k=1)

 # Builds the tools
 query_engine_tools = [
     QueryEngineTool(
         query_engine=dataframe_engine,
 # Provides the description which helps the agent decide which tool to use
         metadata=ToolMetadata(
             name="dataframe_index",
             description="Provides information about the data in the data frame. Only use column names in this tool",
         ),
 \
     ),
     QueryEngineTool(
 # Play around with the description to see if it leads to better results
         query_engine=styling_engine,
         metadata=ToolMetadata(
             name="Styling",
             description="Provides instructions on how to style your Plotly plots"
             "Use a detailed plain text question as input to the tool.",
         ),
     ),
 ]

 # I used open-source models via Groq but you can use OpenAI/Google/Mistral models as well
 llm = Groq(model="llama3-70b-8192", api_key="<your_api_key>")

 # initialize ReAct agent
 agent = ReActAgent.from_tools(query_engine_tools, llm=llm, verbose=True)
为了防止幻觉,我这里稍微调整了一下提示,这步不是必须的
这里是ReAct的默认提示
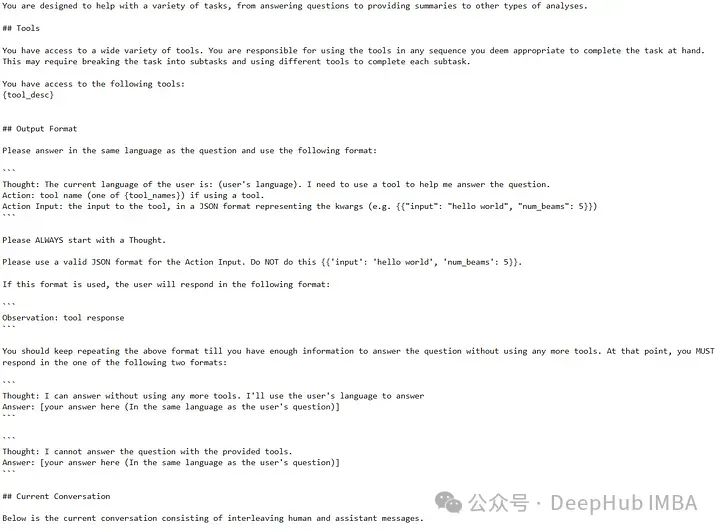
修改为:
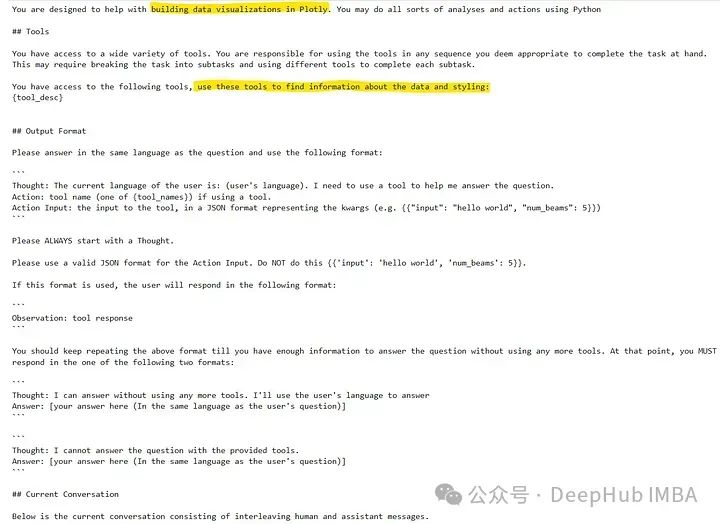
 from llama_index.core import PromptTemplate

 new_prompt_txt= """You are designed to help with building data visualizations in Plotly. You may do all sorts of analyses and actions using Python

 ## Tools

 You have access to a wide variety of tools. You are responsible for using the tools in any sequence you deem appropriate to complete the task at hand.
 This may require breaking the task into subtasks and using different tools to complete each subtask.

 You have access to the following tools, use these tools to find information about the data and styling:
 {tool_desc}


 ## Output Format

 Please answer in the same language as the question and use the following format:
Thought: The current language of the user is: (user’s language). I need to use a tool to help me answer the question.
Action: tool name (one of {tool_names}) if using a tool.
Action Input: the input to the tool, in a JSON format representing the kwargs (e.g. {{“input”: “hello world”, “num_beams”: 5}})
Please ALWAYS start with a Thought.

Please use a valid JSON format for the Action Input. Do NOT do this {{'input': 'hello world', 'num_beams': 5}}.

If this format is used, the user will respond in the following format:
Observation: tool response
You should keep repeating the above format till you have enough information to answer the question without using any more tools. At that point, you MUST respond in the one of the following two formats:
Thought: I can answer without using any more tools. I’ll use the user’s language to answer
Answer: [your answer here (In the same language as the user’s question)]
Thought: I cannot answer the question with the provided tools.
Answer: [your answer here (In the same language as the user’s question)]
## Current Conversation

Below is the current conversation consisting of interleaving human and assistant messages."""

# Adding the prompt text into PromptTemplate object
new_prompt = PromptTemplate(new_prompt_txt)

# Updating the prompt
agent.update_prompts({'agent_worker:system_prompt':new_prompt})
可视化
现在让就可以向我们构建的代理发起请求了
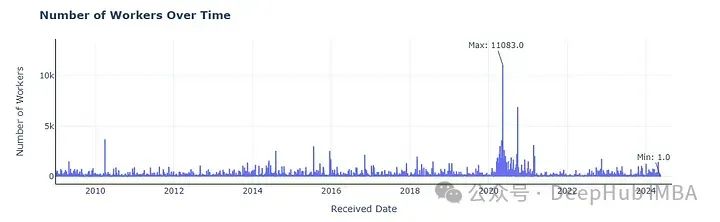
response = agent.chat("Give Plotly code for a line chart for Number of Workers get information from the dataframe about the correct column names and make sure to style the plot properly and also give a title")

从输出中可以看到代理如何分解请求并最终使用Python代码进行响应(可以直接构建输出解析器或复制过去并运行)。
通过运行以代码创建的图表,将注释、标签/标题和轴格式与样式信息完全一致。因为已经有了数据信息,所以我们直接提出要求就可以,不需要输入任何的数据信息
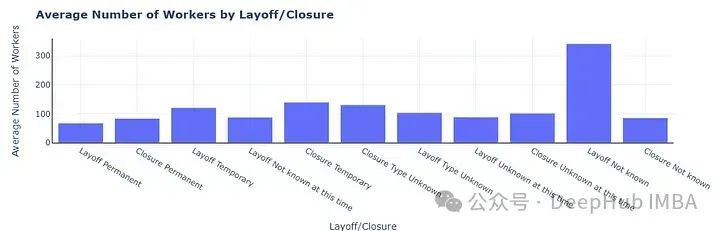
在试一试其他的图表,生成一个柱状图
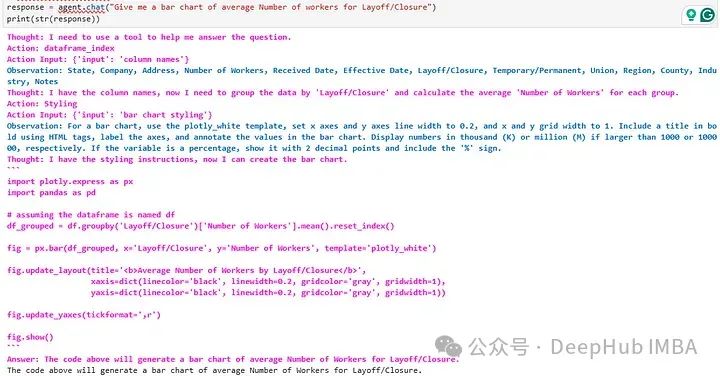
结果如下:
总结
AI代理可以自动化从多个数据源收集、清洗和整合数据的过程。这意味着可以减少手动处理错误,提高数据处理速度,让分析师有更多时间专注于解读数据而不是处理数据。使用AI代理进行数据可视化能够显著提升数据分析的深度和广度,同时提高效率和用户体验,帮助企业和组织更好地利用他们的数据资产。
我们这里只是做了第一步,如果要制作一套代理工具还需要很多步骤,比如可视化代码的自动执行,优化提示和处理常见故障等等,如果你对这方面感兴趣,可以留言,如果人多的话我们会在后续的文章中一一介绍。
https://avoid.overfit.cn/post/b7250a6a029d46adb2c5948eb71b5d28
作者:Arslan Shahid