1. MTZ模型
MTZ是Miller-Tucker-Zemlin inequalities的缩写。除了定义是否用到边
x
i
j
x_{ij}
xij外,还需要定义一个
u
i
u_i
ui用来表示此时车辆的当前载货量。注意这里x变量需要定义为有向。
这里定义为pickup问题,代码为:
using JuMP, HiGHS

k = 3 # number of vehicles
N = 11 # number of points, 0 as depot
Q = 4 # vehicle capacity
q = ones(Int,N);q[1]=0 # demand
CVRP = Model(HiGHS.Optimizer)
set_silent(CVRP)
@variable(CVRP,x[1:N,1:N],Bin)
@variable(CVRP,u[1:N],lower_bound = 0, upper_bound = Q)
# 约束1:出度约束
for i in 2:N
    @constraint(CVRP, sum(x[i,1:i-1]) + sum(x[i,i+1:N]) == 1)
    @constraint(CVRP, sum(x[1:i-1,i]) + sum(x[i+1:N,i]) == 1)
end
@constraint(CVRP, sum(x[1,1:N]) == k)
# 约束2:流量约束。若存在i->j,则u_j-u_i==q_j;否则u_j-q_j和u_i没有关系。此外,需要有u_j-q_j>=0
for i=2:N, j=[2:i-1;i+1:N]
    @constraint(CVRP,u[i] - u[j] + Q*x[i,j] <= Q-q[j])
end
for i in 2:N
    @constraint(CVRP,q[i] <= u[i] <= Q)
end

@objective(CVRP,Min, sum(x[i,j]*distmat[i,j] for i=1:N,j=1:N))
@time optimize!(CVRP)
MTZ的求解速度不快,10个点3辆车都需要3秒左右时间。
2. 分支定界法
使用Two-index vehicle flow formulations。按照tsp的方式使用行生成法速度极慢(cut的效率太低),因此考虑使用branch-and-cut直接求解。需要cut的主要有2个:1)容量约束;2)subtour约束。如下例子:
using TSPLIB,JuMP, HiGHS, Distances
N = 13
Q = 4
k = 3
m = Model(HiGHS.Optimizer)
set_silent(m)
@variable(m, x[1:N,1:N]>=0,Bin)
@objective(m, Min, sum(x[i,j]*distmat[i,j] for i=1:N,j=1:N))
@constraint(m, x[1,1] == 0)
@constraint(m, sum(x[1,j] for j in 2:N) == k)
@constraint(m, sum(x[j,1] for j in 2:N) == k)
for i=2:N
    for j in 1:N;@constraint(m, x[i,j]+x[j,i] <= 1);end
    @constraint(m, sum(x[i,j] for j in 1:N) == 1)
    @constraint(m, sum(x[j,i] for j in 1:N) == 1)
end
optimize!(m)
draw_vrp(x)

接下来定义寻找tour的函数,以及branch and cut的代码:
# find all subtours
function tours(x)
    g = JuMP.value.(x)
    # 第一步,找到所有从1出发的tour
    abnormal_paths = []
    paths = []
    path = [1]
    left = collect(1:N)
    while true
        v, idx = findmax(g[path[end],left])
        if v==0
            break
        else
            g[left[idx],path[end]]=0
            g[path[end],left[idx]]=0
            push!(path,left[idx])
        end
        if path[end]==1
            if length(path)>Q+2;push!(abnormal_paths,path);end
            push!(paths,path)
            path = [1]
            setdiff!(left,path[2:end-1])
        end
    end
    # 第二步,找到所有孤立的环(subtour)
    left = collect(1:N)
    for path in paths;setdiff!(left,path);end
    while length(left)>0
        path = [left[1]]
        while true
            v, idx = findmax(g[path[end],left])
            if idx == 1
                break
            else
                g[left[idx],path[end]]=0
                g[path[end],left[idx]]=0
                push!(path,left[idx])
            end
        end
        setdiff!(left,path)
        push!(paths,path)
        push!(abnormal_paths,path)
    end
    return paths,abnormal_paths
end

paths,abnormal_paths = tours(x)
while length(abnormal_paths) > 0
    for path in paths
        s = setdiff(path,1)
        sn = setdiff(2:N,s)
        @constraint(m, sum(x[i,j] for i in s, j in setdiff(1:N,s)) >= ceil(length(s)/Q))
        @constraint(m, sum(x[i,j] for i in sn, j in setdiff(1:N,sn)) >= ceil(length(sn)/Q))
    end
    optimize!(m)
    paths,abnormal_paths = tours(x)
end
draw_vrp(x)

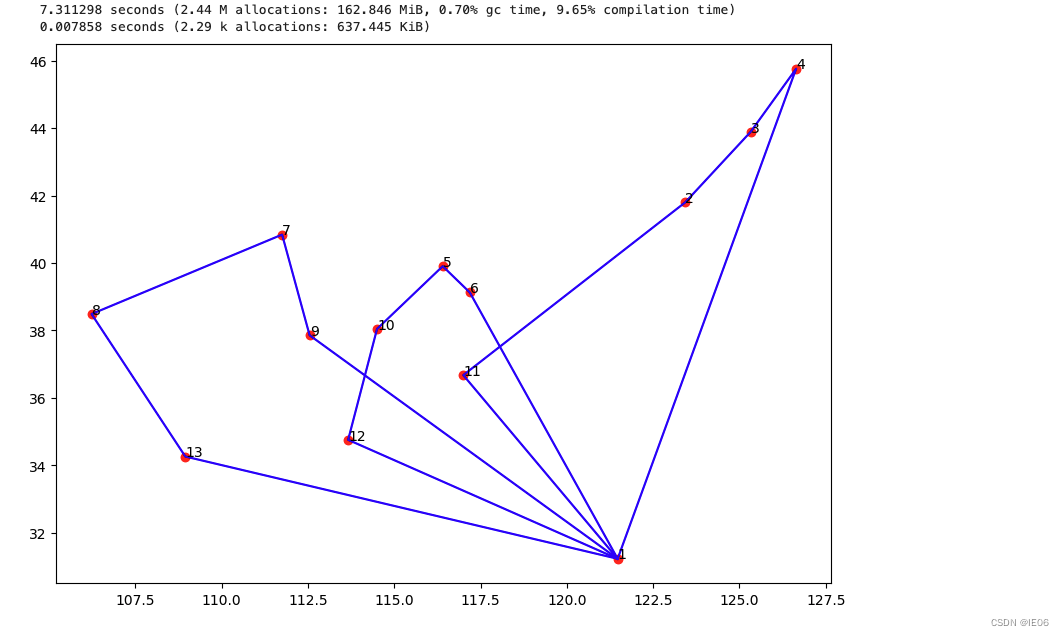
3. set-partitioning方法
方法很直观,把所有的子路径用TSP问题求解(使用Concorde库),然后用set-partitioning方法选择最合适的几条路线组合成VRP的结果。
using JuMP, HiGHS, Combinatorics, Concorde

k = 3
N = 13 #34
Q = 4 #13

function getRoutes(k,N,Q)
    Qm = N-1-(k-1)*Q
    route_dists = Dict()
    # 求解所有子路径的最优解
    for q in Qm:Q
        for c in combinations(2:N,q)
            c_index_tour,c_tour_length = Concorde.solve_tsp(floor.(Int,distmat[[1;c],[1;c]].*100))
            c_tour = [1;c][c_index_tour]
            route_dists[c_tour] = c_tour_length
        end
    end
    route_dists
end
@time route_dists = getRoutes(k,N,Q);
CVRP = Model(HiGHS.Optimizer)
set_silent(CVRP)
routes = collect(keys(route_dists))
route_dists = collect(values(route_dists))
rn = length(routes)
@variable(CVRP,x[1:rn],Bin)
@objective(CVRP,Min, sum(x[i]*route_dists[i] for i in 1:rn))
a = zeros(Int,rn,N)
for i in 1:rn,j in routes[i];a[i,j]=1;end
for j in 2:N;@constraint(CVRP,sum(x[i]*a[i,j] for i in 1:rn)==1);end
@constraint(CVRP,sum(x)==k)
@time optimize!(CVRP)
rs = routes[findall(x->x>0.1,value.(x))]
plt.figure(figsize=(10,7))
plt.scatter(pos[1:N,1],pos[1:N,2],c="red")
for i in 1:N;plt.text(pos[i,1], pos[i,2], i);end
for r in rs
    l = pos[[r;1],:]
    PyPlot.plot(l[:,1], l[:,2], color="b")
end
4. 关于测试数据
测试案例可参考 http://vrp.atd-lab.inf.puc-rio.br/index.php/en/。
我们这里用的数据为:
pos = [121.472641	31.231707
123.429092	41.796768
125.324501	43.886841
126.642464	45.756966
116.405289	39.904987
117.190186	39.125595
111.75199	40.84149
106.23248	38.48644
112.549248	37.857014
114.502464	38.045475
117.000923	36.675808
113.665413	34.757977
108.948021	34.263161
114.298569	30.584354
118.76741	32.041546
117.283043	31.861191
112.982277	28.19409
115.892151	28.676493
120.15358	30.287458
119.306236	26.075302
113.28064	23.125177
121.520076	25.030724
110.19989	20.04422
108.320007	22.82402
106.504959	29.533155
102.71225	25.040609
106.713478	26.578342
104.065735	30.659462
103.83417	36.06138
101.77782	36.61729
91.1145	29.64415
87.61688	43.82663
114.16546	22.27534
113.54913	22.19875];

function dis(i,j)
    A = pos[i,:];B = pos[j,:]
    sqrt(sum((A-B).^2))
end

function drawTree(t,n)
    plt.figure(figsize=(10,7))
    plt.scatter(pos[1:n,1],pos[1:n,2],c="red")
    for i in 1:n;plt.text(pos[i,1], pos[i,2], i);end
    for i in 1:length(t)
        l = pos[collect(t[i]),:]
        PyPlot.plot(l[:,1], l[:,2], color="b")
    end
end

function draw_vrp(x)
    xv = value.(x)
    t = []
    for i in 1:size(x)[1],j in 1:size(x)[1]
        if xv[i,j]>0.1;push!(t,(i,j));end
    end
    drawTree(t,size(x)[1])
end






![[职场] 提升学历考研再就业有必要吗 #其他#知识分享](https://img-blog.csdnimg.cn/img_convert/1b74445aafbd482c49e57b68add335b1.jpeg)


