Python 数据可视化 多色散点图
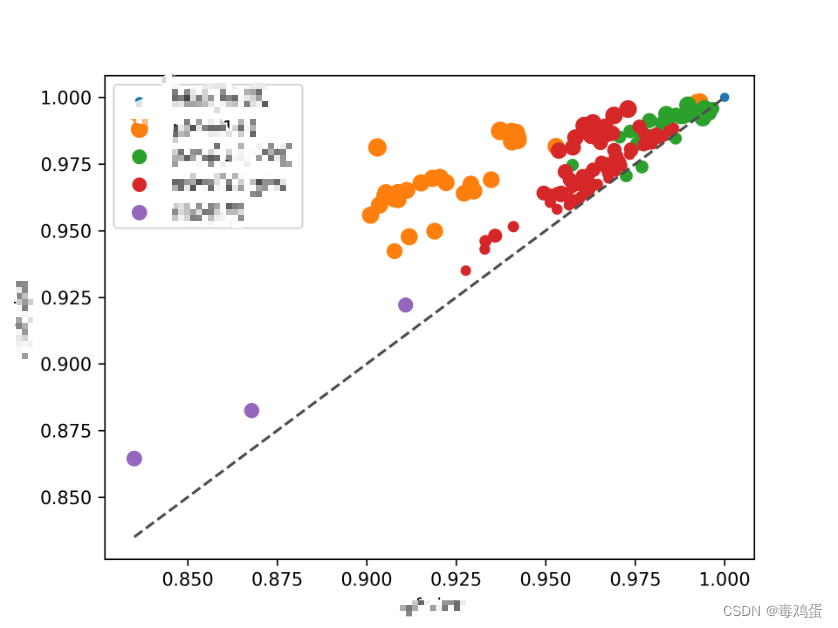
fig, ax = plt.subplots()
max_line = max([max(merged_df['unif_ref_value']), max(merged_df['unif_rust_value'])])
min_line = min([max(merged_df['unif_ref_value']), max(merged_df['unif_rust_value'])])
ax.plot([min_line, max_line], [min_line, max_line], ls="--", c=".3")
for name, group in gb:
    ax.scatter(group['unif_ref_value'], group['unif_rust_value'], label=name, s=group['dup_ratio']*100)

# ax = merged_df.plot.scatter(x='unif_ref_value', y='unif_rust_value',
#                             # c=merged_df["panel"].map({"panel15X": "red", "panel15_HRD": "blue", "panel15_pro": "green", "panel16": "yellow", "HRD_WGS": "blank"}),
#                             # c=colors, cmap=cmap,
#                             c='DarkBlue', colorbar=True,
#                             s=merged_df['dup_ratio']*100, title='Uniformity Plot')

# 保存图表到文件
ax.legend()
fig.savefig('tmp_plot.png', dpi=300)


