看了下使用说明,试了半天终于搞对了
参考文档:Documentation - Apache ECharts
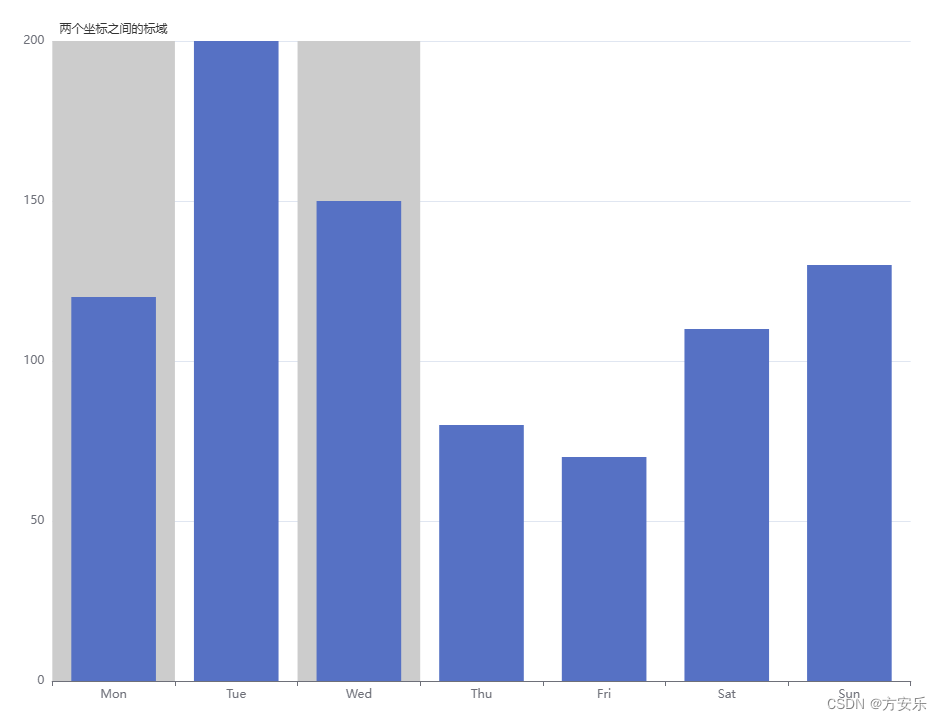
option = {
  xAxis: {
    type: 'category',
    data: ['Mon', 'Tue', 'Wed', 'Thu', 'Fri', 'Sat', 'Sun']
  },
  yAxis: {
    type: 'value'
  },
  series: [
    {
      data: [120, 200, 150, 80, 70, 110, 130],
      type: 'bar',
       markArea: {
        itemStyle: {
          color: '#ccc'
        },
        data: [
          [
        {
            name: '两个坐标之间的标域',
            coord: ['Mon']
        },
        {
            coord: ['Mon']
        }
          ],     [
        {
            // name: '两个坐标之间的标域',
            coord: ['Wed']
        },
        {
            coord: ['Wed']
        }
          ],
        ]
      },
    }
  ]
};