2024.06.19今天我学习了echarts dataZoom如何用按钮来控制放大缩小的功能,
效果如下:
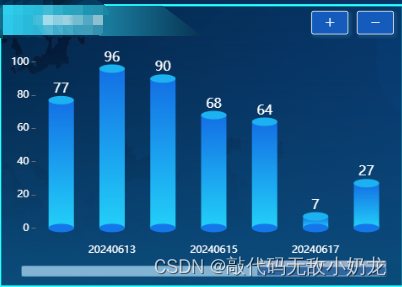
通过控制按钮来实现图表放大缩小数据的效果。
步骤如下:
一、写缩放按钮,以及图表数据。
二、设置初始位置的变量,我这边是七个图表数据一个周期,所以初始位置为94。
三、缩放按钮方法,点击+号 +1个距离 点击-号 -1个距离,记得给限制,比如最大只能放大到图表的startValue:100 endValue:100,最小到图表x轴的总长度 startValue:100 - xAxis.length endValue:100。
四、图表dataZoom动态渲染,startValue:this.startValue。
代码如下:
<template>
   <div>
     <el-button icon="el-icon-plus" @click="dataZoom_click('add')"/>
     <el-button icon="el-icon-minus" @click="dataZoom_click('sub')"/>
     <div ref="line" style="width:"200px";height="200px""/>
   <div>
</template>

<script>
export default{
  data(){
    return{
        startValue:94,//默认偏移距离是94

        echarts_xAxis:['1月','2月','3月','4月','5月','6月'],//图表x轴的数据,我这边需求是要图表数据超过五个才显示这个缩放按钮,如果没有限制可以不用
     }
  },
  mounted(){
    this.get_line_echarts = this.$echarts.init(this.$refs.line);
    this.get_line_echarts_line();//获取图表数据
  },
  methods:{
    // 缩放按钮
    dataZoom_click(type){
       if (type== 'add' && this.startValue< 100) {
        this.startValue= this.startValue+ 1;

          } else if (type== 'sub' && this.startValue> 101 - this.startValue.length) {

        this.startValue= this.startValue- 1;
          }
    },
    // 图表数据
    get_line_echarts_line(){
      let option = {
        xAxis:{},
        yAxis:{},
        series:[{}]
      }

          // 重点
          option.dataZoom = [
            {
              type: 'slider',//slider表示有滑动块的,inside表示内置的
              startValue: this.startValue,//默认为0  可设置滚动条从在后进行展示
              endValue: 100,//默认为100
              show: true,
              handleSize: 0,//滑动条的 左右2个滑动条的大小
              height: 12,//组件高度
              left: '5%', //左边的距离
              right: '5%',//右边的距离
              bottom: this.screen_width < 1000 ? -2 : 2,//右边的距离
              borderColor: "#eee",//边框颜色
              fillerColor: '#9f9d9d',//滚动条颜色
              backgroundColor: '#eee',//两边未选中的滑动条区域的颜色
              showDataShadow: false,//是否显示数据阴影 默认auto
              showDetail: false,//即拖拽时候是否显示详细数值信息 默认true
            },
            {
              show: true,
              type: 'inside',
              startValue: this.startValue,
              endValue: 100
            }];

          // this.get_line_echarts.clear();
          this.get_line_echarts.setOption(option);
    }
  }
}
</script>
