一、问题描述
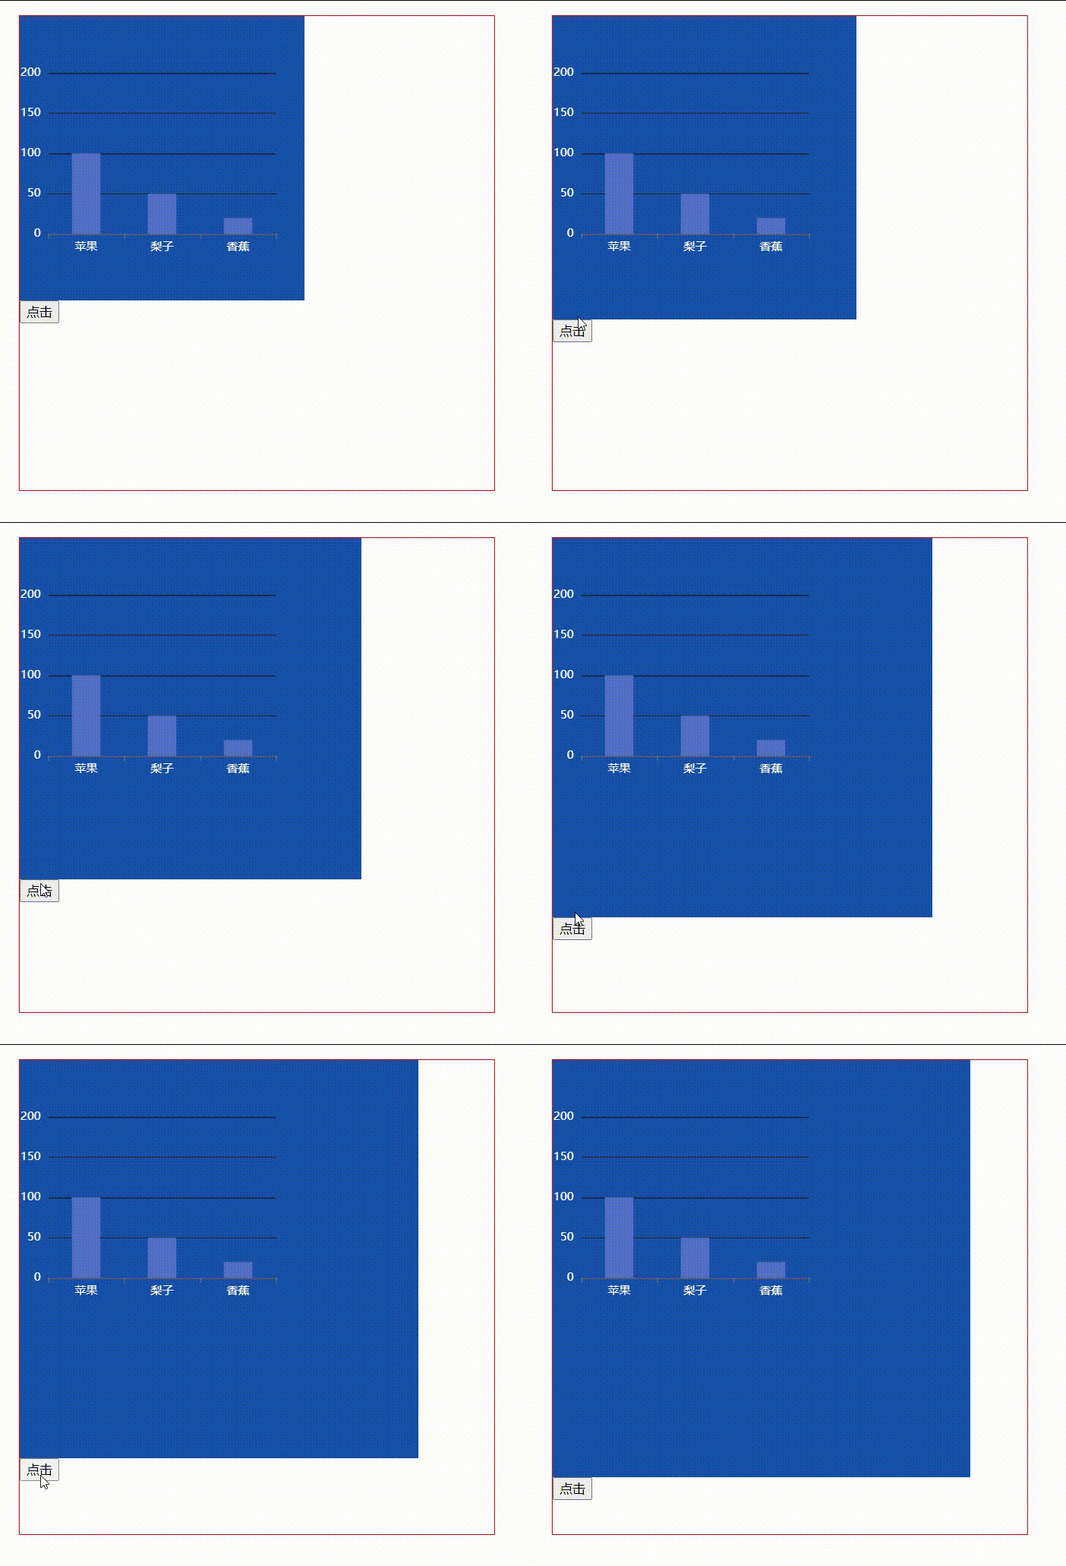
当echarts图表在一个盒子里的时候,盒子大小变化了,但是图表没有跟着自适应,比如这样,盒子变大了,但是图表没变化
二、解决方法
在盒子大小更改的同时,调用图表的resize方法,记得在nextTick调用,这是我更改盒子的方法,你们只要在盒子大小更改的时候调用就可以了
  change() {
      this.width += 20;
      this.$nextTick(() => {
        this.chart.resize();
      });
    },
三、更改后的效果

四、全部代码
我把我的代码贴出来,想要试试的话可以直接粘贴,记得要是直接粘贴用的话先检查项目是否下载了echarts,
<template>
  <div class="MonitoringSensor">
    <div id="main" :style="{ width: width + 'px', height: width + 'px' }"></div>
    <button @click="change">点击</button>
  </div>
</template>

<script>
import * as echarts from 'echarts';

export default {
  name: 'App',
  components: {},

  data() {
    return {
      chart: null,
      width: 300,
    };
  },
  mounted() {
    this.initChart();
  },

  methods: {
    initChart() {
      this.chart = echarts.init(document.getElementById('main'));
      let options = null;
      options = {
        xAxis: {
          type: 'category',
          data: ['苹果', '梨子', '香蕉'],
          axisLabel: {
            color: '#fff',
          },
        },

        yAxis: {
          type: 'value',
          max: 200,
          axisLabel: {
            color: '#fff',
          },
          splitLine: {
            lineStyle: {
              color: '#222',
            },
          },
        },
        tooltip: {
          trigger: 'axis',
        },
        series: [
          {
            type: 'bar',
            data: [100, 50, 20],
            barWidth: 30,
          },
        ],
      };
      options && this.chart.setOption(options);
    },
    change() {
      this.width += 20;
      this.$nextTick(() => {
        this.chart.resize();
      });
    },
  },
};
</script>

<style scoped>
.MonitoringSensor {
  width: 500px;
  height: 500px;

  margin: 0 auto;
  border: 1px solid red;
}

#main {
  background: rgb(24, 80, 169);
}
</style>

