实验数据为商用模块化航空推进系统仿真C-MAPSS数据集,该数据集为NASA格林中心为2008年第一届预测与健康管理国际会议(PHM08)竞赛提供的引擎性能退化模拟数据集,数据集整体信息如下所示:

涡扇发动机仿真模拟模型如下图所示。

仿真建模主要针对发动机气路部分,主要包含风扇扇叶(Fan)、低压压气机(LPC)、高压压气机(HPC)、燃烧室(Combustor)、低压转子(N1)、高压转子(N2)、高压涡轮(HPT)、低压涡轮(LPT)、尾喷管(Nozzle)。数据集是涡扇发动机性能组件在不同时刻的监测数据,因此数据具有时序性且反映出涡扇发动机性能的退化。
数据集划分出四个子数据集,不同的子数据集发动机处在不同的运行工况且故障模式不一致。子数据集中均包含对应的训练数据集、预测数据集和预测结果标签数据集。在同一训练数据集中,所有涡扇发动机机组是同一类型,但每台涡扇发动机存在初始磨损和制造安装误差;每个机组的传感器监测数据是完整,反映了涡扇发动机从初始到故障的所有生命周期。而测试集是同一涡扇发动机生命周期的片段化数据。训练数据集和测试数据集都是26列,其中第一列是涡扇发动机机组编号,第二列是某一机组发动机运行的周期数,第三列到第五列是三种输入参数配置即操作数,以及余下21列为传感器监测的涡扇发动机指标如下所示。


为充分提取所有监测数据中的退化特征,选择出能够体现发动机退化趋势的传感器数据。以编号为FD001的训练数据集为例,给出部分传感器数据变化曲线如下图所示。

编号为FD001的训练数据集中存在7组传感器采集的数据是恒定的,并不随涡扇发动机使用时间的增加而产生变化;14组传感器采集的数据与涡扇发动机的性能变化相关,传感器具体名称和符号如下所示。


from google.colab import drivedrive.mount('/content/drive')import pandas as pdimport numpy as npimport matplotlib.pyplot as pltimport seaborn as snsimport warningswarnings.filterwarnings('ignore')
index_names = ['unit_number', 'time_cycles']setting_names = ['setting_1', 'setting_2', 'setting_3']sensor_names = ['sensor_{}'.format(i) for i in range(1,22)]col_names = index_names + setting_names + sensor_names
FD001 subset corresponds to HPC failure of the engine.
path = '/content/drive/MyDrive/Colab Notebooks/NASA Turbofan Jet Engine Data Set/data/'df_train = pd.read_csv(path+'train_FD001.txt',sep='\s+',header=None,index_col=False,names=col_names)df_valid = pd.read_csv(path+'test_FD001.txt',sep='\s+',header=None,index_col=False,names=col_names)y_valid = pd.read_csv(path+'RUL_FD001.txt',sep='\s+',header=None,index_col=False,names=['RUL'])y_valid.shape
train = df_train.copy()valid = df_valid.copy()display(train)display(valid)


print('Shape of the train dataset : ',train.shape)print('Shape of the validation dataset : ',valid.shape)
Shape of the train dataset :  (20631, 26)
Shape of the validation dataset :  (13096, 26)
Cheking the missing valuesprint('missing values in the train dataset : ',train.isna().sum())

train.describe().T

Data visualization
# 每个unit的最大寿命max_time_cycles = train[index_names].groupby('unit_number').max()plt.figure(figsize=(10,15))ax=max_time_cycles['time_cycles'].plot(kind='barh',width=0.8, stacked=True,align='center')plt.title('Turbofan Engines LifeTime',size=20)plt.xlabel('Time cycle',size=15)plt.xticks(size=15)plt.ylabel('unit',size=15)plt.yticks(size=10)plt.grid(True)plt.tight_layout()plt.show()

# Distribution of maximum time cyclessns.displot(max_time_cycles['time_cycles'],kde=True,bins=20,height=6,aspect=2)plt.xlabel('max time cycle'5

Add RUL column to the data
RUL corresponds to the remaining time cycles for each unit before it fails.
def add_RUL_column(df):max_time_cycles = df.groupby(by='unit_number')['time_cycles'].max()merged = df.merge( max_time_cycles.to_frame(name='max_time_cycle'), left_on='unit_number',right_index=True)merged["RUL"] = merged["max_time_cycle"] - merged['time_cycles']merged = merged.drop("max_time_cycle", axis=1)return mergedtrain = add_RUL_column(train)display(train)

# Rul analysismaxrul_u = train.groupby('unit_number').max().reset_index()maxrul_u.head()

Discovering Correlations
plt.figure(figsize=(8,8))corr = train.corr()mask = np.triu(np.ones_like(corr, dtype=bool))sns.heatmap(corr, mask=mask, robust=True, center=0,square=True, linewidths=.6,cmap='Blues')plt.title('Correlation')plt.show()

Sensor_dictionary={}dict_list=[ "(Fan inlet temperature) (◦R)","(LPC outlet temperature) (◦R)","(HPC outlet temperature) (◦R)","(LPT outlet temperature) (◦R)","(Fan inlet Pressure) (psia)","(bypass-duct pressure) (psia)","(HPC outlet pressure) (psia)","(Physical fan speed) (rpm)","(Physical core speed) (rpm)","(Engine pressure ratio(P50/P2)","(HPC outlet Static pressure) (psia)","(Ratio of fuel flow to Ps30) (pps/psia)","(Corrected fan speed) (rpm)","(Corrected core speed) (rpm)","(Bypass Ratio) ","(Burner fuel-air ratio)","(Bleed Enthalpy)","(Required fan speed)","(Required fan conversion speed)","(High-pressure turbines Cool air flow)","(Low-pressure turbines Cool air flow)" ]i=1for x in dict_list :Sensor_dictionary['sensor_'+str(i)]=xi+=1Sensor_dictionary

Plotting the evolution of features (sensors) along with the evolution with RUL
def plot_signal(df, Sensor_dic, signal_name):plt.figure(figsize=(13,5))for i in df['unit_number'].unique():if (i % 10 == 0): #For a better visualisation, we plot the sensors signals of 20 units onlyplt.plot('RUL', signal_name, data=df[df['unit_number']==i].rolling(10).mean())plt.title(signal_name)plt.xlim(250, 0) # reverse the x-axis so RUL counts down to zeroplt.xticks(np.arange(0, 300, 25))plt.ylabel(Sensor_dic[signal_name])plt.xlabel('Remaining Useful Life')plt.show()for i in range(1,22):try:plot_signal(train, Sensor_dictionary,'sensor_'+str(i))except:pass
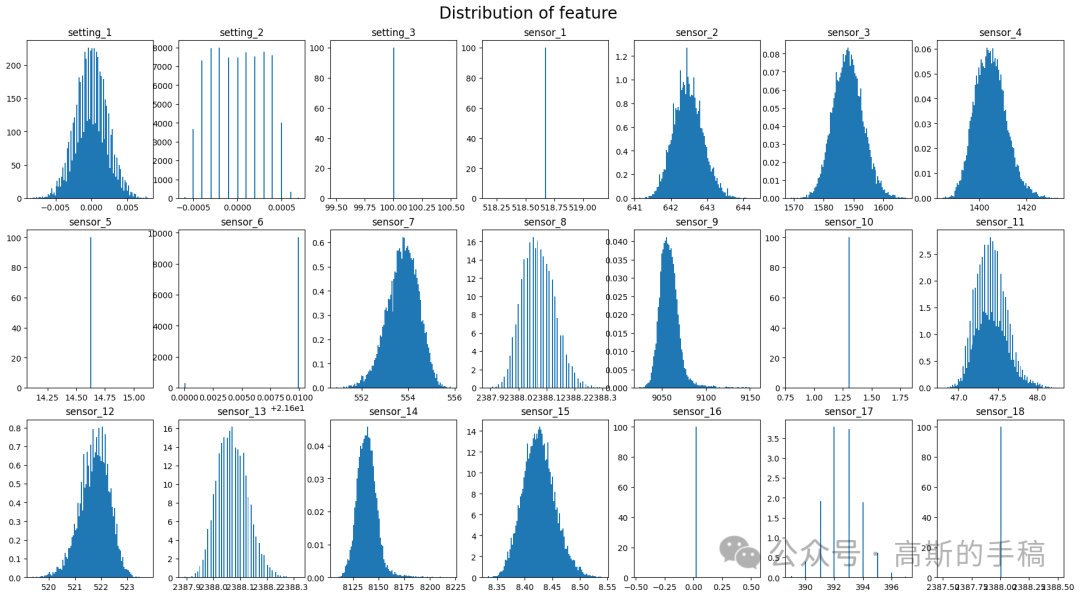
Observing the signal plots and the boxplots, we notice that the sensors 1,5,10,16,18,19 are constant, furthermore, we observe that the other sensors aren't well distributed and there are many outliers, then we should scale our data
x = df_valid.drop(index_names,axis=1)fig, axs = plt.subplots(3, 7, figsize=(23, 12)) #畫3(寬)*7(長)個圖,尺寸為25cm*10comfor f, ax in zip(x.columns, axs.ravel()):ax.hist(x[f], density=True, bins=100) #Histogramsax.set_title(f)plt.suptitle('Distribution of feature', y=0.93, fontsize=20)plt.show()

工学博士,担任《Mechanical System and Signal Processing》《中国电机工程学报》《控制与决策》等期刊审稿专家,擅长领域:现代信号处理,机器学习,深度学习,数字孪生,时间序列分析,设备缺陷检测、设备异常检测、设备智能故障诊断与健康管理PHM等。


