离散PID控制的封装界面如图1所示,在该界面中可设定PID的三个系数、采样时间及控制输入的上下界。仿真结果如图2所示。

图1 离散PID控制的封装界面

图2 阶跃响应结果
仿真图:
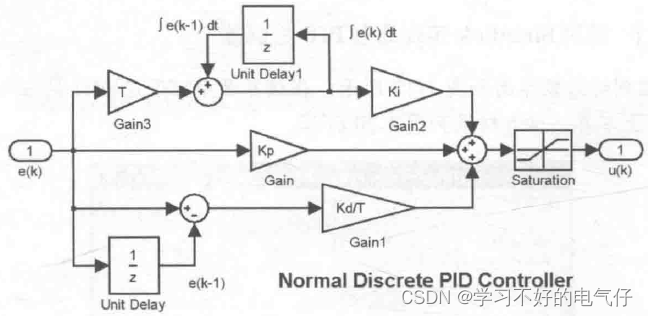
离散PID控制的比例、积分和微分三项分别由Simulink模块实现。

离散PID控制器仿真图:
作图程序:chap1_11plot.m
close all;
plot(t,y(:,1).r,ty(:,2),k:', linewidth’,2);
xlabel('time(s));ylabel('yd,y');
legend('Ideal position signal','Position tracking');
作图程序:chap1_11plot.m
close all;
plot(t,y(:,1).r,ty(:,2),k:', linewidth’,2);
xlabel('time(s));ylabel('yd,y');
legend('Ideal position signal','Position tracking');
作图程序:chap1_11plot.m
close all;
plot(t,y(:,1).r,ty(:,2),k:', linewidth’,2);
xlabel('time(s));ylabel('yd,y');
legend('Ideal position signal','Position tracking');