目录
1、组件介绍
2 、项目环境
2.1 各个环境版本
2.2 Docker-Compose变量配置
2.3 Docker-Compose服务配置
3、在Services中声明了四个服务
3.1 ElasticSearch服务
3.2 Logstash服务
3.3 Kibana服务
3.4 Filebeat服务
4、使用方法
4.1 方法一
4.2 方法二
5、启动
1、组件介绍
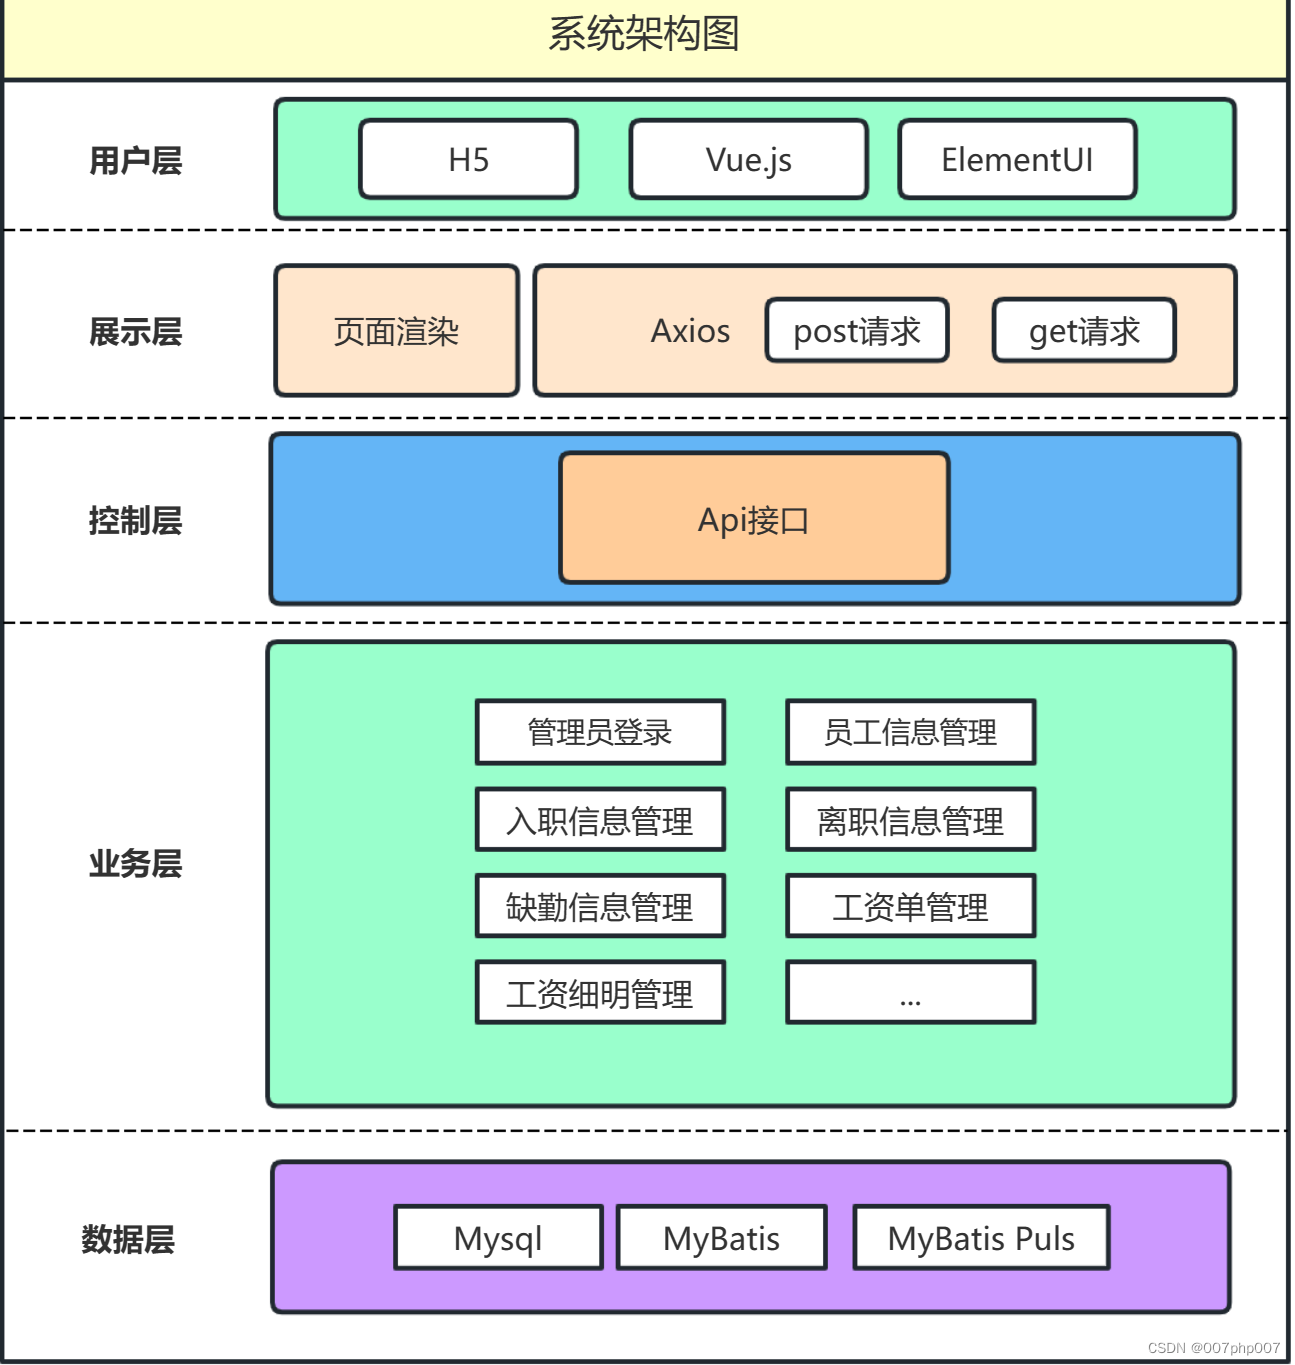
在ELK Stack中同时包括了Elastic Search、LogStash、Kibana以及Filebeat;
各个组件的作用如下:
-
Filebeat:采集文件等日志数据;
-
LogStash:过滤日志数据;
-
Elastic Search:存储、索引日志;
-
Kibana:用户界面;
各个组件之间的关系如下图所示:

2 、项目环境
因为ElasticSearch是用Java语言编写的,所以必须安装JDK的环境,并且是JDK 1.8以上。
# 安装
sudo yum install java-11-openjdk -y# 安装完成查看java版本
java -version
>>>:
[root@VM-0-5-centos config]# java --version
openjdk 11.0.16.1 2022-08-12 LTS
OpenJDK Runtime Environment (Red_Hat-11.0.16.1.1-1.el7_9) (build 11.0.16.1+1-LTS)
OpenJDK 64-Bit Server VM (Red_Hat-11.0.16.1.1-1.el7_9) (build 11.0.16.1+1-LTS, mixed mode, sharing)
2.1 各个环境版本
-
操作系统:CentOS 7
-
Docker:20.10.18
-
Docker-Compose:2.4.1
-
ELK Version:7.4.2
-
Filebeat:7.4.2
-
JAVA:11.0.16.1
2.2 Docker-Compose变量配置
首先,在配置文件
.env中统一声明了ES以及各个组件的版本:
.env
ES_VERSION=7.1.02.3 Docker-Compose服务配置
创建Docker-Compose的配置文件:
version: '3.4'
services:
elasticsearch:
image: "docker.elastic.co/elasticsearch/elasticsearch:${ES_VERSION}"
environment:
- discovery.type=single-node
volumes:
- /etc/localtime:/etc/localtime
- /elk/elasticsearch/data:/usr/share/elasticsearch/data
- /elk/elasticsearch/config/elasticsearch.yml:/usr/share/elasticsearch/config/elasticsearch.yml
- /elk/elasticsearch/plugins:/usr/share/elasticsearch/plugins
ports:
- "9200:9200"
- "9300:9300"
logstash:
depends_on:
- elasticsearch
image: "docker.elastic.co/logstash/logstash:${ES_VERSION}"
volumes:
- /elk/logstash/config/conf.d/logstash.conf:/usr/share/logstash/pipeline/logstash.conf
ports:
- "5044:5044"
links:
- elasticsearch
kibana:
depends_on:
- elasticsearch
image: "docker.elastic.co/kibana/kibana:${ES_VERSION}"
volumes:
- /etc/localtime:/etc/localtime
# kibana.yml配置文件放在宿主机目录下,方便后续汉化
- /elk/kibana/config/kibana.yml:/usr/share/kibana/config/kibana.yml
ports:
- "5601:5601"
links:
- elasticsearch
filebeat:
depends_on:
- elasticsearch
- logstash
image: "docker.elastic.co/beats/filebeat:${ES_VERSION}"
user: root # 必须为root
environment:
- strict.perms=false
volumes:
- /elk/filebeat/config/filebeat.yml:/usr/share/filebeat/filebeat.yml:ro
# 映射到容器中[作为数据源]
- /elk/filebeat/logs:/usr/share/filebeat/logs:rw
- /elk/filebeat/data:/usr/share/filebeat/data:rw
# 将指定容器连接到当前连接,可以设置别名,避免ip方式导致的容器重启动态改变的无法连接情况
links:
- logstash3、在Services中声明了四个服务
-
elasticsearch
-
logstash
-
kibana
-
filebeat
3.1 ElasticSearch服务
创建docker容器挂在的目录
注意:chmod -R 777 /elk/elasticsearch 要有访问权限
mkdir -p /elk/elasticsearch/config/
mkdir -p /elk/elasticsearch/data/
mkdir -p /elk/elasticsearch/plugins/
echo "http.host: 0.0.0.0">>/elk/elasticsearch/config/elasticsearch.yml
在elasticsearch服务的配置中有几点需要特别注意:
-
discovery.type=single-node:将ES的集群发现模式配置为单节点模式; -
/etc/localtime:/etc/localtime:Docker容器中时间和宿主机同步; -
/docker_es/data:/usr/share/elasticsearch/data:将ES的数据映射并持久化至宿主机中; -
/elk/elasticsearch/plugins:/usr/share/elasticsearch/plugins:将插件挂载到主机; -
/elk/elasticsearch/config/elasticsearch.yml:/usr/share/elasticsearch/config/elasticsearch.yml:将配置文件挂载到主机;
3.2 Logstash服务
创建docker容器挂在的目录
注意:chmod -R 777 /elk/logstash 要有访问权限
mkdir -p /elk/logstash/config/conf.d在logstash服务的配置中有几点需要特别注意:
-
/elk/logstash/config/conf.d/logstash.conf:/usr/share/logstash/pipeline/logstash.conf:将宿主机本地的logstash配置映射至logstash容器内部;
下面是LogStash的配置,在使用时可以自定义logstash.conf:
input {
# 来源beats
beats {
# 端口
port => "5044"
}
}
output {
elasticsearch {
hosts => ["http://elasticsearch:9200"]
index => "test"
}
stdout { codec => rubydebug }
}在这里我们将原来tcp收集方式修改为由filebeat上报,同时固定了索引为test;
3.3 Kibana服务
创建docker容器挂在的目录
注意:chmod -R 777 /elk/kibana 要有访问权限
mkdir -p /elk/kibana/config在kibana服务的配置中有几点需要特别注意:
-
/elk/kibana/config/kibana.yml:/usr/share/kibana/config/kibana.yml:配置ES的地址; -
/etc/localtime:/etc/localtime:Docker容器中时间和宿主机同步;
修改 kibana.yml 配置文件,新增(修改)配置项i18n.locale: "zh-CN"
[root@VM-0-5-centos ~]# cd /mydata/kibana/config
[root@VM-0-5-centos config]# cat kibana.yml
# Default Kibana configuration for docker target
server.name: kibana
server.host: "0"
elasticsearch.hosts: [ "http://elasticsearch:9200" ]
xpack.monitoring.ui.container.elasticsearch.enabled: true
i18n.locale: "zh-CN" # 设置为中文
[root@VM-0-5-centos config]# 3.4 Filebeat服务
注意:chmod -R 777 /elk/filebeat 要有访问权限
创建docker容器挂在的目录
mkdir -p /elk/filebeat/config
mkdir -p /elk/filebeat/logs
mkdir -p /elk/filebeat/data
在Filebeat服务的配置中有几点需要特别注意
-
配置
user: root和环境变量strict.perms=false:如果不配置可能会因为权限问题无法启动;
volumes:
-  - /elk/filebeat/config/filebeat.yml:/usr/share/filebeat/filebeat.yml:ro
+    - <your_log_path>/filebeat.yml:/usr/share/filebeat/filebeat.yml:ro
-  - /elk/filebeat/logs:/usr/share/filebeat/logs:rw
+    - <your_log_path>:/usr/share/filebeat/logs:rw
-  - /elk/filebeat/data:/usr/share/filebeat/data:rw
+    - <your_data_path>:/usr/share/filebeat/logs:rw
同时还需要创建Filebeat配置文件:
filebeat.yml
filebeat.inputs:
- type: log
enabled: true
paths:
# 容器中目录下的所有.log文件
- /usr/share/filebeat/logs/*.log
multiline.pattern: ^\[
multiline.negate: true
multiline.match: after
filebeat.config.modules:
path: ${path.config}/modules.d/*.yml
reload.enabled: false
setup.template.settings:
index.number_of_shards: 1
setup.dashboards.enabled: false
setup.kibana:
host: "http://kibana:5601"
# 直接传输至ES
#output.elasticsearch:
# hosts: ["http://es-master:9200"]
# index: "filebeat-%{[beat.version]}-%{+yyyy.MM.dd}"
# 传输至LogStash
output.logstash:
hosts: ["logstash:5044"]
processors:
- add_host_metadata: ~
- add_cloud_metadata: ~上面给出了一个filebeat配置文件示例,实际使用时可以根据需求进行修改;
4、使用方法
4.1 方法一
使用前必看:
① 修改ELK版本
可以修改在.env中的ES_VERSION字段,修改你想要使用的ELK版本;
② LogStash配置
修改logstash.conf为你需要的日志配置;
③ 修改ES文件映射路径
修改docker-compose中elasticsearch服务的volumes,将宿主机路径修改为你实际的路径:
volumes:
  - /etc/localtime:/etc/localtime
-  - /docker_es/data:/usr/share/elasticsearch/data
+ - [your_path]:/usr/share/elasticsearch/data
并且修改宿主机文件所属:
sudo chown -R 1000:1000 [your_path]④ 修改filebeat服务配置
修改docker-compose中filebeat服务的volumes,将宿主机路径修改为你实际的路径:
volumes:
    - ./filebeat.yml:/usr/share/filebeat/filebeat.yml:ro
-    - /elk/filebeat/logs:/usr/share/filebeat/logs:rw
+    - <your_log_path>:/usr/share/filebeat/logs:rw
-    - /elk/filebeat/data:/usr/share/filebeat/data:rw
+    - <your_data_path>:/usr/share/filebeat/logs:rw
⑤ 修改Filebeat配置
修改filebeat.yml为你需要的配置;
Filebeat配置文件详情参见如下:
[vagrant@localhost filebeat-7.7.1]$ vi filebeat.yml
###################### Filebeat Configuration Example #########################
#=========================== Filebeat inputs =============================

filebeat.inputs:

# Each - is an input. Most options can be set at the input level, so
#每个-是一个输入。大多数选项可以在输入级别设置,因此
# you can use different inputs for various configurations.
#您可以为各种配置使用不同的输入。
# Below are the input specific configurations.
#下面是特定于输入的配置。

- type: log

  # Change to true to enable this input configuration.
  #更改为true以启用此输入配置。
  enabled: true

  # Paths that should be crawled and fetched. Glob based paths.
  #应该被爬取的路径。基础路径。
  paths:
    #可配置多个路径
    - /home/vagrant/apache-tomcat-9.0.20/logs/catalina.*.out
    #- c:\programdata\elasticsearch\logs\*

  # Exclude lines. A list of regular expressions to match. It drops the lines that are
  #排除线路。要匹配的正则表达式列表。它去掉了
  # matching any regular expression from the list.
  #匹配列表中的任何正则表达式。
  #exclude_lines: ['^DBG']

  # Include lines. A list of regular expressions to match. It exports the lines that are
  #要匹配的正则表达式列表。它导出
  # matching any regular expression from the list.
  #匹配列表中的任何正则表达式。
  #include_lines: ['^INFO','^ERR', '^WARN']

  # Exclude files. A list of regular expressions to match. Filebeat drops the files that
  #排除的文件。要匹配的正则表达式列表。Filebeat删除的文件
  # are matching any regular expression from the list. By default, no files are dropped.
  #匹配列表中的任何正则表达式。默认情况下,没有文件被删除。
  #exclude_files: ['.gz$']

  # Optional additional fields. These fields can be freely picked
  #可选的附加字段。这些字段可以自由选择
  # to add additional information to the crawled log files for filtering
  #添加附加信息到抓取的日志文件进行过滤
  #fields:
  #  level: debug
  #  review: 1

  ### Multiline options

  # Multiline can be used for log messages spanning multiple lines. This is common
  # Multiline可用于记录跨多行的消息。这是常见的
  # for Java Stack Traces or C-Line Continuation
  #用于Java堆栈跟踪或c行延续
  # The regexp Pattern that has to be matched. The example pattern matches all lines starting with [
  #必须匹配的regexp模式。示例模式匹配以[开头的所有行
  multiline.pattern: ^\[

  # Defines if the pattern set under pattern should be negated or not. Default is false.
  #定义模式下的模式集是否应该被否定。默认是false
  multiline.negate: true

  # Match can be set to "after" or "before". It is used to define if lines should be append to a pattern
  #Match可以设置为“after”或“before”。它用于定义是否应该将行追加到模式中
  # that was (not) matched before or after or as long as a pattern is not matched based on negate.
  #在之前或之后匹配的,或者只要模式没有基于negate匹配。
  # Note: After is the equivalent to previous and before is the equivalent to to next in Logstash
  #注意:在Logstash中,After等同于previous, before等同于next
  multiline.match: after


#============================= Filebeat modules ===============================

filebeat.config.modules:
  # Glob pattern for configuration loading
  #配置加载的Glob模式
  path: ${path.config}/modules.d/*.yml

  # Set to true to enable config reloading
  #设置为true可重新加载配置
  reload.enabled: false

  # Period on which files under path should be checked for changes
  #应该检查path下的文件是否有更改的时间段
  #reload.period: 10s

#==================== Elasticsearch template setting ==========================

setup.template.settings:
  index.number_of_shards: 1
  #index.codec: best_compression
  #_source.enabled: false

#================================ General =====================================

# The name of the shipper that publishes the network data. It can be used to group
#应该检查path下文件更改的时间段#发布网络数据的托运人的名称。它可以用来分组
# all the transactions sent by a single shipper in the web interface.
#由一个托运人在web interfac中发送的所有事务
#name:

# The tags of the shipper are included in their own field with each
#每个托运人的标签都包含在它们自己的字段中
# transaction published.
#事务发表。
#tags: ["service-X", "web-tier"]

# Optional fields that you can specify to add additional information to the
#属性中添加附加信息的可选字段
# output.
#fields:
#  env: staging


#============================== Dashboards =====================================
# These settings control loading the sample dashboards to the Kibana index. Loading
#这些设置控制将样例指示板加载到Kibana索引。加载
# the dashboards is disabled by default and can be enabled either by setting the
#仪表板在默认情况下是禁用的,可以通过设置
# options here or by using the `setup` command.
#选项或使用' setup '命令。
#setup.dashboards.enabled: false

# The URL from where to download the dashboards archive. By default this URL
#下载仪表板归档文件的URL。默认情况下,这个URL
# has a value which is computed based on the Beat name and version. For released
#有一个基于节拍名称和版本计算的值。对发布的
# versions, this URL points to the dashboard archive on the artifacts.elastic.co
#版本号,此URL指向工件.elastic.co上的仪表板存档
# website.
#setup.dashboards.url:

#============================== Kibana =====================================

# Starting with Beats version 6.0.0, the dashboards are loaded via the Kibana API.
#从Beats 6.0.0版本开始,仪表板是通过Kibana API加载的。
# This requires a Kibana endpoint configuration.
#这需要Kibana端点配置。
setup.kibana:

  # Kibana Host
  # Scheme and port can be left out and will be set to the default (http and 5601)
  # In case you specify and additional path, the scheme is required: http://localhost:5601/path
  # IPv6 addresses should always be defined as: https://[2001:db8::1]:5601
  host: "192.168.0.140:5601"

  # Kibana Space ID
  # ID of the Kibana Space into which the dashboards should be loaded. By default,
  # the Default Space will be used.
  #space.id:

#============================= Elastic Cloud ==================================

# These settings simplify using Filebeat with the Elastic Cloud (https://cloud.elastic.co/).

# The cloud.id setting overwrites the `output.elasticsearch.hosts` and
# `setup.kibana.host` options.
# You can find the `cloud.id` in the Elastic Cloud web UI.
#cloud.id:

# The cloud.auth setting overwrites the `output.elasticsearch.username` and
# `output.elasticsearch.password` settings. The format is `<user>:<pass>`.
#cloud.auth:

#================================ Outputs =====================================

# Configure what output to use when sending the data collected by the beat.
#配置在发送由节拍收集的数据时使用的输出。

#-------------------------- Elasticsearch output ------------------------------
#output.elasticsearch:
  # Array of hosts to connect to.
  #hosts: ["192.168.0.140:9200"]

  # Protocol - either `http` (default) or `https`.
  #protocol: "https"

  # Authentication credentials - either API key or username/password.
  #api_key: "id:api_key"
  #username: "elastic"
  #password: "changeme"

#----------------------------- Logstash output --------------------------------
output.logstash:
  # The Logstash hosts
  hosts: ["192.168.0.140:5044"]

  # Optional SSL. By default is off.
  # List of root certificates for HTTPS server verifications
  #ssl.certificate_authorities: ["/etc/pki/root/ca.pem"]

  # Certificate for SSL client authentication
  #ssl.certificate: "/etc/pki/client/cert.pem"

  # Client Certificate Key
  #ssl.key: "/etc/pki/client/cert.key"

#================================ Processors =====================================

# Configure processors to enhance or manipulate events generated by the beat.
#配置处理器以增强或操纵节拍生成的事件。

processors:
  - add_host_metadata: ~
  - add_cloud_metadata: ~
  - add_docker_metadata: ~
  - add_kubernetes_metadata: ~

#================================ Logging =====================================

# Sets log level. The default log level is info.
# Available log levels are: error, warning, info, debug
#logging.level: debug

# At debug level, you can selectively enable logging only for some components.
# To enable all selectors use ["*"]. Examples of other selectors are "beat",
# "publish", "service".
#logging.selectors: ["*"]

#============================== X-Pack Monitoring ===============================
# filebeat can export internal metrics to a central Elasticsearch monitoring
# cluster.  This requires xpack monitoring to be enabled in Elasticsearch.  The
# reporting is disabled by default.

# Set to true to enable the monitoring reporter.
#monitoring.enabled: false

# Sets the UUID of the Elasticsearch cluster under which monitoring data for this
# Filebeat instance will appear in the Stack Monitoring UI. If output.elasticsearch
# is enabled, the UUID is derived from the Elasticsearch cluster referenced by output.elasticsearch.
#monitoring.cluster_uuid:

# Uncomment to send the metrics to Elasticsearch. Most settings from the
# Elasticsearch output are accepted here as well.
# Note that the settings should point to your Elasticsearch *monitoring* cluster.
# Any setting that is not set is automatically inherited from the Elasticsearch
# output configuration, so if you have the Elasticsearch output configured such
# that it is pointing to your Elasticsearch monitoring cluster, you can simply
# uncomment the following line.
#monitoring.elasticsearch:

#================================= Migration ==================================

# This allows to enable 6.7 migration aliases
#migration.6_to_7.enabled: true
4.2 方法二
cd ELK
#修改run.sh里面的ES_HOST、LOG_HOST、KB_HOST
chmod +x ./run.sh  #使脚本具有执行权限
./run.sh  #执行脚本
5、启动
随后使用docker-compose命令启动:
docker-compose up -d
Creating network "docker_repo_default" with the default driver
Creating docker_repo_elasticsearch_1 ... done
Creating docker_repo_kibana_1        ... done
Creating docker_repo_logstash_1      ... done
Creating docker_repo_filebeat_1      ... done


![[docker] docker 安全知识 - docker api, 权限提升 资源管理](https://img-blog.csdnimg.cn/direct/ad18fea41cf0436593fcc9989e065f25.png)