文章目录
- 一、过滤
- 二、分组
- 三、聚合
- 四、多重转换
- 4.1 Filter and Group By
- 4.2 Filter and Aggregate
- 4.3 所有变换
- 4.4 Dash中的应用
一、过滤
如何通过 Plotly 在 Python 中使用过滤器。
注意 transforms在 v5 中已弃用,plotly将在未来版本中删除
import plotly.io as pio

subject = ['Moe','Larry','Curly','Moe','Larry','Curly','Moe','Larry','Curly','Moe','Larry','Curly']
score = [1,6,2,8,2,9,4,5,1,5,2,8]

data = [dict(
  type = 'scatter',
  x = subject,
  y = score,
  mode = 'markers',
  transforms = [dict(
    type = 'filter',
    target = 'y',
    operation = '>',
    value = 4
  )]
)]

layout = dict(
    title = 'Scores > 4'
)

fig_dict = dict(data=data, layout=layout)

pio.show(fig_dict, validate=False)

二、分组
如何在 Python 中通过 Plotly 使用 group by。
注意 transforms在 v5 中已弃用,plotly并将在未来版本中删除。
import plotly.io as pio

subject = ['Moe','Larry','Curly','Moe','Larry','Curly','Moe','Larry','Curly','Moe','Larry','Curly']
score = [1,6,2,8,2,9,4,5,1,5,2,8]

data = [dict(
  type = 'scatter',
  x = subject,
  y = score,
  mode = 'markers',
  transforms = [dict(
    type = 'groupby',
    groups = subject,
    styles = [
        dict(target = 'Moe', value = dict(marker = dict(color = 'blue'))),
        dict(target = 'Larry', value = dict(marker = dict(color = 'red'))),
        dict(target = 'Curly', value = dict(marker = dict(color = 'black')))
    ]
  )]
)]

fig_dict = dict(data=data)
pio.show(fig_dict, validate=False)

三、聚合
如何在 Python 中通过 Plotly 使用聚合。
注意 transforms在 v5 中已弃用,plotly并将在未来版本中删除。
聚合是一种可以应用于给定表达式中的值的转换类型。可用的聚合有:
| 功能 | 描述 |
|---|---|
| count | 返回每个组的项目数量。 |
| sum | 返回所有数值的总和。 |
| avg | 返回所有数值的平均值。 |
| median | 返回所有数值的中位数。 |
| mode | 返回所有数值的模式。 |
| rms | 返回所有数值的 rms。 |
| stddev | 返回所有数值的标准差。 |
| min | 返回每个组的最小数值。 |
| max | 返回每个组的最大数值。 |
| first | 返回每个组的第一个数值。 |
| last | 返回每个组的最后一个数值。 |
import plotly.io as pio

subject = ['Moe','Larry','Curly','Moe','Larry','Curly','Moe','Larry','Curly','Moe','Larry','Curly']
score = [1,6,2,8,2,9,4,5,1,5,2,8]

data = [dict(
  type = 'scatter',
  x = subject,
  y = score,
  mode = 'markers',
  transforms = [dict(
    type = 'aggregate',
    groups = subject,
    aggregations = [dict(
        target = 'y', func = 'sum', enabled = True),
    ]
  )]
)]

fig_dict = dict(data=data)

pio.show(fig_dict, validate=False)

四、多重转换
如何在 Python 中通过 Plotly 使用多个转换(过滤、分组和聚合)。
注意 transforms在 v5 中已弃用,plotly并将在未来版本中删除。
4.1 Filter and Group By
import plotly.io as pio

import pandas as pd
# "https://raw.githubusercontent.com/plotly/datasets/master/gapminderDataFiveYear.csv"
df = pd.read_csv("f:/gapminderDataFiveYear.csv")
print(df)
'''
          country  year         pop continent  lifeExp   gdpPercap
0     Afghanistan  1952   8425333.0      Asia   28.801  779.445314
1     Afghanistan  1957   9240934.0      Asia   30.332  820.853030
2     Afghanistan  1962  10267083.0      Asia   31.997  853.100710
3     Afghanistan  1967  11537966.0      Asia   34.020  836.197138
4     Afghanistan  1972  13079460.0      Asia   36.088  739.981106
...           ...   ...         ...       ...      ...         ...
1699     Zimbabwe  1987   9216418.0    Africa   62.351  706.157306
1700     Zimbabwe  1992  10704340.0    Africa   60.377  693.420786
1701     Zimbabwe  1997  11404948.0    Africa   46.809  792.449960
1702     Zimbabwe  2002  11926563.0    Africa   39.989  672.038623
1703     Zimbabwe  2007  12311143.0    Africa   43.487  469.709298

[1704 rows x 6 columns]
'''

colors = ['blue', 'orange', 'green', 'red', 'purple']

opt = []
opts = []
for i in range(0, len(colors)):
    opt = dict(
        target = df['continent'][[i]].unique(), value = dict(marker = dict(color = colors[i]))
    )
    opts.append(opt)

data = [dict(
  type = 'scatter',
  mode = 'markers',
  x = df['lifeExp'],
  y = df['gdpPercap'],
  text = df['continent'],
  hoverinfo = 'text',
  opacity = 0.8,
  marker = dict(
      size = df['pop'],
      sizemode = 'area',
      sizeref = 200000
  ),
  transforms = [
      dict(
        type = 'filter',
        target = df['year'],
        orientation = '=',
        value = 2007
      ),
      dict(
        type = 'groupby',
        groups = df['continent'],
        styles = opts
    )]
)]

layout = dict(
    yaxis = dict(
        type = 'log'
    )
)

fig_dict = dict(data=data, layout=layout)
pio.show(fig_dict, validate=False)

4.2 Filter and Aggregate
import plotly.io as pio
import pandas as pd
# "https://raw.githubusercontent.com/plotly/datasets/master/gapminderDataFiveYear.csv"
df = pd.read_csv("f:/gapminderDataFiveYear.csv")
print(df)
'''
          country  year         pop continent  lifeExp   gdpPercap
0     Afghanistan  1952   8425333.0      Asia   28.801  779.445314
1     Afghanistan  1957   9240934.0      Asia   30.332  820.853030
2     Afghanistan  1962  10267083.0      Asia   31.997  853.100710
3     Afghanistan  1967  11537966.0      Asia   34.020  836.197138
4     Afghanistan  1972  13079460.0      Asia   36.088  739.981106
...           ...   ...         ...       ...      ...         ...
1699     Zimbabwe  1987   9216418.0    Africa   62.351  706.157306
1700     Zimbabwe  1992  10704340.0    Africa   60.377  693.420786
1701     Zimbabwe  1997  11404948.0    Africa   46.809  792.449960
1702     Zimbabwe  2002  11926563.0    Africa   39.989  672.038623
1703     Zimbabwe  2007  12311143.0    Africa   43.487  469.709298

[1704 rows x 6 columns]
'''

data = [dict(
  type = 'scatter',
  mode = 'markers',
  x = df['lifeExp'],
  y = df['gdpPercap'],
  text = df['continent'],
  hoverinfo = 'text',
  opacity = 0.8,
  marker = dict(
      size = df['pop'],
      sizemode = 'area',
      sizeref = 200000
  ),
  transforms = [
      dict(
        type = 'filter',
        target = df['year'],
        orientation = '=',
        value = 2007
      ),
      dict(
        type = 'aggregate',
        groups = df['continent'],
        aggregations = [
            dict(target = 'x', func = 'avg'),
            dict(target = 'y', func = 'avg'),
            dict(target = 'marker.size', func = 'sum')
        ]
      )]
)]

layout = dict(
    yaxis = dict(
        type = 'log'
    )
)


fig_dict = dict(data=data, layout=layout)

pio.show(fig_dict, validate=False)

4.3 所有变换
import plotly.io as pio
import pandas as pd
# "https://raw.githubusercontent.com/plotly/datasets/master/gapminderDataFiveYear.csv"
df = pd.read_csv("f:/gapminderDataFiveYear.csv")
print(df)
'''
          country  year         pop continent  lifeExp   gdpPercap
0     Afghanistan  1952   8425333.0      Asia   28.801  779.445314
1     Afghanistan  1957   9240934.0      Asia   30.332  820.853030
2     Afghanistan  1962  10267083.0      Asia   31.997  853.100710
3     Afghanistan  1967  11537966.0      Asia   34.020  836.197138
4     Afghanistan  1972  13079460.0      Asia   36.088  739.981106
...           ...   ...         ...       ...      ...         ...
1699     Zimbabwe  1987   9216418.0    Africa   62.351  706.157306
1700     Zimbabwe  1992  10704340.0    Africa   60.377  693.420786
1701     Zimbabwe  1997  11404948.0    Africa   46.809  792.449960
1702     Zimbabwe  2002  11926563.0    Africa   39.989  672.038623
1703     Zimbabwe  2007  12311143.0    Africa   43.487  469.709298

[1704 rows x 6 columns]
'''

colors = ['blue', 'orange', 'green', 'red', 'purple']

opt = []
opts = []
for i in range(0, len(colors)):
    opt = dict(
        target = df['continent'][[i]].unique(), value = dict(marker = dict(color = colors[i]))
    )
    opts.append(opt)

data = [dict(
  type = 'scatter',
  mode = 'markers',
  x = df['lifeExp'],
  y = df['gdpPercap'],
  text = df['continent'],
  hoverinfo = 'text',
  opacity = 0.8,
  marker = dict(
      size = df['pop'],
      sizemode = 'area',
      sizeref = 200000
  ),
  transforms = [
      dict(
        type = 'filter',
        target = df['year'],
        orientation = '=',
        value = 2007
      ),
      dict(
        type = 'groupby',
        groups = df['continent'],
        styles = opts
      ),
      dict(
        type = 'aggregate',
        groups = df['continent'],
        aggregations = [
            dict(target = 'x', func = 'avg'),
            dict(target = 'y', func = 'avg'),
            dict(target = 'marker.size', func = 'sum')
        ]
      )]
)]

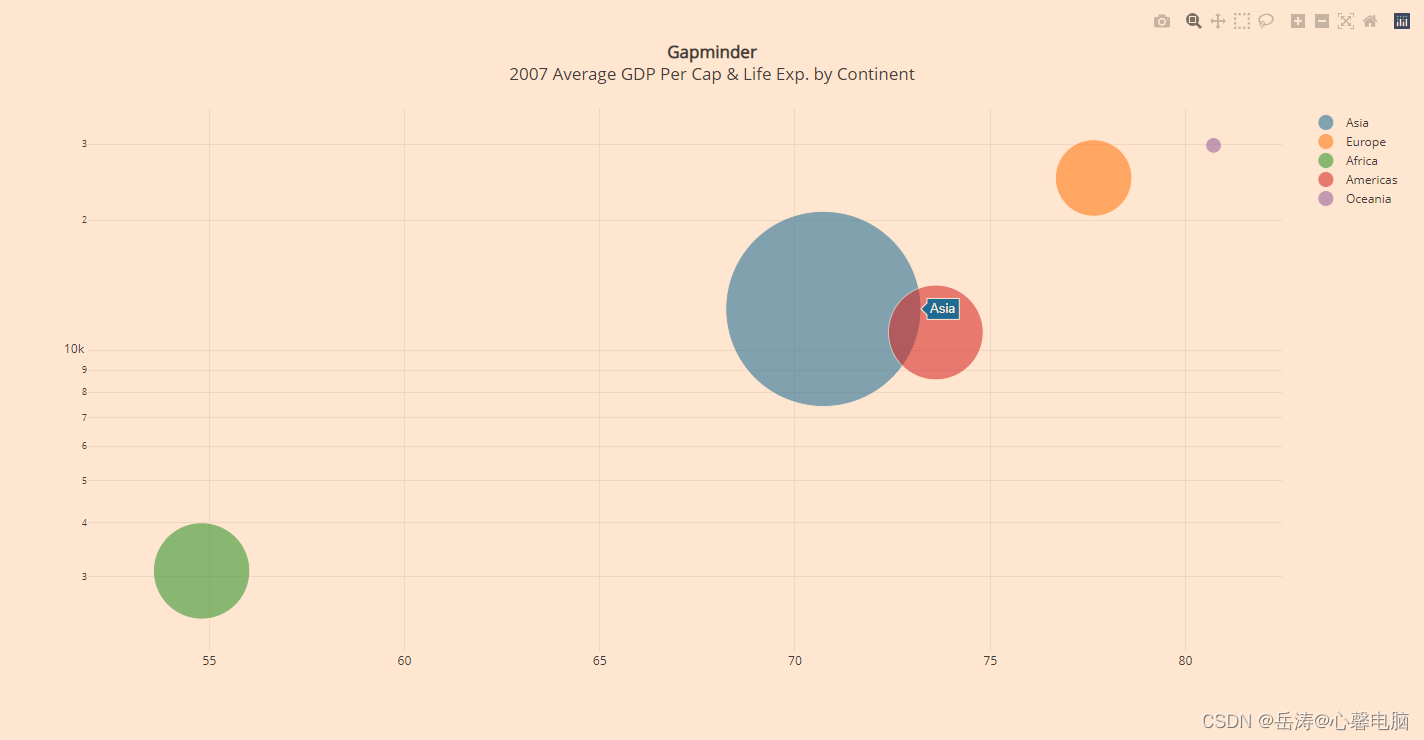
layout = dict(
    title = '<b>Gapminder</b><br>2007 Average GDP Per Cap & Life Exp. by Continent',
    yaxis = dict(
        type = 'log'
    )
)

fig_dict = dict(data=data, layout=layout)
pio.show(fig_dict, validate=False)
4.4 Dash中的应用
import plotly.graph_objects as go # or plotly.express as px
fig = go.Figure() # or any Plotly Express function e.g. px.bar(...)
# fig.add_trace( ... )
# fig.update_layout( ... )

import dash
import dash_core_components as dcc
import dash_html_components as html

app = dash.Dash()
app.layout = html.Div([
    dcc.Graph(figure=fig)
])

app.run_server(debug=True, use_reloader=False)  # Turn off reloader if inside Jupyter

