神经网络模型结构和参数可视化
- 一、前言
- 二、Netron
- 2.1Netron简介
- 2.2TensorFlow、Keras、Caffe模型文件实测结果
- 2.3PyTorch、scikit-learn模型文件实测结果
- 三、NN-SVG
- 四、Netscope
- 五、PlotNeuralNet
- 六、Graphviz
- 七、总结
- 参考文档
一、前言
在神经网络的某些应用场景中,需要将设计的网络模型结构绘制出来进行展示,或需要查看训练完成后的模型权重、偏置等参数,而由于使用训练架构的不同某些架构不提供模型可视化功能,这时就需要寻找一些工具达到可视化的目的。
这些工具大体上可分为两种,
(1)能够读取已训练好的神经网络模型,加载模型后会自动显示出模型结构、参数等信息;
(2)无法读取模型文件,需要额外提供如网络结构、权重数值等参数才能绘制出相应的模型结构,显然此种只能用于绘制结构而无法查看模型参数。
二、Netron
2.1Netron简介
Netron属于第一种能够直接读取模型文件的可视化工具,工具提供网页版和客户端版,支持Linux和Windows,网页版地址为https://netron.app/,客户端版地址为https://github.com/lutzroeder/netron/releases,目前最新版为7.6.8。
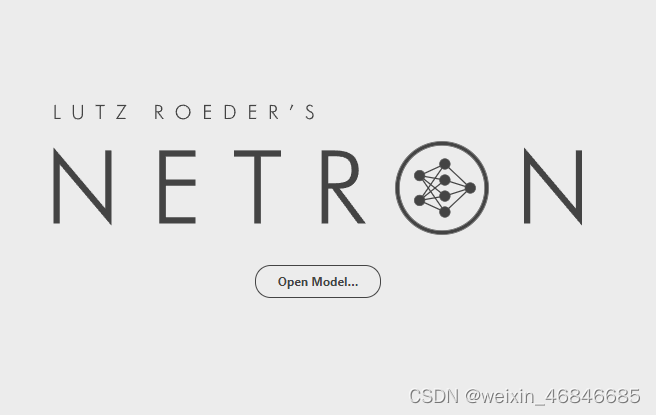
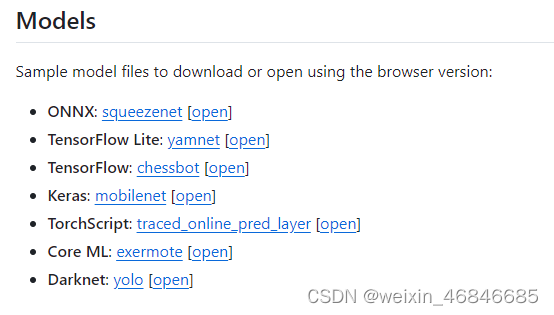
源码地址为https://github.com/lutzroeder/netron,经页面介绍可知,Netron支持大部分训练架构导出的模型格式,包括以下几种:
2.2TensorFlow、Keras、Caffe模型文件实测结果
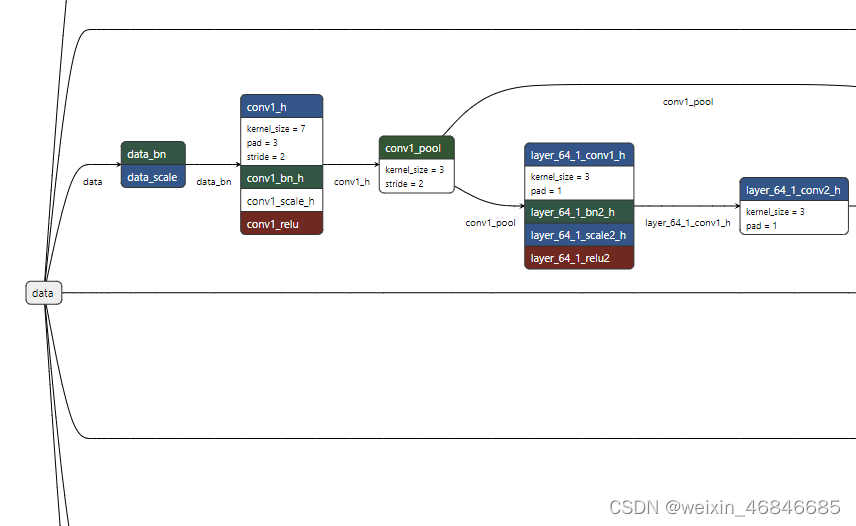
经过实际测试,Netron可以正常显示TensorFlow、Keras、Caffe模型结构和参数,模型图如下:
TensorFlow模型文件:

Keras模型文件:

Caffe模型文件:
2.3PyTorch、scikit-learn模型文件实测结果
打开PyTorch模型文件,可以查看参数,但结构信息无法完全显示,模型图如下:

打开scikit-learn模型文件,可以查看参数,但是不显示结构信息,模型图如下:
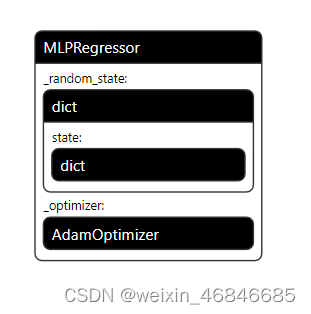
综合来看,Netron功能强大,支持查看大多数类型的模型文件参数,但在模型结构可视化上还存在些不足。
三、NN-SVG
NN-SVG属于第二种工具,无法加载模型文件,只能通过设置一些参数实现模型结构的绘制。NN-SVG只有网页版,地址为https://alexlenail.me/NN-SVG/,没有客户端版。源码地址为https://github.com/alexlenail/NN-SVG。
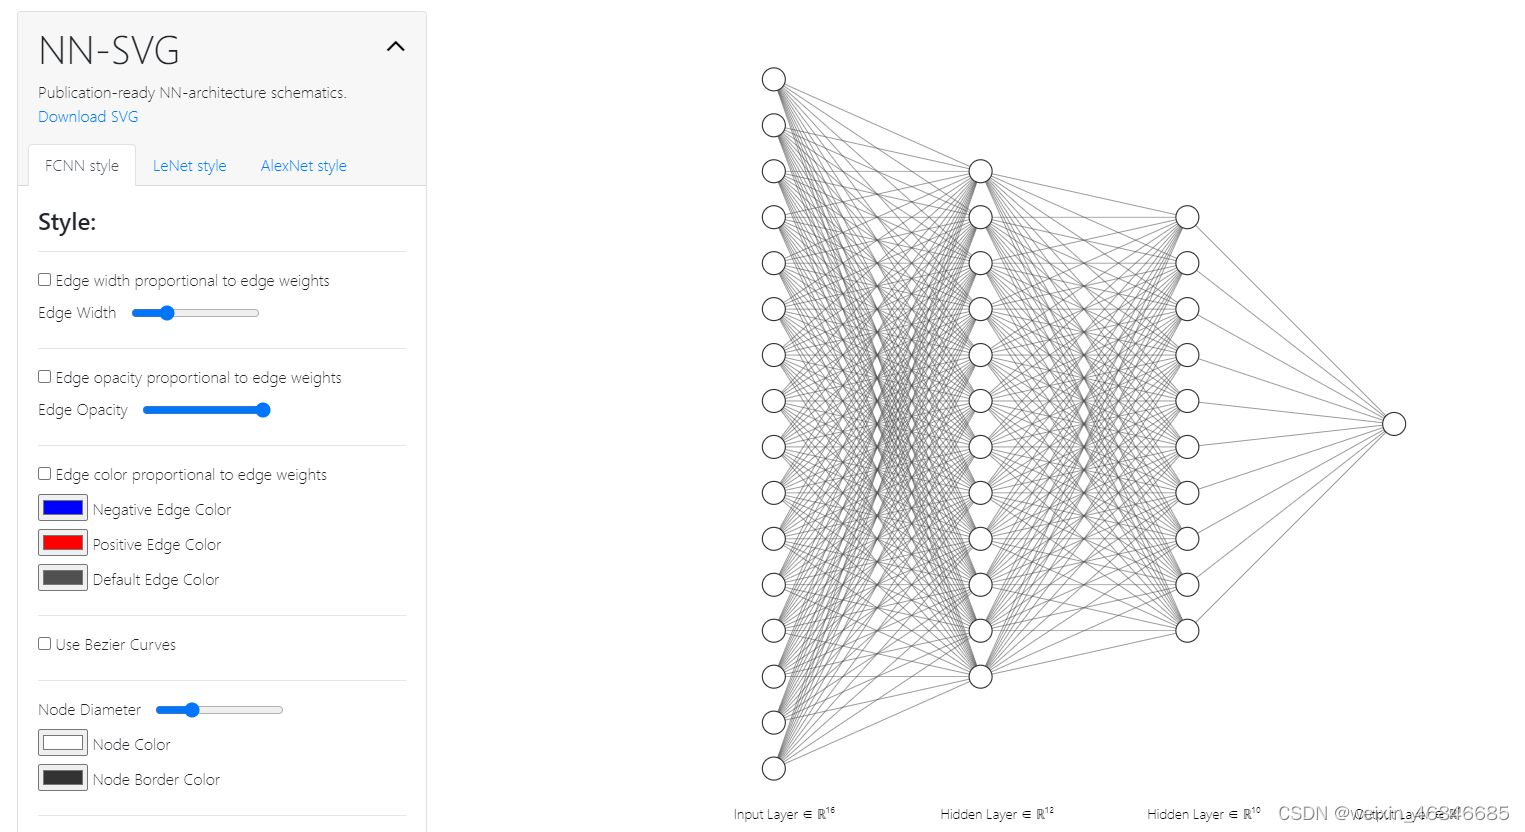
NN-SVG支持绘制FCNN、LeNet、AlexNet三种模型结构,结构参数通过界面而非代码设置,较其他同类工具操作更为便捷。
四、Netscope
Netscope与NN-SVG类似,同属第二种工具,但不同的是网络结构由代码进行定义,所以支持多种网络结构。Netscope通过网页提供服务,可以在线使用,也可以下载源代码后本地部署网络服务使用,在线版地址为:https://dgschwend.github.io/netscope/quickstart.html,源代码地址为:https://github.com/cwlacewe/netscope。
进入在线版网页后,点击Launch Editor,在左上方输入代码。
绘制全连接神经网络结构代码如下:
name: "FCNN"

layer {
  name: "input"
  type: "Input"
  top: "data"
  input_param { shape: { dim: 1 dim: 3 dim: 1 dim: 1} }
}

layer {
  name: "fc1"
  type: "InnerProduct"
  bottom: "data"
  top: "fc1"
  inner_product_param { num_output: 10 }
}

layer {
  name: "relu1"
  type: "ReLU"
  bottom: "fc1"
  top: "fc1"
}

layer {
  name: "fc2"
  type: "InnerProduct"
  bottom: "fc1"
  top: "fc2"
  inner_product_param { num_output: 15 }
}

layer {
  name: "relu2"
  type: "ReLU"
  bottom: "fc2"
  top: "fc2"
}

layer {
  name: "fc3"
  type: "InnerProduct"
  bottom: "fc2"
  top: "fc3"
  inner_product_param { num_output: 5 }
}

layer {
  name: "softmax"
  type: "Softmax"
  bottom: "fc3"
  top: "softmax"
}
全连接神经网络结构图如下:
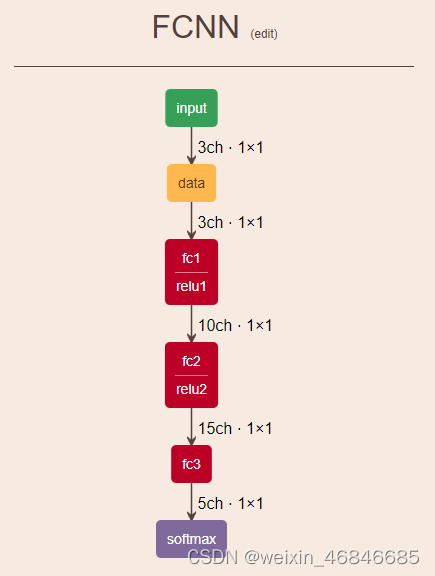
Netscope还会给出关于网络模型的分析,如下图:

Netscope由于使用代码定义模型结构,所以能够描绘的网络模型种类多于NN-SVG,信息也更为详细,但采用简易的二维模块框进行模型结构绘制,美观度上似乎略低于NN-SVG。
五、PlotNeuralNet
PlotNeuralNet,属于第二种工具,工作原理为通过python代码生成LaTeX文档,再由MikTeX软件对文档进行解析生成PDF格式的模型结构图。
PlotNeuralNet源代码地址为:https://github.com/HarisIqbal88/PlotNeuralNet,
MikTeX软件地址为:https://miktex.org/download。
使用时先将源代码下载到本地,然后参照给出的示例编写模型结构定义代码,运行代码生成LaTeX文档,使用MikTeX软件解析文档生成模型结构图。
下面为绘制LeNet模型的代码:
import sys
sys.path.append('../')
from pycore.tikzeng import *

def to_FullyConnected(name, s_filer, offset="(0,0,0)", to="(0,0,0)", width=1, height=1, depth=1, caption=" "):
    return to_Conv(name, s_filer, s_filer, offset, to, width, height, depth, caption)

# Define the architecture
arch = [
    to_head('..'),
    to_cor(),
    to_begin(),

    # Input layer
    to_input("../examples/fcn8s/cats.jpg", width=6, height=6, name="input"),

    # Convolutional Layer 1
    to_Conv(name='conv1', s_filer=28, n_filer=6, offset="(0,0,0)", to="(0,0,0)", width=2, height=28, depth=28, caption="Conv1"),
    to_Pool(name="pool1", offset="(0,0,0)", to="(conv1-east)", width=1, height=14, depth=14, caption="Pool1"),

    # Convolutional Layer 2
    to_Conv(name='conv2', s_filer=10, n_filer=16, offset="(2,0,0)", to="(pool1-east)", width=3, height=10, depth=10, caption="Conv2"),
    to_Pool(name="pool2", offset="(0,0,0)", to="(conv2-east)", width=1, height=5, depth=5, caption="Pool2"),

    # Fully Connected Layers
    to_FullyConnected(name="fc1", s_filer=120, offset="(2,0,0)", to="(pool2-east)", width=1, height=5, depth=5, caption="FC1"),
    to_FullyConnected(name="fc2", s_filer=84, offset="(1.5,0,0)", to="(fc1-east)", width=1, height=4, depth=4, caption="FC2"),

    # Output Layer
    to_SoftMax(name="output", s_filer=10, offset="(2,0,0)", to="(fc2-east)", width=1, height=3, depth=3, caption="Output"),

    # Connections
    to_connection("conv1", "pool1"),
    to_connection("pool1", "conv2"),
    to_connection("conv2", "pool2"),
    to_connection("pool2", "fc1"),
    to_connection("fc1", "fc2"),
    to_connection("fc2", "output"),

    to_end()
]

def main():
    namefile = str(sys.argv[0]).split('.')[0]
    to_generate(arch, namefile + '.tex')

if __name__ == '__main__':
    main()
下图为LeNet模型图:

下图为NN-SVG生成的LeNet模型图:
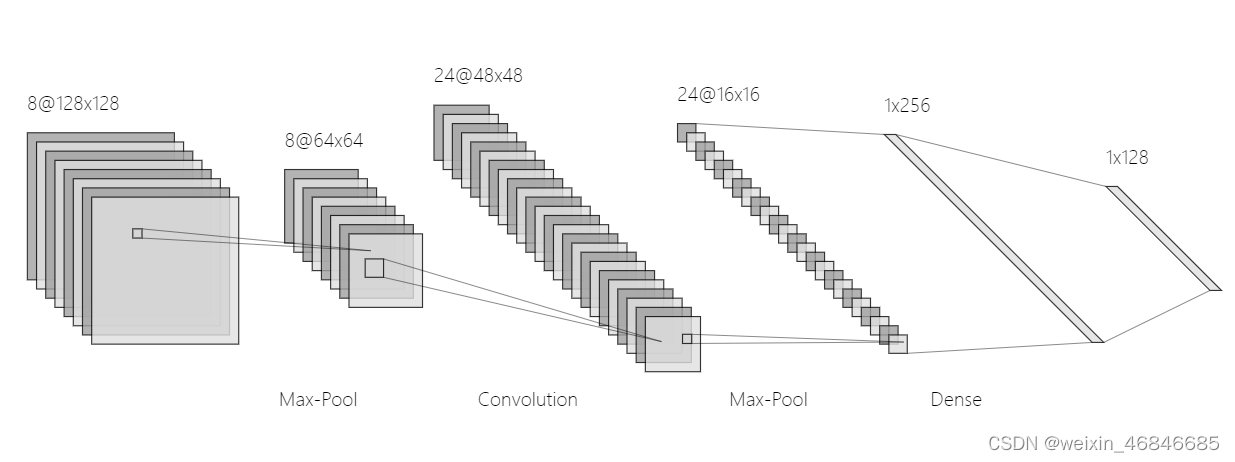
与NN-SVG相比,PlotNeuralNet生成的图片为三维立体,颜色更为鲜艳,但使用代码进行模型结构定义,操作上不如NN-SVG直观,且无法绘制全连接型神经网络。
六、Graphviz
Graphviz (Graph Visualization Software) 是一个由AT&T实验室启动的开源工具包,使用dot语言描述图形结构,可以绘制有向图、无向图、流程图、组织结构图等图形。本文基于python使用graphviz工具包,Graphviz官网地址为:https://graphviz.org/,python-graphviz库源代码地址为:https://github.com/xflr6/graphviz。
使用方法如下:
首先使用pip命令安装graphviz库:
pip install graphviz
然后从Graphviz官网下载graphviz包,下载地址为https://graphviz.org/download/,本文下载的版本为Windows——graphviz-11.0.0 (64-bit) ZIP archive [sha256] (contains all tools and libraries)。下载后解压,然后将“解压路径/Graphviz-11.0.0-win64/bin”添加至环境变量中的path变量。
执行完上面两步,就可以编写python代码定义模型结构。
下面是绘制全连接神经网络的代码:
from graphviz import Digraph
def draw_FCNN():
    # 创建有向图对象
    dot = Digraph(engine='neato')

    # 定义神经网络层及其节点
    input_nodes = ['x1', 'x2', 'x3']
    hidden_nodes = ['h1', 'h2']
    output_nodes = ['o1']

    # 设置节点的位置
    input_positions = {'x1': '0,4!', 'x2': '0,2!', 'x3': '0,0!'}
    hidden_positions = {'h1': '2,3!', 'h2': '2,1!'}
    output_position = {'o1': '4,2!'}

    # 定义权重和阈值(示例)
    weights = {
        ('x1', 'h1'): 0.2, ('x1', 'h2'): 0.4,
        ('x2', 'h1'): 0.3, ('x2', 'h2'): 0.5,
        ('x3', 'h1'): 0.1, ('x3', 'h2'): 0.2,
        ('h1', 'o1'): 0.6, ('h2', 'o1'): 0.7
    }

    biases = {
        'h1': 0.1, 'h2': 0.2, 'o1': 0.3
    }

    # 添加节点并设置位置和标签
    for node, pos in input_positions.items():
        dot.node(node, label=node, shape='circle', width='1.0', style='filled', fillcolor='lightblue', pos=pos)

    for node, pos in hidden_positions.items():
        label = f'{node}\n(b={biases[node]})'
        dot.node(node, label=label, shape='circle', width='1.0', style='filled', fillcolor='lightgreen', pos=pos)

    for node, pos in output_position.items():
        label = f'{node}\n(b={biases[node]})'
        dot.node(node, label=label, shape='circle', width='1.0', style='filled', fillcolor='lightcoral', pos=pos)

    # 添加边及其权重
    for (start, end), weight in weights.items():
        dot.edge(start, end, label=f'w={weight}')

    # 渲染图表
    dot.render('simple_nn_pos', format='png', view=True)

draw_FCNN()
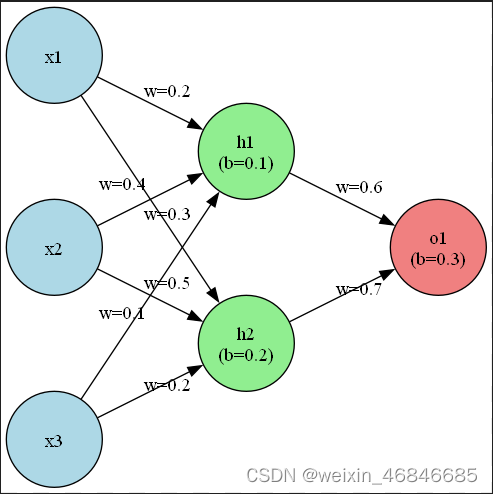
下图为绘制的全连接神经网络结构图:
下面是绘制LeNet网络结构的代码:
from graphviz import Digraph
def draw_LeNet():
    # 创建一个有向图对象
    dot = Digraph()
    dot.attr(rankdir='LR')
    dot.attr('node', shape='box3d', style='filled', fillcolor='lightblue', fontname='Helvetica')
    dot.attr('edge', arrowhead='vee', color='blue')

    # 添加节点
    dot.node('I', 'Input Layer\n(28x28x1)')
    dot.node('C1', 'Conv Layer 1\n(24x24x6)\n5x5 kernels')
    dot.node('P1', 'Pool Layer 1\n(12x12x6)\n2x2 avg pool')
    dot.node('C2', 'Conv Layer 2\n(8x8x16)\n5x5 kernels')
    dot.node('P2', 'Pool Layer 2\n(4x4x16)\n2x2 avg pool')
    dot.node('F1', 'Fully Connected Layer 1\n(120)')
    dot.node('F2', 'Fully Connected Layer 2\n(84)')
    dot.node('O', 'Output Layer\n(10)')

    # 添加边
    dot.edge('I', 'C1')
    dot.edge('C1', 'P1')
    dot.edge('P1', 'C2')
    dot.edge('C2', 'P2')
    dot.edge('P2', 'F1')
    dot.edge('F1', 'F2')
    dot.edge('F2', 'O')

    # 保存并渲染图表,同时删除中间文件
    dot.render('lenet_structure', format='png', view=True, cleanup=True)

draw_LeNet()
下图为LeNet网络结构图:

graphviz的参数释义可参照官网介绍,官网上内容较为详细,其中比较重要的一些参数如下:
1、布局引擎的指定
graphviz默认引擎为dot,在默认引擎下,会自动调整节点间距、连接线形状等参数,使用控制间距的nodesep参数起到的作用有限,当节点较多时可能会引起布局混乱。
可通过如下代码指定引擎为neato,在该引擎下可以进行节点精确定位
dot = Digraph(engine='neato')
2、pos
该参数用于指定节点的位置,但在默认引擎下不会起作用,要使该参数生效,可指定引擎为neato,此时单位为英寸。另外,如果pos设置后整体布局四周出现留白,那么引擎会自动消除留白使空间布局更加合理。
3、width、height
这两个参数指定节点的高度和宽度,单位为英寸。如果设置的过小,那么节点可能会显示为实际大小而非设置的大小。
4、dpi
该参数在graphviz中是指每英寸多少个像素,所以dpi设置的越大,得到的图像更清晰。
下面代码就是设置dpi为600。
dot.attr(dpi='600')
5、size
该参数是设置生成的图像的宽度和高度,单位为英寸。当图像的实际大小小于该参数时会按照实际大小保存,大于该参数时则会被缩放。
下面代码就是设置图像宽度为10英寸,高度为20英寸。
dot.attr(size='10,20')
对于绘制的全连接型神经网络,graphviz绘制的网络外观上优于NN-SVG,而且可以显示权重、偏置阈值,这个优点很突出。
对于绘制的LeNet模型,美观程度与NN-SVG各有优劣,但是略低于PlotNeuralNet。
七、总结
综合上述几种神经网络模型结构可视化工具的实际测试,汇总如下:
| 应用场景 | 适合工具 |
|---|---|
| 查看模型内部参数 | Netron |
| 绘制全连接神经网络——要求显示权重等参数 | Graphviz |
| 绘制全连接神经网络——美观优先 | Graphviz>NN-SVG |
| 绘制全连接神经网络——速度优先 | NN-SVG>Graphviz |
| 绘制其他神经网络——美观优先 | PlotNeuralNet>NN-SVG>Graphviz>Netron>Netscope |
| 绘制其他神经网络——速度优先 | NN-SVG>Netron>Netscope>Graphviz>PlotNeuralNet |
参考文档
神经网络可视化(一)——Netron
一图抵千言 | 神经网络绘图篇!涵盖NN-SVG、PlotNeuralNet、Netron等软件!
PlotNeuralNet简单教程
如何画出漂亮的神经网络图?
![[STM32-HAL库]AS608-指纹识别模块-STM32CUBEMX开发-HAL库开发系列-主控STM32F103C8T6](https://img-blog.csdnimg.cn/direct/14275104e38145d3884a69fc6c51f07c.png)




![[实例] Unity Shader 逐像素漫反射与半兰伯特光照](https://img-blog.csdnimg.cn/direct/0098a63f439043e5b5920a77726734df.gif)

