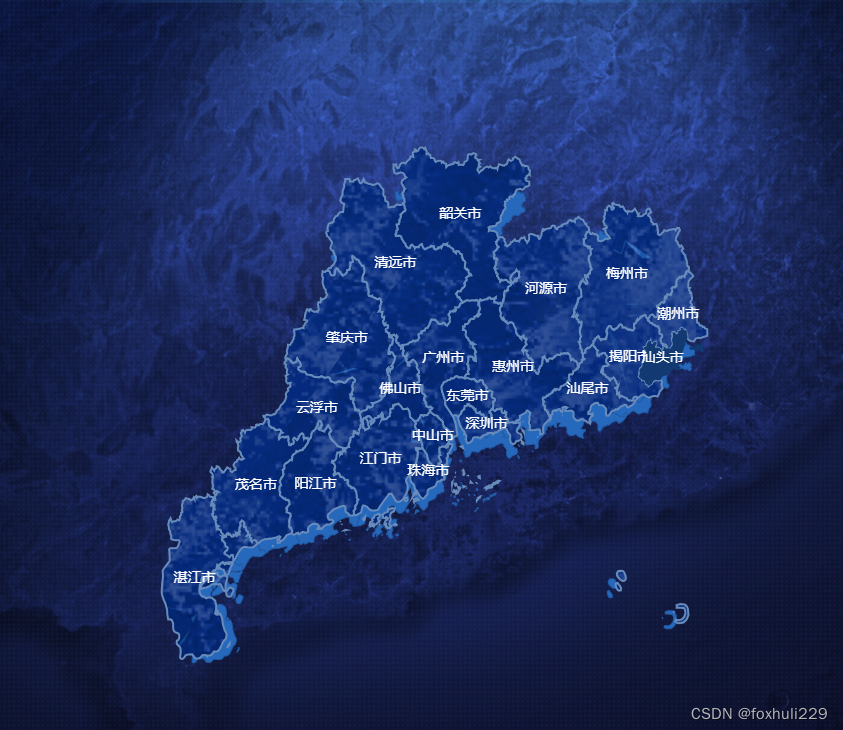
给map地图添加了一个阴影3d的效果,添加一张背景图,给人感觉有3d的效果
具体配置如下:
html代码模块:
 <div class="echart_img" style="position: fixed; visibility: hidden;"></div>
 <div id="map"></div>
在mounted方法里面给地图添加背景图
 mounted() {
    let mg = require("../../../../images/jsc/map.png")
    this.domImg = document.createElement('img')
    this.domImg.style.height = this.domImg.height = this.domImg.width = this.domImg.style.width = '7000px'
    this.domImg.src = mg
    document.querySelector('.main-map .echart_img').appendChild(this.domImg)
    setTimeout(() => {
      this.initMap();
    }, 500)
  },
echarts options配置如下:
var chart = this.echarts.init(document.getElementById("map"));
      var option = {
        grid: {
          top: '-20%',
          left: '0%'
        },
        geo: [
          {
            map: 'GD',
            aspectScale: 0.75,
            zoom: 0.65, // 比例调整
            layoutCenter: ['50%', '52%'],
            layoutSize: '100%',
            silent: true,
            roam: false,
            itemStyle: {
              normal: {
                areaColor: 'rgb(37, 104, 188)',
                borderColor: 'rgb(33, 91, 167)',
                borderWidth: 1
              },
              emphasis: {
                areaColor: '#2AB8FF',
                borderWidth: 0,
                color: 'green',
                label: {
                  show: false
                }
              }
            },
          }
        ],
        series: [
          {
            type: "map",
            map: "GD",
            roam: false, //是否开启鼠标缩放和平移漫游
            animationDurationUpdate: 0,
            zoom: 0.8,
            layoutSize: "100",
            label: {
              normal: {
                show: true,
                fontSize: 14,
                color: "#fff",
              },
              emphasis: {
                color: "#fff",
              },
            },
            itemStyle: {
              normal: {
                areaColor: {
                  image: this.domImg,
                  repeat: "repeat-x"
                },
                borderColor: "#678BBB", //省份边框颜色
                borderWidth: 2, // 省份边框宽度
                shadowBlur: 0,
                shadowOffsetX: 0,
                shadowOffsetY: 0
              },
              emphasis: {
                areaColor: {
                  type: 'linear',
                  x: 0,
                  y: 0,
                  x2: 0,
                  y2: 1,
                  colorStops: [{
                    offset: 0, color: 'rgba(45, 124, 200, 1)' // 渐变起始颜色
                  }, {
                    offset: 1, color: 'rgba(75, 175, 247, 1)' // 渐变结束颜色
                  }]
                },
                borderColor: "#fff", //省份边框颜色
                borderWidth: 1, // 高亮时的边框宽度
              },
            },
            select: {
              label: {
                show: true,
                color: "#fff",
              },
              itemStyle: {
                areaColor: "#123972", // 高亮时候地图显示的颜色
                borderWidth: 0, // 高亮时的边框宽度
              },
            },
          },
        ],
      };

      // 使用刚指定的配置项和数据显示图表
      chart.setOption(option);
具体效果如下:
