1、安装依赖
echarts-gl 与 echarts 版本关系:
"echarts": "^5.2.0", "echarts-gl": "^2.0.8"
# 执行安装
yarn add echarts-gl
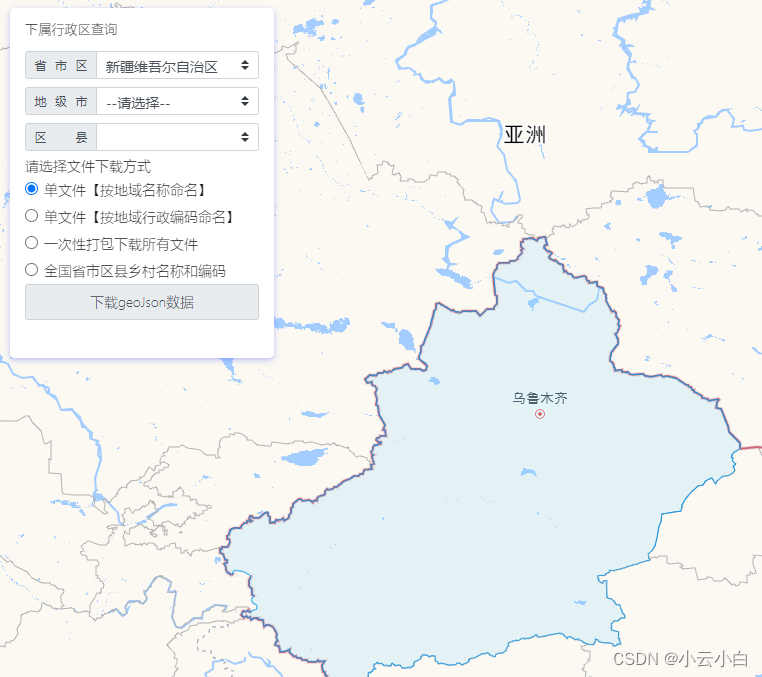
2、下载离线地图
免费下载实时更新的geoJson数据、行政区划边界数据、区划边界坐标集合__HashTang
https://hxkj.vip/demo/echartsMap/
这里下载的新疆,选项的第一个和第二个都行
3、编写页面页面
参考:
vue组件,echarts制作3D地图,可点击凸起,hover高亮,可做飞鱼线(带天空盒子)
https://blog.csdn.net/qq_45234022/article/details/134439469
下载地图重名成 xinjiang.json,粘贴vue项目的 api/json/xinjiang.json 下
新建 aa.vue,访问即可看见效果
<template>
	<div ref="myChartRef" class="top-title3">地图</div>
</template>
<script name="RoomForm" setup>
	import * as echarts from 'echarts'
	import 'echarts-gl' // 引入 3D效果
	import xinjiangGjson from '@/api/json/xinjiang.json' // 引入地图json数据

	// 获取vue3 的 proxy (同 vue2的 this)
	const { proxy } = getCurrentInstance()

	// 初始化ECharts实例
	const myChart1 = ref()

	const getOption = () => {
		return {
			tooltip: {
				// 自定义代码
			},
			series: [
				{
					type: 'map3D',
					name: '地图',
					// 相对于父容器比例
					center: ['50%', '50%'],
					selectedMode: 'single', // 地图高亮单选
					regionHeight: 3, // 地图高度
					map: 'xinjiangMap',
					viewControl: {
						// 缩放大小,数值越大,地图越小
						distance: 90,
						// 上下倾斜角度
						alpha: 30,
						// rotateSensitivity: [1, 1],
						// 左右倾斜角度
						beta: 5
					},
					label: {
						show: true, // 是否显示名字
						color: '#fff', // 文字颜色
						fontSize: 18, // 文字大小
						fontWeight: 'normal', // 文字大小
						formatter: function (params) {
							return `●`
						}
					},
					itemStyle: {
						color: '#176efa', // 地图背景颜色
						borderWidth: 2, // 分界线wdith
						borderColor: '#6254cc', // 分界线颜色
						opacity: 1
					},
					emphasis: {
						label: {
							show: true, // 是否显示高亮
							textStyle: {
								color: '#fff' // 高亮文字颜色
							}
						},
						itemStyle: {
							color: '#77da7d', // 地图高亮颜色
							borderWidth: 10, // 分界线wdith
							borderColor: '#6BECF5' // 分界线颜色
						}
					},
					shading: 'realistic',
					// 真实感材质相关配置 shading: 'realistic'时有效
					realisticMaterial: {
						detailTexture: 'https://cdn.polyhaven.com/asset_img/primary/kloppenheim_06_puresky.png?height=780', // 纹理贴图
						textureTiling: 1, // 纹理平铺,1是拉伸,数字表示纹理平铺次数
						roughness: 1, // 材质粗糙度,0完全光滑,1完全粗糙
						metalness: 0, // 0材质是非金属 ,1金属
						roughnessAdjust: 0
					},
					light: {
						main: {
							color: '#fff',
							intensity: 1,
							shadow: true,
							shadowQuality: 'high',
							alpha: 25, //
							beta: 20
						},
						ambient: {
							color: '#fff',
							intensity: 0.6
						}
					}
				}
			]
		}
	}
	onMounted(() => {
		myChart1.value = markRaw(echarts.init(proxy.$refs['myChartRef']))
		echarts.registerMap('xinjiangMap', xinjiangGjson) // 注册地图
		// 使用刚指定的配置项和数据显示图表
		myChart1.value.setOption(getOption())
	})
</script>
<style lang="scss" scoped>
	.top-title3 {
		margin-top: -100px;
		width: 900px;
		height: 500px;
	}
</style>
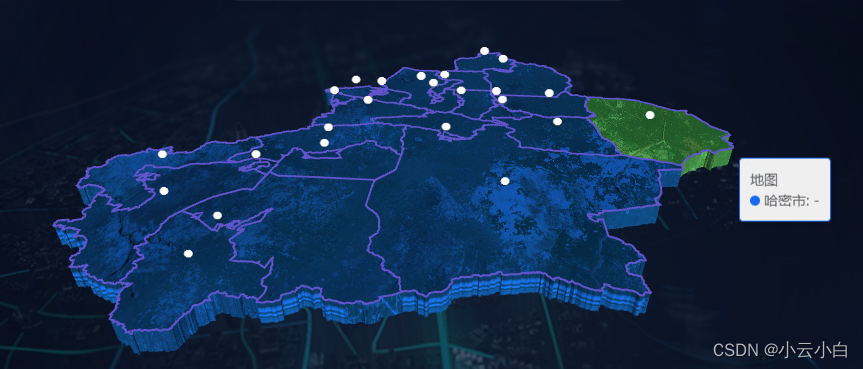
4 预览效果如图
