文章目录
- 不一样的长方体
- 1. 实现效果预览
- 2.实现思路
- 2.1效果难点
- 2.2 实现思路
- 3.实现
- 3.1 测试数据编写
- 3.2 编写canvas绘制函数
不一样的长方体
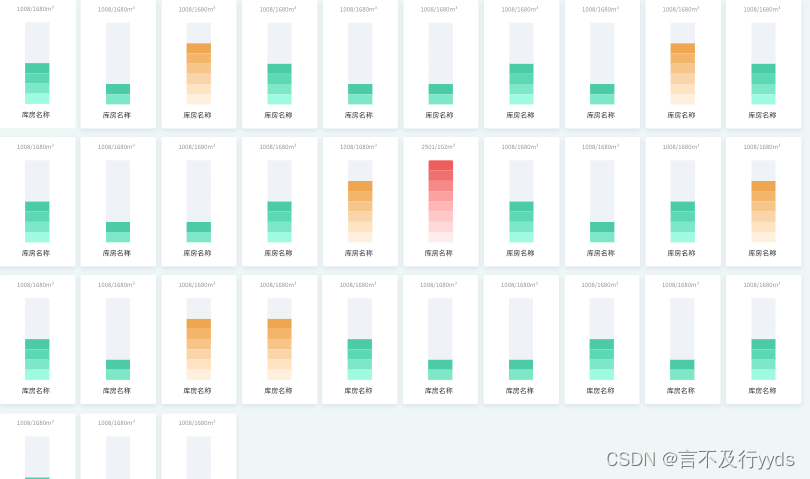
1. 实现效果预览
俗话说的好,没有实现不了的页面效果,只有禁锢的思想,
这不ui又给整了个新奇的页面效果,
2.实现思路
2.1效果难点
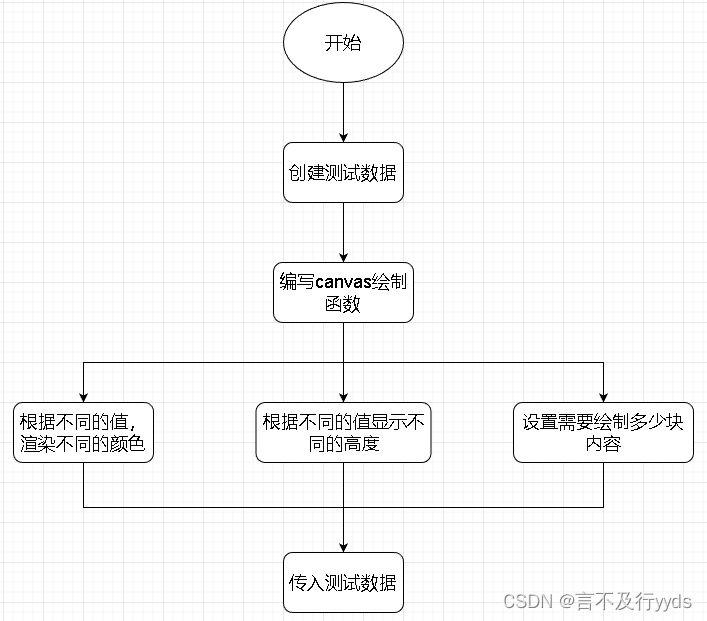
- 根据不同的数据展示不同的颜色,而且需要渐变并有块状效果。
- 绘制多个单独的区域
2.2 实现思路
3.实现
3.1 测试数据编写
testData1:[
{ name:“库房1”, now:888, extends:1800 },
{ name:“库房2”, now:988, extends:1700 },
{ name:“库房3”, now:488, extends:2200 },
{ name:“库房4”, now:1888, extends:800 },
{ name:“库房5”, now:1088, extends:1600 },
{ name:“库房6”, now:1388, extends:1300 },
{ name:“库房7”, now:288, extends:2400 },
{ name:“库房8”, now:888, extends:1800 },
{ name:“库房9”, now:888, extends:1800 },
{ name:“库房10”, now:1888, extends:800 },
{ name:“库房11”, now:1288, extends:1400 },
{ name:“库房12”, now:1488, extends:1200 },
{ name:“库房13”, now:1888, extends:800 },
{ name:“库房14”, now:188, extends:2500 },
{ name:“库房2”, now:988, extends:1700 },
{ name:“库房3”, now:488, extends:2200 },
{ name:“库房4”, now:1888, extends:800 },
{ name:“库房5”, now:1088, extends:1600 },
{ name:“库房13”, now:1888, extends:800 },
{ name:“库房14”, now:188, extends:2500 },
{ name:“库房3”, now:488, extends:2200 },
{ name:“库房4”, now:1888, extends:800 },
{ name:“库房5”, now:1088, extends:1600 },
],
3.2 编写canvas绘制函数
js部分
draw(i,item){
      canvas = document.getElementById(`myCanvas${i}`);
      const ctx = canvas.getContext('2d');

     // 定义矩形块的宽度和高度
 	const rectWidth = canvas.width;
    const rectHeight = canvas.height/8;

    // 定义矩形块之间的间距
    const rectSpacing = 0.25 ;

    // 定义要绘制的行数和列数
    //其中2688代表测试数据中的now+extends的总和,
    //可根据具体情况自己调整
     const numRows = Math.ceil(item.now*10/2688);
     const numCols = 1;

     let color=[]
     if(Math.ceil(item.now*10/2688) >= 7){
           color[0]='#EE5E5D'
           color[1]='#FFECEC'
      }else if(Math.ceil(item.now*10/2688) >= 4){
           color[0]='#EEA750'
           color[1]='#FFF0DD'
      }else{
           color[0]='#4BCBA6'
           color[1]='#9EFAE0'
       }
     // 绘制矩形块
     for (let row = 0; row < numRows; row++) {
          for (let col = 0; col < numCols; col++) {
                const x = col * (rectWidth + rectSpacing);
                const y = row * (rectHeight + rectSpacing);
                // 设置矩形块的颜色
                const grd = ctx.createLinearGradient(canvas.width/2, 0,canvas.width/2,canvas.height);
                grd.addColorStop(0, color[1]);
                grd.addColorStop(1,color[0]);
                // 用渐变填充
                ctx.fillStyle = grd;
				// 绘制矩形块
                ctx.fillRect(x, y, rectWidth, rectHeight);
                }
            }
        }
html部分
 <ul>
     <li v-for="item,index in testData1" :key="index">
         <p class="title">{{item.now}}/{{item.extends}}m³</p>
         <div class="show">
             <canvas :id="`myCanvas${index}`" class="canvas"></canvas>
         </div>
          <p class="storeName">{{item.name}}</p>
     </li>
 </ul>
scss部分
container{
    width:100%;
    height:100%;
    position:relative;
        ul{
            display:grid;
            margin-top:20px;
            margin-left:10px;
            width:97%;
            grid-template-columns: repeat(10,1fr);
            gap:10px;
            font-family: Source Han Sans-Regular, Source Han Sans;
            li{
                width:100%;
                aspect-ratio: 1 / 1.5;
                background: #FFFFFF;
                box-shadow: 0px 8px 14px 0px rgba(48,78,121,0.5);
                border-radius: 4px;
                position:relative;
                text-align: center;
                .title{
                    font-size: 14px;
                    font-weight: 400;
                    color: #929292;
                    margin-top:14px;
                }
                .show{
                   width:33%;
                   height:70%;
                   background: #EFF2F7;
                   margin:10px auto;
                   border-radius: 4px;
                   .canvas{
                        width:100%;
                        height:100%;
                        transform: rotate(180deg);
                   }
                }
            }
        }
}
