图像处理
- 13.创建主窗口与子图
- 13.1导入模块 加载图片
- 13.2创建窗口
- 13.3创建子图数组
- 14.定义png图像文件路径
- 15.提取指定帧图像
- 16.图像旋转
- 17.伽马值校正
- 18.检查图像对比度
- 19.强度缩放
- 20 . 绘制直方图
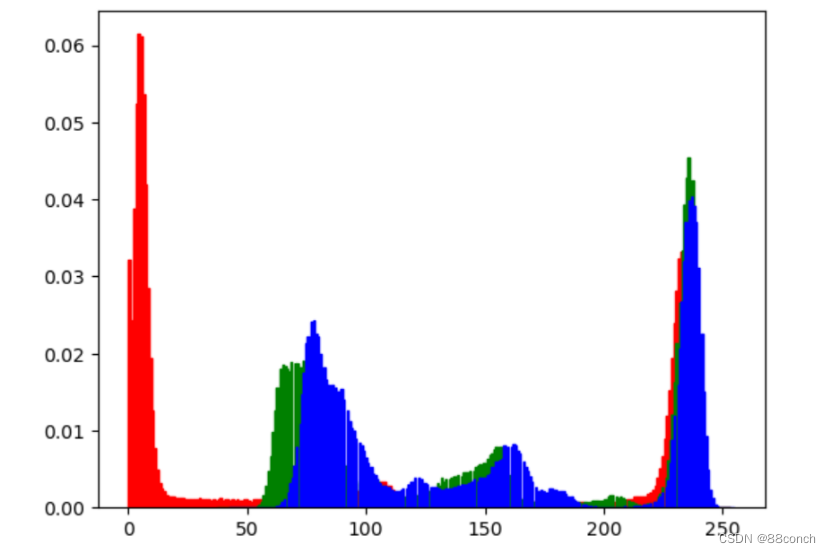
- 20.三通道彩色直方图
- 21.算子
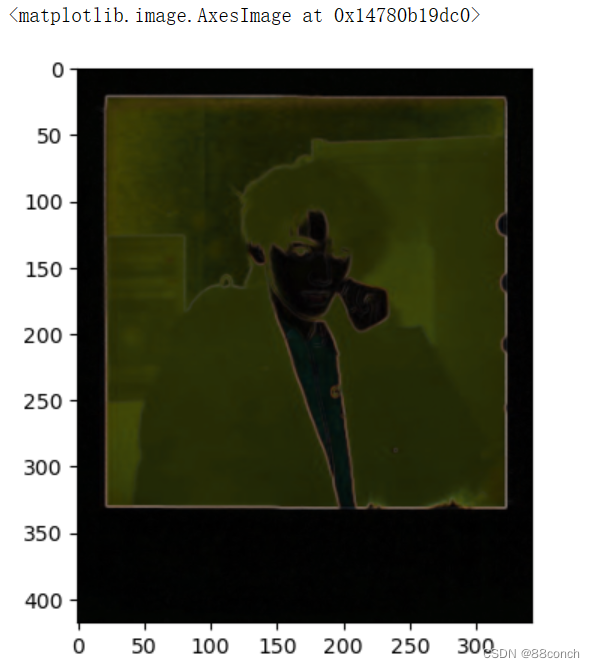
- 21.1Sobel
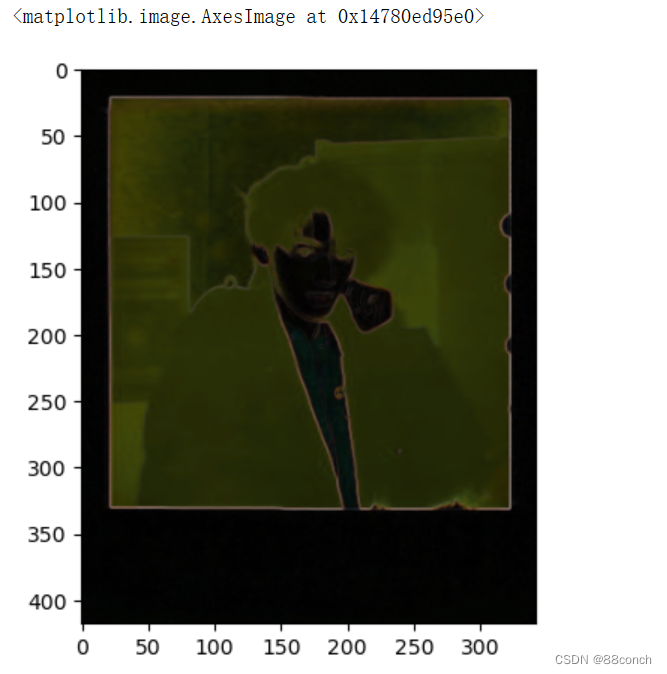
- 22.2 prewitt
- 22.滤波器
- 23.绘制图形
- 23.1画线
- 23.2画多边形
- 23.3画椭圆
- 23.4画空心圆
13.创建主窗口与子图
13.1导入模块 加载图片
import matplotlib.pyplot as plt
from skimage import io
import matplotlib.pyplot as plt
img = io.imread(r"C:\Users\song\Desktop\2.jpg")
13.2创建窗口
使用plt.figure函数创建astronaut的窗口,并设置窗口大小为(8,8)
plt.figure(num='astronaut',figsize=(8,8))
13.3创建子图数组
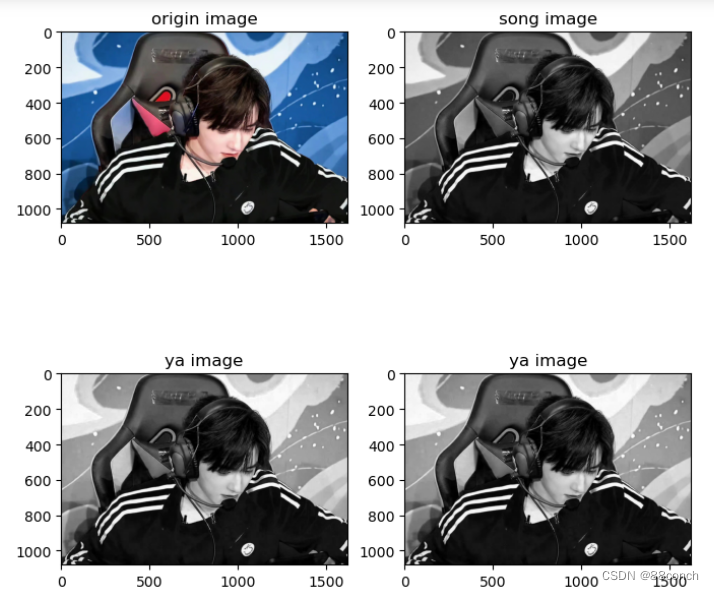
使用plt.subplot函数创建了四个2x2的子图数组,并依次在不同的子图中显示图像及其通道
plt.subplot(2,2,1)
plt.title('origin image') # 第一幅图片标题
plt.imshow(img) # 绘制第一幅图片

plt.subplot(2,2,2)
plt.title('song image') # 第二幅图片标题
plt.imshow(img[:,:,1],plt.cm.gray)


plt.subplot(2,2,3)
plt.title('ya image') # 第三幅图片标题
plt.imshow(img[:,:,2],plt.cm.gray)

plt.subplot(2,2,4)
plt.title('ya image') # 第四幅图片标题
plt.imshow(img[:,:,2],plt.cm.gray)
plt.show()
运行结果:
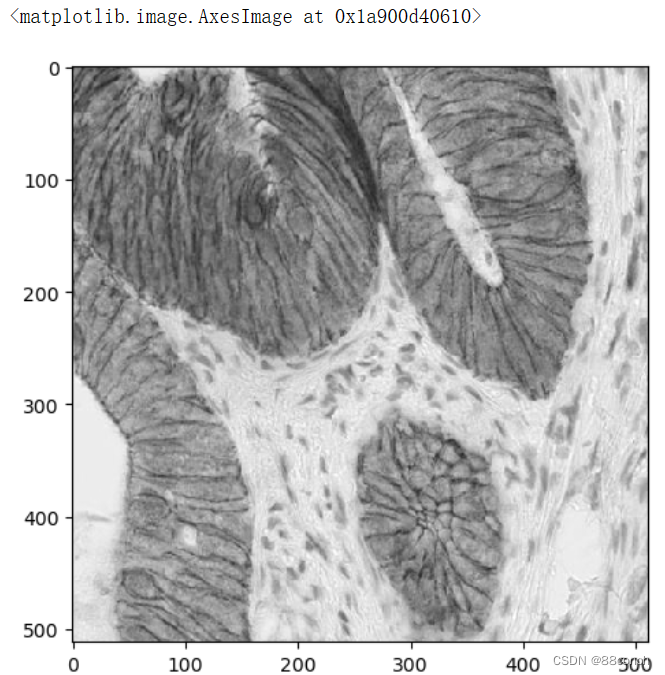
14.定义png图像文件路径
from skimage import data_dir,io,color

def convert_gray(f):
    rgb=io.imread(f)

    return color.rgb2gray(rgb)

str=data_dir+'/*.png'
coll = io.ImageCollection(str,load_func=convert_gray)
io.imshow(coll[14])
运行结果:
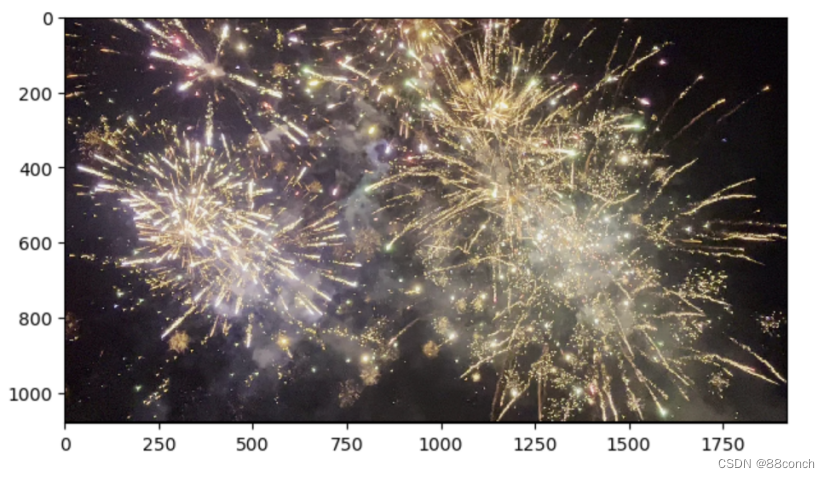
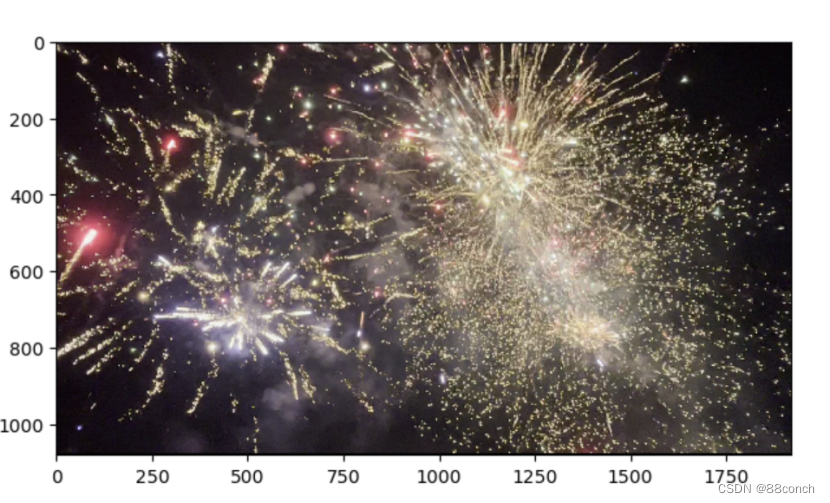
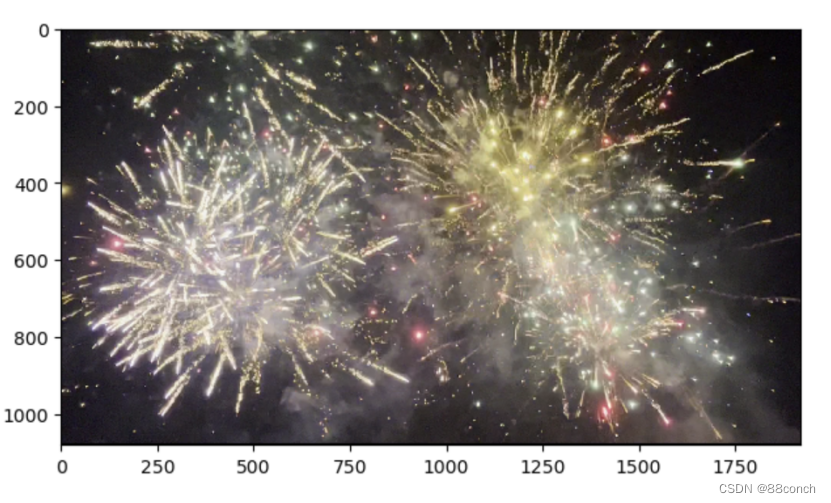
15.提取指定帧图像
import cv2
from skimage import io
import os

class AVILoader:
    def __init__(self, video_file):
        self.video_file = video_file
        self.cap = cv2.VideoCapture(self.video_file)

    def __call__(self, frame):
        self.cap.set(cv2.CAP_PROP_POS_FRAMES, frame)
        ret, frame = self.cap.read()
        if ret:
            return cv2.cvtColor(frame, cv2.COLOR_BGR2RGB)
        else:
            return None

video_file = r"E:\工坊\video\fireworks.mp4"
av_loader = AVILoader(video_file)

frames = range(0, 100, 20)
output_folder = 'frames'
os.makedirs(output_folder, exist_ok=True)

# 保存每一帧为图像文件
for frame in frames:
    img = av_loader(frame)
    if img is not None:
        filename = os.path.join(output_folder, f'frame_{frame}.jpg')
        io.imsave(filename, img)
        io.imshow(img)  # 显示图像
        io.show()       # 显示图像窗口

# 创建图像集合
ic = io.ImageCollection(os.path.join(output_folder, '*.jpg'))
运行结果:
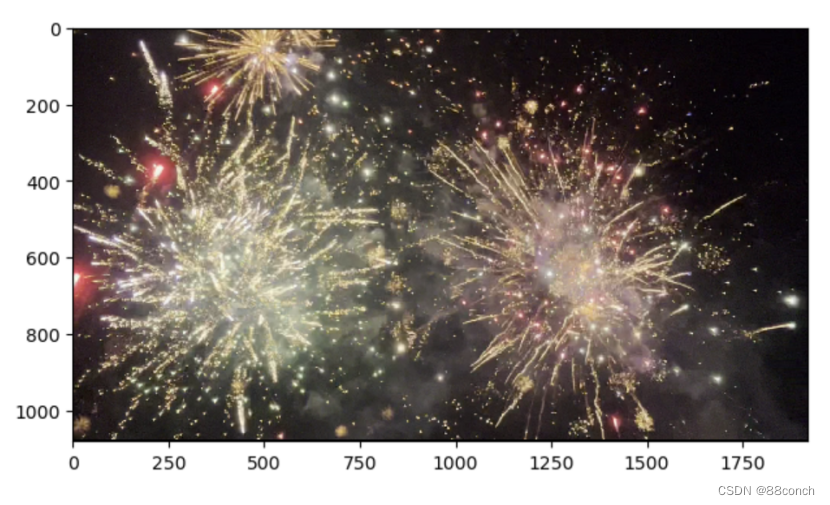
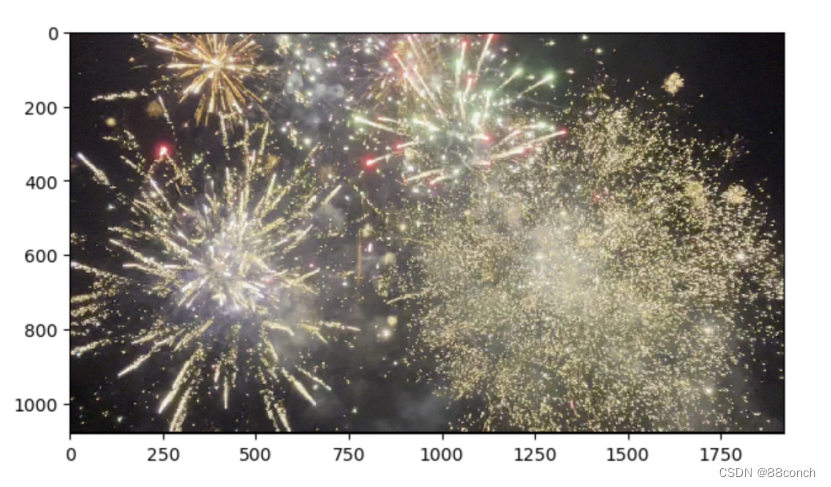
16.图像旋转
from skimage import data_dir,io,transform,color,data
import matplotlib.pylab as plt
import numpy as np

img=io.imread('122.jpg')
plt.figure(num='astronaut', figsize=(8, 8))
plt.subplot(2, 2, 1)
plt.title('origin image')
print(img.shape)
plt.imshow(img)

plt.figure(num='astronaut', figsize=(8, 8))
plt.subplot(2, 2, 2)
plt.title('image1 60')
pl = transform.rotate(img,60,resize=True)
print(pl.shape)
plt.imshow(pl)

plt.figure(num='astronaut', figsize=(8, 8))
plt.subplot(2, 2, 3)
plt.title('image2 30')
pl = transform.rotate(img,30,resize=True)
print(pl.shape)
plt.imshow(pl)

plt.figure(num='astronaut', figsize=(8, 8))
plt.subplot(2, 2, 4)
plt.title('image3 180')
pl = transform.rotate(img,180,resize=False)
print(pl.shape)
plt.imshow(pl)

plt.show()
运行结果:
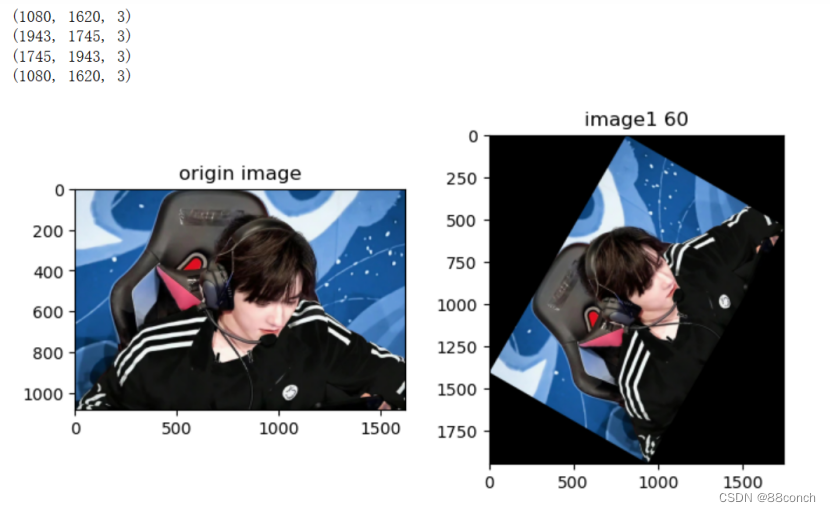
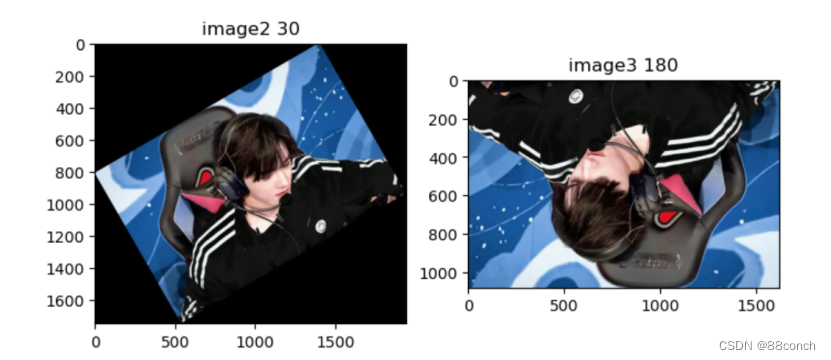
17.伽马值校正
from skimage import data,exposure,img_as_float
import matplotlib.pylab as plt
import numpy as np

img=io.imread('122.jpg')
gam1=exposure.adjust_gamma(img,1.4)
gam2=exposure.adjust_gamma(img,0.5)
gam3=exposure.adjust_gamma(img,0.2)
plt.figure(num='astronaut', figsize=(8, 8))
plt.subplot(1, 3, 1)
plt.title('gam1.4 image')
plt.imshow(gam1)

plt.figure(num='astronaut', figsize=(8, 8))
plt.subplot(1, 3, 2)
plt.title('gam0.5 image1')
plt.imshow(gam2)

plt.figure(num='astronaut', figsize=(8, 8))
plt.subplot(1, 3, 3)
plt.title('gam0.2 image1')
plt.imshow(gam3)
plt.show()
运行结果:

18.检查图像对比度
from skimage import exposure
img = io.imread(r"E:\工坊\photos\11.jpg")
result=exposure.is_low_contrast(img)
print(result)
运行结果:

19.强度缩放
import numpy as np
from skimage import exposure
image = np.array([51, 102, 153], dtype=np.uint8)
mat = exposure.rescale_intensity(image)

result=exposure.is_low_contrast(img)

print(result)
print(mat)
运行结果:

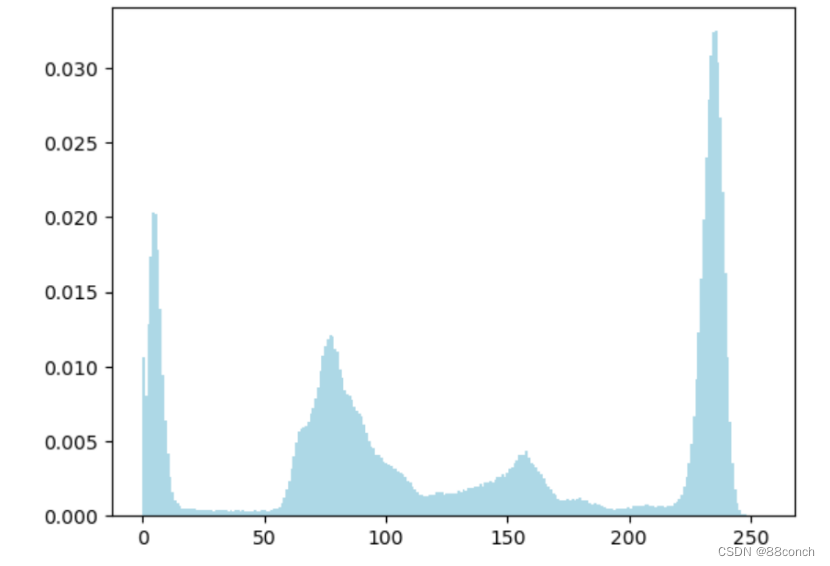
20 . 绘制直方图
import matplotlib.pyplot as plt
from skimage import io
img=io.imread(r"E:\工坊\photos\9.jpg")
plt.figure( "hist")
arr=img.flatten()
n, bins, patches = plt.hist(arr, bins=256, density=1, edgecolor='none', facecolor='lightblue')
plt.show()
运行结果:
20.三通道彩色直方图
from skimage import data
import matplotlib.pyplot as plt
img=io.imread(r"E:\工坊\photos\9.jpg")
ar=img[:,:,0].flatten()
plt.hist(ar, bins=256, density=True, facecolor='r', edgecolor='r')
ag=img[:,:,1].flatten()
plt.hist(ag, bins=256, density=True, facecolor='g', edgecolor='g')
ab=img[:,:,2].flatten()
plt.hist(ab, bins=256, density=True, facecolor='b', edgecolor='b')
plt.show()
运行结果:
21.算子
21.1Sobel
# sobel算子
from skimage import filters
import matplotlib.pyplot as plt
img = io.imread(r"E:\工坊\photos\9.jpg")
edges = filters.sobel(img)
plt.imshow(edges,plt.cm.gray)
运行结果:
22.2 prewitt
# prewitt算子
from skimage import filters
import matplotlib.pyplot as plt
img = io.imread(r"E:\工坊\photos\9.jpg")
edges = filters.scharr(img)
plt.imshow(edges,plt.cm.gray)
22.滤波器
from skimage import filters
import matplotlib.pyplot as plt
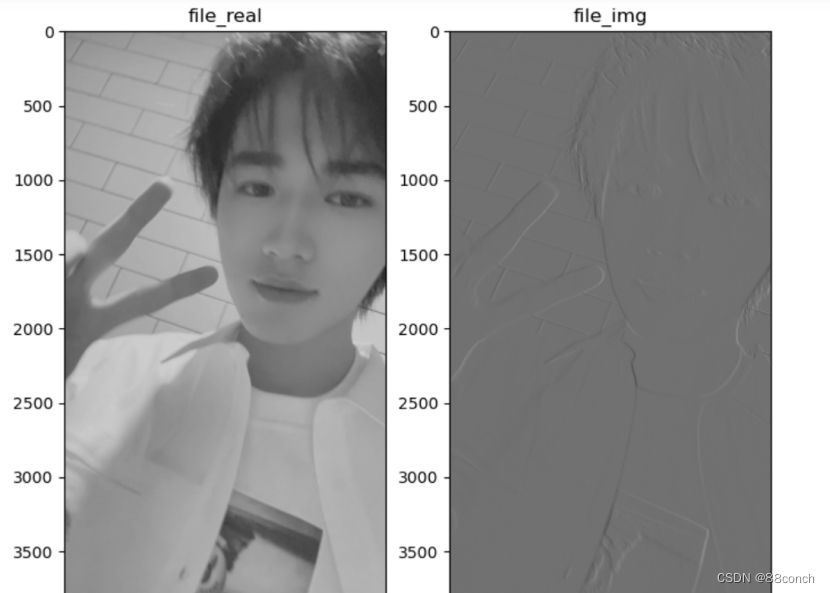
img= io.imread(r"E:\工坊\photos\5.jpg",as_gray=True)
filt_real, filt_img = filters.gabor(img,frequency=0.6)

plt.figure('gabor',figsize=(8,8))

plt.subplot(121)
plt.title('file_real')
plt.imshow(filt_real,plt.cm.gray)

plt.subplot(122)
plt.title("file_img")
plt.imshow(filt_img,plt.cm.gray)
运行结果:
23.绘制图形
23.1画线
from skimage import draw
import matplotlib.pyplot as plt
img=(r"E:\工坊\photos\6.jpg")
img = io.imread(img)
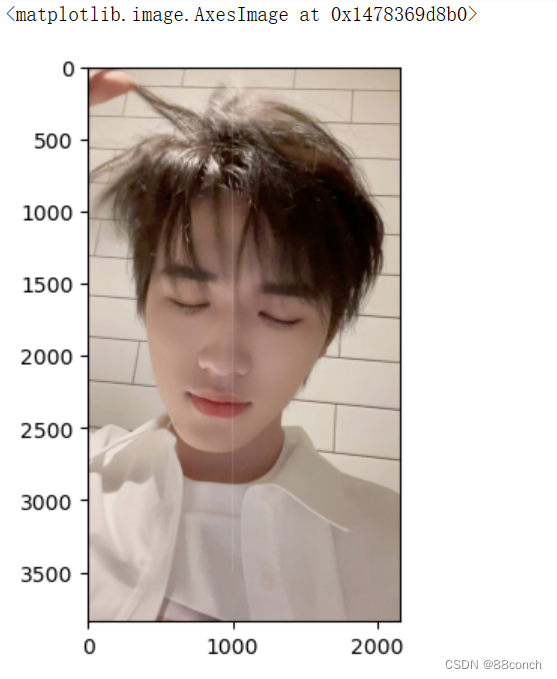
rr, cc = draw.line(1, 1000, 3500, 1000)
img[rr, cc] = 255
plt.imshow(img,plt.cm.gray)
运行结果:
23.2画多边形
import matplotlib.pyplot as plt
from skimage import io, draw
import numpy as np

# 读取图像并转换为灰度图像
img_path = r"E:\工坊\photos\6.jpg"
img = io.imread(img_path)

# 定义多边形的顶点坐标 顺时针
Y = np.array([800,800,500,200,200,500])
X = np.array([400,700,900,700,400,200])

# 绘制多边形并填充
rr, cc = draw.polygon(Y, X)
img[rr, cc] = 1
draw.set_color(img,[rr,cc],[225,245,250])

# 显示图像
plt.imshow(img, cmap=plt.cm.gray)
plt.axis('off')
plt.show()
运行结果:

23.3画椭圆
from skimage import draw,io
import matplotlib.pyplot as plt
img = r"E:\工坊\photos\6.jpg"
img = io.imread(img)
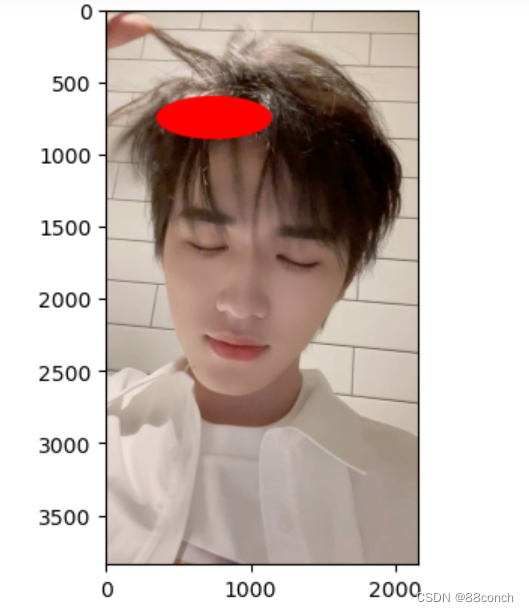
rr, cc=draw.ellipse(750, 750, 150, 400)
draw.set_color(img,[rr,cc],[255,0,0])
plt.imshow(img,plt.cm.gray)
运行结果:
23.4画空心圆
from skimage import draw,io
import matplotlib.pyplot as plt
img = r"E:\工坊\photos\6.jpg"
img = io.imread(img)
rr, cc=draw.circle_perimeter(900,900,300)
draw.set_color(img,[rr,cc],[255,0,0])
plt.imshow(img,plt.cm.gray)
运行结果:
