立体柱状图分为:
- 纯色立体柱状图
- 渐变立体柱状图
常用实现方式
纯色立体柱状图
纯色立体柱状图,使用MarkPoint和颜色渐变就实现,如下代码
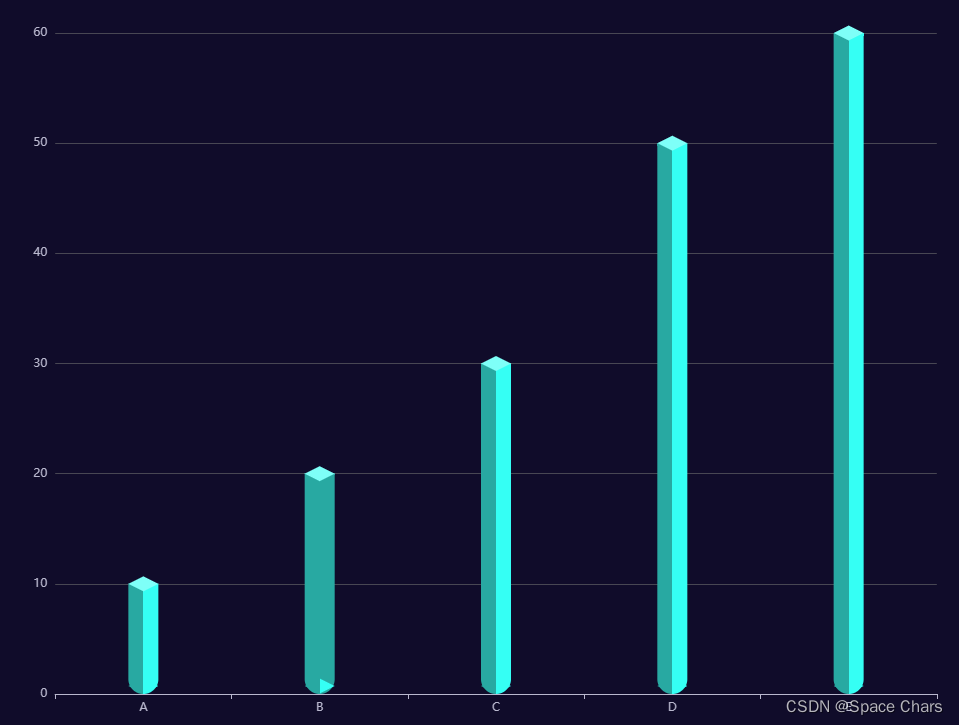
import * as echarts from "echarts";

var chartDom = document.getElementById("main");
var myChart = echarts.init(chartDom, "dark");
var option;

const xAxisData = ['A', 'B', 'C', 'D', 'E'];
const yAxisData = [10, 20, 30, 50, 60];

const markPointData = [];

const barWidth = 30;

const linearColor = {
  type: 'linear',
  x: 0,
  y: 0,
  x1: 0,
  y1: 1,
  colorStops: [
    {
      offset: 0,
      color: '#28A9A2' // 0% 处的颜色
    },
    {
      offset: 0.5,
      color: '#28A9A2' // 0% 处的颜色
    },
    {
      offset: 0.5,
      color: '#35FFF4' // 0% 处的颜色
    },
    {
      offset: 1,
      color: '#35FFF4' // 100% 处的颜色
    }
  ],
  global: false // 缺省为 false
};

yAxisData.forEach((v, i) => {
  //添加顶部渐变
  markPointData.push({
    xAxis: xAxisData[i],
    yAxis: v,
    symbol: 'path://M 0 5 L 15 10 L 30 5 L 15 0 L 0 5 Z', //菱形图标
    symbolSize: [barWidth, barWidth * 0.5],
    itemStyle: {
      color: 'rgba(126, 255, 248,1)'
    }
  });
  // //添加底部渐变
  markPointData.push({
    xAxis: xAxisData[i],
    y: 698,// 到左上角Y轴距离
    symbol: 'path://M 0 5 L 15 10 L 30 5 L 15 0 L 0 5 Z', //菱形图标
    symbolSize: [barWidth, barWidth * 0.5],
    symbolOffset: ['0%', '100%'],
    itemStyle: {
      color: linearColor
    }
  });
});

option = {
  title: {
    text: '立体柱状图示例'
  },
  tooltip: {},
  xAxis: {
    data: xAxisData
  },
  yAxis: {},
  series: [
    {
      name: '销量',
      type: 'bar',
      data: yAxisData,
      barWidth: barWidth,
      markPoint: {
        data: markPointData,
        silent: true
      },
      itemStyle: {
        borderRadius: [0, 0, 30, 30],
        color: linearColor
      }
    }
  ]
};

option && myChart.setOption(option);
SVG
SVG适用于纯色立体柱状图和渐变立体柱状图
ECharts不能直接使用SVG字符串,须要转化为Base64格式的数据(可以使用网络SVG图片地址)
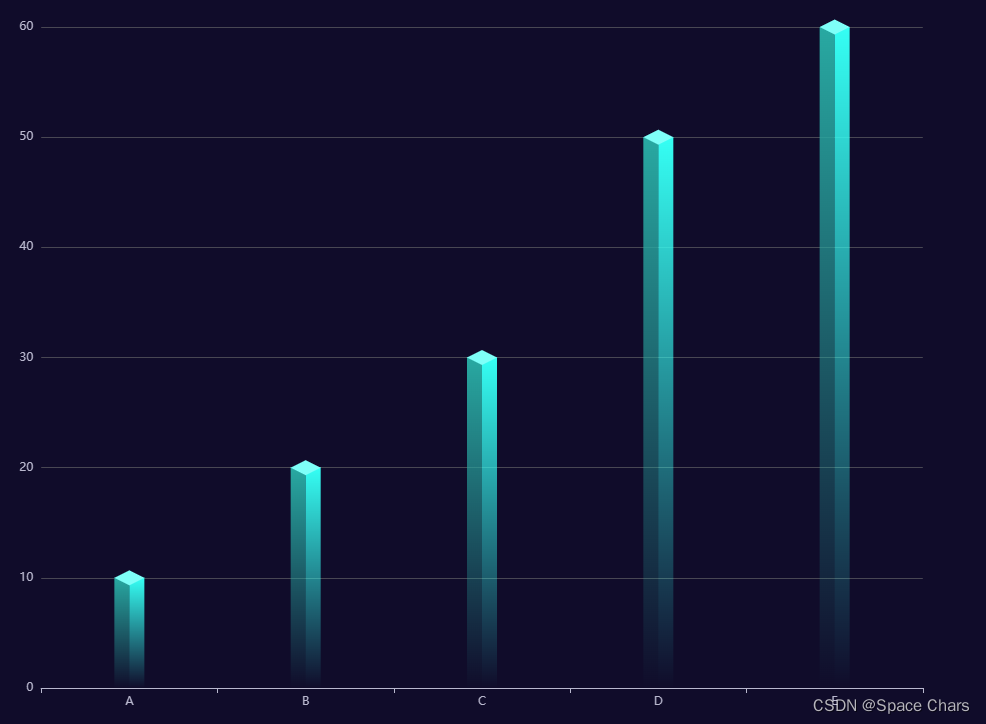
import * as echarts from "echarts";

var chartDom = document.getElementById("main");
var myChart = echarts.init(chartDom, "dark");
var option;

const xAxisData = ["A", "B", "C", "D", "E"];
const yAxisData = [10, 20, 30, 50, 60];

const markPointData = [];

const barWidth = 30;

const svgStr =
    '<svg xmlns="http://www.w3.org/2000/svg" xmlns:xlink="http://www.w3.org/1999/xlink" fill="none" version="1.1" width="14" height="105" viewBox="0 0 14 105"><defs><linearGradient x1="0.5" y1="0" x2="0.5" y2="1" id="master_svg0_1_6290"><stop offset="0%" stop-color="#28A9A2" stop-opacity="1"/><stop offset="100%" stop-color="#28A9A2" stop-opacity="0"/></linearGradient><linearGradient x1="0.5" y1="0" x2="0.5" y2="1" id="master_svg1_1_6296"><stop offset="0%" stop-color="#35FFF4" stop-opacity="1"/><stop offset="100%" stop-color="#35FFF4" stop-opacity="0"/></linearGradient></defs><g><g><rect x="0" y="0" width="7" height="105" rx="0" fill="url(#master_svg0_1_6290)" fill-opacity="1"/></g><g><rect x="7" y="0" width="7" height="105" rx="0" fill="url(#master_svg1_1_6296)" fill-opacity="1"/></g></g></svg>';
// 转换为Base64格式
const svgDataURL = "data:image/svg+xml;base64," + btoa(svgStr);

yAxisData.forEach((v, i) => {

    //添加顶部渐变
    markPointData.push({
        xAxis: xAxisData[i],
        yAxis: v,
        symbol: "path://M 0 5 L 15 10 L 30 5 L 15 0 L 0 5 Z", //菱形图标
        symbolSize: [barWidth, barWidth * 0.5],
        itemStyle: {
            color: "rgba(126, 255, 248,1)"
        }
    });
});

option = {
    title: {
        text: "立体柱状图示例"
    },
    tooltip: {},
    xAxis: {
        data: xAxisData
    },
    yAxis: {},
    series: [
        {
            name: "销量",
            type: "pictorialBar",
            data: yAxisData,
            barWidth: barWidth,
            markPoint: {
                data: markPointData,
                silent: true
            },
            symbol:`image://${svgDataURL}`,
        }
    ]
};

option && myChart.setOption(option);
2. MarkPoint
MarkPoint 适用于多组图标组合展示
它和SVG不同的是绘制方式不一样,SVG是互联网通用绘制方式,MarkPoint是ECharts特有的绘制方式

import * as echarts from 'echarts';

var chartDom = document.getElementById('main');
var myChart = echarts.init(chartDom, 'dark');
var option;

const xAxisData = ['A', 'B', 'C', 'D', 'E'];
const yAxisData = [10, 20, 30, 50, 60];

const markPointData = [];

const barWidth = 30;

// 计算柱状图高度
function computedBarHeight(value, params) {
  // 左上角 到 Y轴 0 刻度的高度,如果x轴是数值轴,则例使用xAxisIndex标记
  const zeroHeight = myChart.convertToPixel({ yAxisIndex: 0 }, 0);
  // 左上角到Y轴目标数值的高度,如果x轴是数值轴,则例使用xAxisIndex标记
  const height = myChart.convertToPixel({ yAxisIndex: 0 }, params.data.yAxis);
  // 返回柱状图大小,高度等于0刻度距离-目标数值距离的差值
  return [barWidth / 2, zeroHeight - height];
}

yAxisData.forEach((v, i) => {
  //添加左侧渐变
  markPointData.push({
    xAxis: xAxisData[i],
    yAxis: v,
    symbol: 'rect',
    symbolSize: computedBarHeight,
    symbolOffset: ['-50%', '50%'],
    itemStyle: {
      color: {
        type: 'linear',
        x: 0,
        y: 0,
        x2: 0,
        y2: 1,
        colorStops: [
          {
            offset: 0,
            color: 'rgba(40, 169, 162,1)'
          },
          {
            offset: 1,
            color: 'rgba(40, 169, 162,0)'
          }
        ],
        global: false
      }
    }
  });

  //添加右侧渐变
  markPointData.push({
    xAxis: xAxisData[i],
    yAxis: v,
    symbol: 'rect',
    symbolSize: computedBarHeight,
    symbolOffset: ['50%', '50%'],
    itemStyle: {
      color: {
        type: 'linear',
        x: 0,
        y: 0,
        x2: 0,
        y2: 1,
        colorStops: [
          {
            offset: 0,
            color: 'rgba(53, 255, 244,1)'
          },
          {
            offset: 1,
            color: 'rgba(53, 255, 244,0)'
          }
        ],
        global: false
      }
    }
  });

  //添加顶部渐变
  markPointData.push({
    xAxis: xAxisData[i],
    yAxis: v,
    symbol: 'path://M 0 5 L 15 10 L 30 5 L 15 0 L 0 5 Z',//菱形图标
    symbolSize: [barWidth, barWidth * 0.5],
    itemStyle: {
      color: 'rgba(126, 255, 248,1)'
    }
  });
});

option = {
  title: {
    text: '立体柱状图示例'
  },
  tooltip: {},
  xAxis: {
    data: xAxisData
  },
  yAxis: {},
  series: [
    {
      name: '销量',
      type: 'bar',
      data: yAxisData,
      barWidth: barWidth,
      markPoint: {
        data: markPointData,
        silent: true
      },
      z: 3,
      itemStyle: {
        color: 'rgba(255, 53, 64,0)'
      }
    }
  ]
};

option && myChart.setOption(option);





![[SWPUCTF 2021 新生赛]PseudoProtocols、[SWPUCTF 2022 新生赛]ez_ez_php](https://img-blog.csdnimg.cn/direct/c5ec13a76ac04945bf321bc6add31c80.png)
