2024/4/30
After installing the 'xlrd' package, you should be able to read Excel files using pandas without any issues.
#需要在pyCharm命令行中下载两个包
pip install pandas
pip install xlrd
.xls数据导入
#数据的导入
import pandas as pd
#导入EXCEL表格数据
df_excel=pd.read_excel('C:/Users/galax/Desktop/数据预处理py实验表sklearn(清洗脏数据).xls')

#将变量赋给see_data
see_data=df_excel
查看前五行数据
#查看数据的前5行
print(see_data.head())
#查看数据的后5行
print(see_data.tail())
结果:(前五行)
(后五行)
查看所有的列名
#查看所有的列名
print(see_data.colums)
结果:

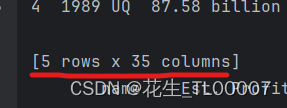
查看数据规模(形状:n行xm列)
#查看数据规模:
print(see_data.shape)
结果:
查看各个变量的数据类型:
#查看各个变量的数据类型:
print(see_data.dtypes)
结果:
[5 rows x 35 columns]
(9, 35)
name                       object
Est. Profit                object
Type                       object
Δv                         object
MOID                      float64
Composition                object
Aphelion                  float64
Diameter                  float64
e                         float64
a                         float64
Semi-major Axis           float64
Rotation                  float64
Inclination               float64
Perihelion (              float64
Period                    float64
EMOID                     float64
Albedo                     object
epoch                     float64
q                         float64
i                         float64
node                      float64
peri                      float64
M                         float64
tp                        float64
period                    float64
n                         float64
Q                         float64
[H] absolute magnitude    float64
diameter                  float64
rotation period           float64
geometric albedo          float64
B-V                       float64
U-B                       float64
Tholen spectral type       object
SMASSII spectral type      object
查看数据的整体信息
#查看数据整体信息(每一列的数据类型)
print(see_data.info())
结果:
<class 'pandas.core.frame.DataFrame'>
RangeIndex: 9 entries, 0 to 8
Data columns (total 35 columns):
 #   Column                  Non-Null Count  Dtype
---  ------                  --------------  -----
 0   name                    9 non-null      object
 1   Est. Profit             8 non-null      object
 2   Type                    5 non-null      object
 3   Δv                      9 non-null      object
 4   MOID                    2 non-null      float64
 5   Composition             6 non-null      object
 6   Aphelion                9 non-null      float64
 7   Diameter                7 non-null      float64
 8   e                       8 non-null      float64
 9   a                       7 non-null      float64
 10  Semi-major Axis         8 non-null      float64
 11  Rotation                7 non-null      float64
 12  Inclination             9 non-null      float64
 13  Perihelion (            9 non-null      float64
 14  Period                  9 non-null      float64
 15  EMOID                   9 non-null      float64
 16  Albedo                  4 non-null      object
 17  epoch                   9 non-null      float64
 18  q                       6 non-null      float64
 19  i                       6 non-null      float64
 20  node                    6 non-null      float64
 21  peri                    6 non-null      float64
 22  M                       6 non-null      float64
 23  tp                      6 non-null      float64
 24  period                  6 non-null      float64
 25  n                       6 non-null      float64
 26  Q                       6 non-null      float64
 27  [H] absolute magnitude  6 non-null      float64
 28  diameter                6 non-null      float64
 29  rotation period         6 non-null      float64
 30  geometric albedo        6 non-null      float64
 31  B-V                     5 non-null      float64
 32  U-B                     5 non-null      float64
 33  Tholen spectral type    5 non-null      object
 34  SMASSII spectral type   6 non-null      object
dtypes: float64(27), object(8)
memory usage: 2.6+ KB
None
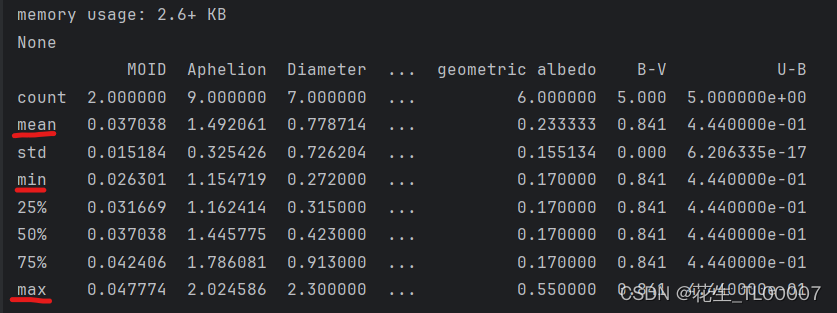
查看数据描述统计,包括平均值极值等
#查看数据描述统计,包括平均值极值等
print(see_data.describe())
结果:
查看空值和缺失值
#查看某列是否含有空值和缺失值
print(see_data.isnull().any(axis=0))#axis取0是列,取1是行
结果:
name                      False
Est. Profit                True
Type                       True
Δv                        False
MOID                       True
Composition                True
Aphelion                  False
Diameter                   True
e                          True
a                          True
Semi-major Axis            True
Rotation                   True
Inclination               False
Perihelion (              False
Period                    False
EMOID                     False
Albedo                     True
epoch                     False
q                          True
i                          True
node                       True
peri                       True
M                          True
tp                         True
period                     True
n                          True
Q                          True
[H] absolute magnitude     True
diameter                   True
rotation period            True
geometric albedo           True
B-V                        True
U-B                        True
Tholen spectral type       True
SMASSII spectral type      True
dtype: bool
定位空值和缺失值所在的行
#定位缺失值所在的行
print(see_data.loc[see_data.isnull().any(axis=1)])
结果: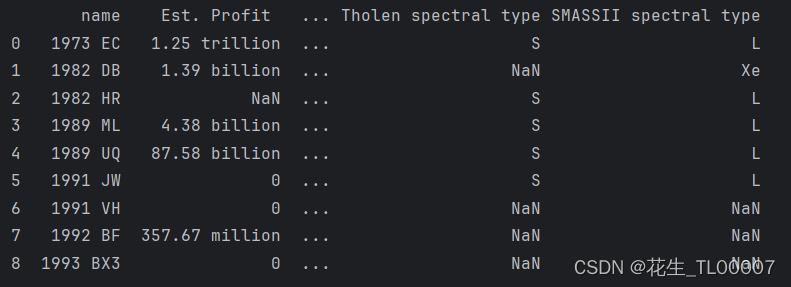
统计各个变量中缺失值的数量
#统计各个变量中缺失值的数量
print(see_data.isnull().sum(axis=0))
结果:
[9 rows x 35 columns]
name                      0
Est. Profit               1
Type                      4
Δv                        0
MOID                      7
Composition               3
Aphelion                  0
Diameter                  2
e                         1
a                         2
Semi-major Axis           1
Rotation                  2
Inclination               0
Perihelion (              0
Period                    0
EMOID                     0
Albedo                    5
epoch                     0
q                         3
i                         3
node                      3
peri                      3
M                         3
tp                        3
period                    3
n                         3
Q                         3
[H] absolute magnitude    3
diameter                  3
rotation period           3
geometric albedo          3
B-V                       4
U-B                       4
Tholen spectral type      4
SMASSII spectral type     3
dtype: int64
python数据预处理基本操作整体代码
#数据的导入
import pandas as pd
#导入EXCEL表格数据
df_excel=pd.read_excel('C:/Users/galax/Desktop/数据预处理py实验表sklearn(清洗脏数据).xls')
see_data=df_excel
#查看数据的前5行
print(see_data.head())
#查看数据的后5行
print(see_data.tail())
#查看数据规模:
print(see_data.shape)
#查看各个变量的数据类型:
print(see_data.dtypes)
#查看数据整体信息(每一列的数据类型)
print(see_data.info())
#查看数据描述统计,包括平均值极值等
print(see_data.describe())
#查看所有的列名
print(see_data.columns)
#查看空值和缺失值
print(see_data.isnull().any(axis=0))#axis取0是列,取1是行
#定位缺失值所在的行
print(see_data.loc[see_data.isnull().any(axis=1)])
#统计各个变量中缺失值的数量
print(see_data.isnull().sum(axis=0))


