Title
题目
Spatial cellular architecture predicts prognosis in glioblastoma
空间细胞结构预测胶质母细胞瘤的预后
01文献速递介绍
胶质母细胞瘤的治疗耐药性的关键驱动因素是肿瘤内的异质性和细胞状态的可塑性。在这里,我们调查了空间细胞组织与胶质母细胞瘤预后之间的关联。利用单细胞RNA测序和空间转录组数据,我们开发了一个深度学习模型,从组织学图像中预测胶质母细胞瘤细胞的转录亚型。利用这个模型,我们对来自410名患者的4000万个组织点进行了表型分析,并在两个独立的队列中确定了肿瘤结构与预后之间的一致关联。预后不佳的患者表现出更高比例的肿瘤细胞表达缺氧诱导的转录程序。此外,类似星形胶质细胞的肿瘤细胞的聚类模式与预后不佳相关,而星形胶质细胞与其他转录亚型的分散和连接与风险减少相关。为了验证这些结果,我们开发了一个单独的深度学习模型,利用组织学图像预测预后。将这个模型应用于空间转录组数据,揭示了与生存相关的区域基因表达程序。总的来说,我们的研究提出了一种可扩展的方法来揭示胶质母细胞瘤的转录异质性,并建立了空间细胞结构与临床结果之间的重要联系。
Results
结果
Identifications of spatially resolved transcriptional subtypes To resolve the transcriptional heterogeneity of GBM within the spatial context, we performed an integrative analysis of three spatial tran scriptomics datasets (Supplementary Data 1)16,18. The integrated data set comprised 23 GBM samples obtained from 22 patients. Each sample contains 2500 ~4702 gene expression spots, resulting in 75,625transcriptomes. Data preprocessing and batch-effect normalization were described in the “Methods” section. To determine the number of cells in each spot, we performed nuclei segmentation on histology images. The cell count ranged from 3 to 38, with an average count of 13 cells (Supplementary Fig. 1a). To determine genomic abnormalities of the GBM samples, we inferred copy number alterations (CNAs) using the transcriptomics profile of each spot, where data from a separate cohort of normal brain tissues (n = 6 tissues from 3 patients) were used as a reference31. Tumor samples demonstrated broad CNAs across chromosomes, including gains of Chr 6, Chr 7 and loss of Chr 8, Chr 10 and Chr14 (Fig. 1a and Supplementary Fig. 1b). Since GBM cells are highly infiltrative, each spot may contain a mixture of tumor cells and normal brain tissues. To estimate the tumor cell content within each spot, we first designated a prominent CNA event that shared across all the spots in each tumor as tumor signature CNA. The tumor cell con tent was then estimated based on the score of the CNA signature (“Methods”). At least three signature events were calculated in each tumor to ensure robust and unbiased estimations. We found that our approach was able to distinguish tumor regions versus histologically normal peripheral tissues (Supplementary Figs. 1c, d). Therefore, we used CNA-based estimation of tumor cell contents to filter malignant spots, while spots with low (<20%) tumor cell content were removed in our subsequent analysis.
为了解析胶质母细胞瘤(GBM)在空间上的转录异质性,我们对三个空间转录组数据集进行了整合分析(补充资料1)16,18。整合数据集包括来自22位患者的23个GBM样本。每个样本包含2500~4702个基因表达点,共计75,625个转录组。数据预处理和批次效应标准化在“方法”部分有描述。为了确定每个点中的细胞数量,我们在组织学图像上进行了核分割。细胞计数范围从3到38,平均计数为13个细胞(补充图1a)。为了确定GBM样本的基因组异常,我们利用每个点的转录组概况推断拷贝数变异(CNA),其中使用来自3位患者的6份正常脑组织(n = 6 tissues from 3 patients)作为参考31。肿瘤样本显示出染色体广泛的CNA,包括第6、第7染色体的增加和第8、第10及第14染色体的丢失(图1a及补充图1b)。由于GBM细胞具有高度浸润性,每个点可能包含肿瘤细胞和正常脑组织的混合物。为了估算每个点中的肿瘤细胞含量,我们首先指定每个肿瘤中所有点共有的一个显著CNA事件作为肿瘤特征CNA。然后根据CNA特征的得分估算肿瘤细胞含量(“方法”)。每个肿瘤至少计算三个特征事件,以确保估算的健壮性和无偏性。我们发现这种方法能够区分肿瘤区域和组织学正常的外围组织(补充图1c, d)。因此,我们使用基于CNA的肿瘤细胞含量估算方法来筛选恶性点,而肿瘤细胞含量低于20%的点在后续分析中被移除。
Method
方法
Preprocessing of the spatial transcriptomics dataWe used four publicly available spatial transcriptomics datasets comprising both tumors and normal brain tissues (SupplementaryData 1)16,18. All datasets were generated using the 10X Visium platform.Quality control was performed by the cell ranger pipeline and imported into AnnData objects using the Scanpy software (version 1.9). Ineach sample, we removed spots with less than 200 detected genes andmore than 5% mitochondrial RNA. Additionally, genes detected in lessthan 3 spots were removed. Given the potential presence of batcheffects in spatial transcriptomics data, we performed normalizationand variance stabilization across different samples using regularizednegative binomial regression55. We regressed out percentages ofmitochondria-expressed genes per spot and effects from cell cycles.This approach allowed us to remove the influence of technical variances from downstream analyses while preserving biologicalheterogeneity.
空间转录组数据的预处理 我们使用了四个公开可用的空间转录组数据集,包括肿瘤和正常脑组织(补充数据 1)16,18。所有数据集均使用 10X Visium 平台生成。通过 cell ranger 流程进行质量控制,并使用 Scanpy 软件(版本 1.9)导入到 AnnData 对象中。在每个样本中,我们移除了检测到的基因少于 200 个且线粒体 RNA 超过 5% 的斑点。此外,还移除了在少于 3 个斑点中检测到的基因。鉴于空间转录组数据中可能存在的批次效应,我们使用规范化的负二项回归进行了归一化和方差稳定处理。我们回归了每个斑点中线粒体表达基因的百分比和细胞周期的影响。这种方法使我们能够在保留生物学异质性的同时,去除技术变异对下游分析的影响。
Figure
图
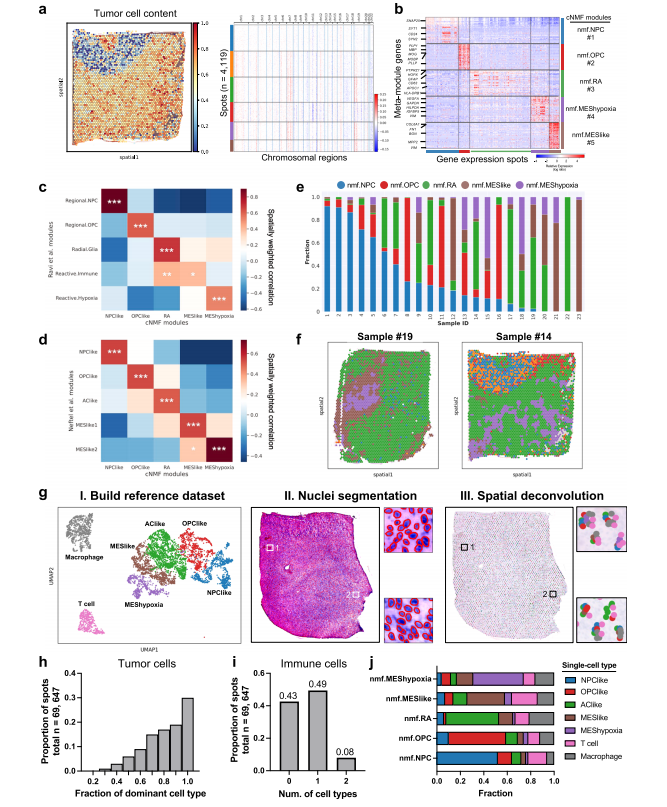
Fig. 1 | Identifications of spatial gene expression programs in GBM. a Heatmaps showing the tumor cell content across different spots and corresponding CNAs across different chromosomes in a representative sample. b Heatmap showing gene expression levels of the top 60 signatures from each cNMF module. Malignant spots (n = 69, 647) from all samples (n = 23) were grouped by the expression score of each module. c, d Heatmaps showing the average correlation coefficients (n = 23 samples) from spatially weighted correlation analysis between the cNMF modules (x-axis) and published modules from (c) Ravi et al. 16 and (d) Neftel et al. 5Two-sided Wald tests were used to determine statistical significance, and P values were adjusted for multiple testing using the Benjamini-Hochberg procedure.P < 0.05, P < 0.01, *P < 0.001. e Stacked bar plot showing the fractions of different transcriptional subtypes in each sample. Transcriptional subtype was determined using the top-scoring cNMF module in each spot. f spatial visualizationshowing the distribution of transcriptional subtypes in two example tumors. Spots were colored by transcriptional subtypes as indicated in panel e. g Pipeline for computational deconvolution of spots using single-cell RNA-seq data as reference:I. UMAP visualization of the reference single-cell RNA-seq data. Each dot represents a cell colored by the subtype; II. cell count estimation of each spot based on nuclei segmentation; III. Align cell types from the reference dataset to spots. h Histogram showing the fraction of dominant tumor cell type over all tumor cells in each spot(total n = 69, 647 spots; n = 23 samples). i The number of immune cell types in each spot (total n = 69, 647 spots; n = 23 samples). j The average fraction (x-axis) of each individual cell type from the single-cell RNA-seq data in spots classified by cNMFmodules (y-axis). Source data are provided as a Source Data file.
图1 | 胶质母细胞瘤中空间基因表达程序的识别。a 热图显示不同点中的肿瘤细胞含量及相应染色体上的拷贝数变异(CNA)。b 热图显示每个cNMF模块前60个标志性基因的表达水平。所有样本(n=23)中的恶性点(n=69,647)根据每个模块的表达得分进行分组。c, d 热图显示空间加权相关分析中的平均相关系数(n=23个样本)从cNMF模块(x轴)到(c)Ravi等人16和(d)Neftel等人5发布的模块。使用双侧Wald测试来确定统计显著性,P值使用Benjamini-Hochberg程序进行多重检验调整。*P < 0.05, P < 0.01, *P < 0.001。e 堆叠条形图显示每个样本中不同转录亚型的比例。转录亚型是根据每个点中得分最高的cNMF模块确定的。f 空间可视化显示两个例子肿瘤中转录亚型的分布。点按照e面板所示的转录亚型进行着色。g 使用单细胞RNA测序数据作为参考的点计算解卷积的流程图:I. 参考单细胞RNA测序数据的UMAP可视化。每个点代表一种按亚型着色的细胞;II. 基于核分割估算每个点的细胞计数;III. 将参考数据集中的细胞类型与点对齐。h 直方图显示每个点中占主导地位的肿瘤细胞类型的比例(总n = 69,647点;n = 23个样本)。i 每个点中免疫细胞类型的数量(总n = 69,647点;n = 23个样本)。j 平均比例(x轴)显示每个单细胞RNA测序数据中的单一细胞类型在由cNMF模块分类的点中的分布(y轴)。源数据作为源数据文件提供。
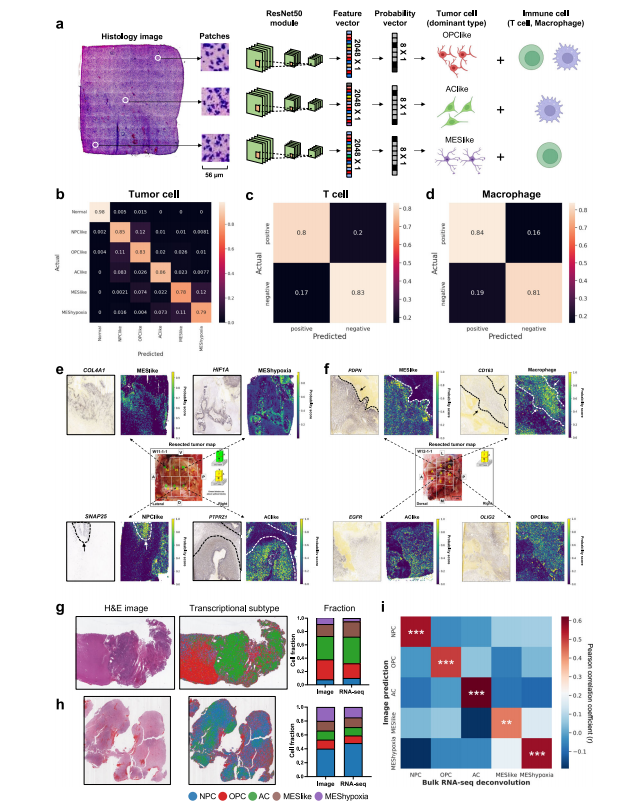
Fig. 2 | Development and validation of GBM-CNN for spatially resolved tran scriptional subtype prediction. a Architecture of GBM-CNN. Histology imageswere cropped to extract patches corresponding to each spot. Each patch was thentransformed into a feature vector (2048 × 1) using a ResNet-50 module. Subse quently, each feature vector was mapped to a probability vector (8 × 1) through a fully connected layer. The cell-type cartoons were created with BioRender.com.b Confusion matrix showing the classification performance of GBM-CNN in predicting the dominant tumor cell type. Predictions from all folds (n = 23) were averaged into a single matrix. c, d Confusion matrices showing the classification performance of GBM-CNN in predicting the presence of (c) T cell and (d) macro phage. e, f Alignment of ground truth gene expression signals obtained from in situRNA hybridization and the predicted probability scores of individual cell types in matched histological sections. Examples from two different tumors were presented. g, h H&E images and the predicted distribution of transcriptional subtypes in two tumors from the TCGA cohort. Bar graphs depict transcriptional subtype proportions derived from the image prediction versus bulk RNA-seq deconvolu tion. i Heatmap of Pearson correlation coefficient showing the agreement between transcriptional subtype proportions derived from our image predictions versus those estimated from bulk RNA-seq deconvolution (n = 166 patients). P values were determined using the two-sided Pearson correlation test and were adjusted by theBenjamini-Hochberg procedure. P < 0.01, *P < 0.001. Source data are providedas a Source Data file.
图 2 | GBM-CNN 用于空间解析转录亚型预测的开发和验证。a GBM-CNN 架构。利用组织学图像截取每个斑点对应的片段。然后,每个片段通过 ResNet-50 模块转换为特征向量(2048 × 1)。随后,每个特征向量通过一个全连接层映射成概率向量(8 × 1)。细胞类型卡通图由 BioRender.com 创建。b 混淆矩阵显示 GBM-CNN 在预测主导肿瘤细胞类型方面的分类性能。所有折叠(n = 23)的预测平均成一个单独的矩阵。c,d 混淆矩阵显示 GBM-CNN 在预测(c)T细胞和(d)巨噬细胞存在方面的分类性能。e,f 从原位 RNA 杂交获得的基因表达信号的真实情况与在匹配的组织学切片中预测的各个细胞类型的概率分数的对齐。展示了来自两个不同肿瘤的例子。g,h 来自 TCGA 队列的两个肿瘤的 H&E 图像和预测的转录亚型分布。条形图显示了从图像预测中得到的转录亚型比例与通过批量 RNA 测序解析得到的转录亚型比例。i 热图显示了从我们的图像预测得到的转录亚型比例与通过批量 RNA 测序解析估计的比例之间的皮尔逊相关系数的一致性(n = 166 名患者)。P 值通过双侧皮尔逊相关检验确定,并通过 Benjamini-Hochberg 程序调整。P < 0.01,*P < 0.001。来源数据以来源数据文件形式提供。
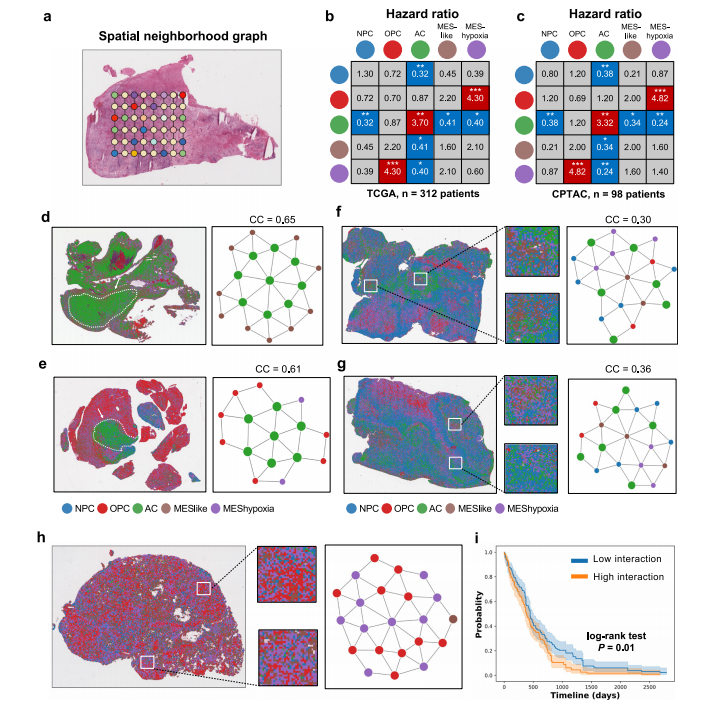
Fig. 3 | Associations between spatial cellular architecture and prognosis.a Schematic representation of a spatial neighborhood graph. Each patch represents a node and connections between patches are edges. b, c Hazard ratio (HR) for frequency of transcriptional subtype interactions and prognosis using data from the (b) TCGA (n = 312 patients) and (c) CPTAC (n = 98 patients) cohorts. Statistical significance was determined using multivariate Cox regression analysis, and sig nificant associations were highlighted by red for HR > 0 and blue for HR < 0.*P < 0.05, P < 0.01, *P < 0.001. d, e Representative tumor samples with high clustering coefficient (CC) of the AC-like subtype. Spots were colored by tran scriptional subtypes. Abstractive networks demonstrate tumor regions character ized by clusters of AC-like spots, as indicated by white arrows. f, g Representative tumor samples with low clustering coefficient (CC) of the AC-like subtype. Spots were colored by transcriptional subtype. Abstractive networks highlighted the interactions between the AC-like subtype and other subtypes, such as NPC-like,MES-like and MES-hypoxia. h Representative tumor sample with a high frequencyof interaction between the OPC-like and MES-hypoxia subtype. i Kaplan-Meiersurvival curves of TCGA patients with high (n = 156) and low (n = 156) interactions between the OPC-like and MES-hypoxia subtypes. Error bands represent con-fidence intervals for the estimated survival probabilities, and the survival curves arecompared with the log-rank test (P = 0.01). Source data are providedas a SourceData file.
图 3 | 空间细胞结构与预后之间的关联。a 空间邻域图的示意图。每个片段代表一个节点,片段之间的连接是边。b,c 转录亚型相互作用频率与预后的危险比(HR),使用来自 (b) TCGA(n = 312名患者)和 (c) CPTAC(n = 98名患者)队列的数据。统计显著性通过多变量 Cox 回归分析确定,显著关联以红色突出显示 HR > 0,以蓝色突出显示 HR < 0。P < 0.05, **P < 0.01, P < 0.001。d,e 代表具有高聚类系数(CC)的 AC-like 亚型的肿瘤样本。斑点按转录亚型着色。抽象网络显示由 AC-like 斑点簇组成的肿瘤区域,如白色箭头所示。f,g 代表具有低聚类系数(CC)的 AC-like 亚型的肿瘤样本。斑点按转录亚型着色。抽象网络突出显示了 AC-like 亚型与其他亚型(如 NPC-like、MES-like 和 MES-hypoxia)之间的互动。h 代表高频互动的肿瘤样本,涉及 OPC-like 与 MES-hypoxia 亚型。i Kaplan-Meier 生存曲线显示 TCGA 患者中与 OPC-like 和 MES-hypoxia 亚型之间的高(n = 156)与低(n = 156)互动。误差带代表估计生存概率的置信区间,生存曲线通过对数秩检验(P = 0.01)进行比较。来源数据以来源数据文件形式提供。

Fig. 4 | In situ identifications of gene expression markers associated with prognosis. a A deep-learning model was trained on whole slide images from the TCGA cohort to predict patient prognosis. H&E-stained histology images were cropped into 56μm × 56μm patches. Each patch was converted to a feature vector (2048 × 1) using a ResNet-50 module. The feature vectors were then mapped to an aggressive score through a Cox regression module. The aggressive scores of each patient were averaged for validation. b Using the trained image model from panel (a) to predict aggressive scores for spots in spatial tran scriptomics. c, d Visualization of transcriptional subtypes and the predicted aggressive scores in two tumors from the spatial transcriptomics cohort.Aggressive scores were normalized within each sample using min-max normal ization. e Bar plot of median aggressive scores for malignant spots. Aggressive scores from all tumors (n = 23) were pooled together and normalized using minmax normalization. f Violin plot of mRNA expression levels for genes upregulated in tumor regions assigned with high aggressive scores (blue) versus those with low scores (yellow). The top 10,000 spots from each group were shown. Boxes within the violins represent the interquartile range (Q1-Q3) of the combined groups, and circles inside the box represent median values. g, h Top enrichedbiological processes in tumor regions with (g) high and (h) low aggressiveness.Sizes of the circles represent the number of genes in each biological process, and colors represent P values of enrichment. P values were determined using the hypergeometric test and adjusted by the Benjamini-Hochberg procedure. Source data are provided as a Source Data file.
图 4 | 原位确定与预后相关的基因表达标记。a 使用来自 TCGA 队列的整张切片图像训练了一个深度学习模型,以预测患者预后。用 H&E 染色的组织学图像被裁剪成 56μm × 56μm 的片段。每个片段通过 ResNet-50 模块转换为特征向量(2048 × 1)。然后,这些特征向量通过一个 Cox 回归模块映射到一个攻击性评分上。每位患者的攻击性评分平均用于验证。b 使用小组 (a) 中训练的图像模型预测空间转录组学中斑点的攻击性评分。c,d 在两个肿瘤的空间转录组学队列中可视化转录亚型和预测的攻击性评分。攻击性评分在每个样本内通过最小-最大规范化进行规范化。e 邪恶斑点中位攻击性评分的条形图。所有肿瘤(n = 23)的攻击性评分汇总并使用最小-最大规范化。f 小提琴图显示被分配高攻击性评分(蓝色)与低评分(黄色)的肿瘤区域中上调基因的 mRNA 表达水平。每组显示前 10,000 个斑点。小提琴图内的盒子代表合并组的四分位数范围(Q1-Q3),盒内的圆圈代表中位数。g,h 在具有 (g) 高和 (h) 低攻击性的肿瘤区域中富集的顶级生物过程。圆圈的大小表示每个生物过程中的基因数量,颜色表示富集的 P 值。P 值通过超几何检验确定,并通过 Benjamini-Hochberg 程序调整。来源数据以来源数据文件形式提供。
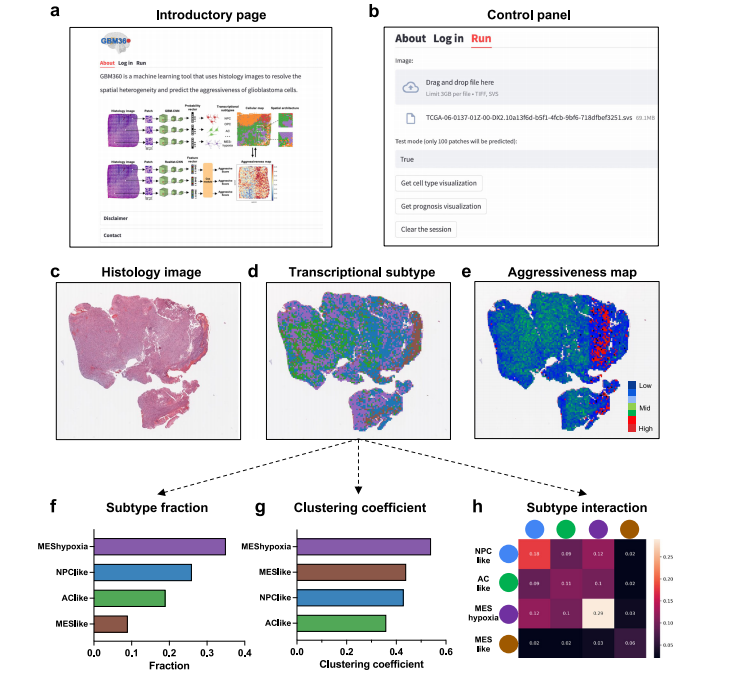
Fig. 5 | Screenshots of the GBM360 software. a Introductory page describing thefunctions of GBM360. The cell-type cartoons were created with BioRender.com.b Control panel for uploading histology images and configuring software settings.c Thumbnail of a histology image uploaded from the user. d Predictions and spatialvisualization of the cell-type distribution. The image was colored by transcriptionalsubtypes. e Predictions and visualization of regional aggressive scores. The imagewas colored by the aggressive score predicted at each patch. Red indicates highaggressiveness and blue indicates low aggressiveness. f–h Statistical analysis of thetranscriptional subtype distribution: (f) bar graph showing the transcriptionalsubtype fractions, (g) clustering coefficient for each subtype, and (h) twodimensional matrix showing the frequency of interactions between any two transcriptional subtypes.
图 5 | GBM360软件的屏幕截图。a 入门页面描述了GBM360的功能。细胞类型的卡通图由BioRender.com创建。b 用于上传组织学图像和配置软件设置的控制面板。c 用户上传的组织学图像的缩略图。d 预测和细胞类型分布的空间可视化。图像按转录亚型进行着色。e 预测和区域侵袭性得分的可视化。图像按每个补丁预测的侵袭性得分进行着色。红色表示高侵袭性,蓝色表示低侵袭性。f-h 转录亚型分布的统计分析:(f) 显示转录亚型比例的条形图,(g) 每个亚型的聚类系数,(h) 任意两个转录亚型之间交互频率的二维矩阵。
Table
表
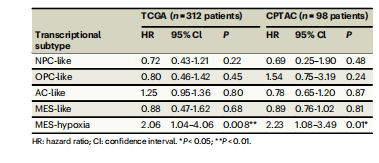
Table 1 | Cox regression analysis showing the effect of sub type proportions on prognosis
表 1 | Cox 回归分析显示亚型比例对预后的影响

Table 2 | Cox regression analysis showing the effect of clus tering coefficient on prognosis
表 2 | Cox 回归分析显示聚类系数对预后的影响