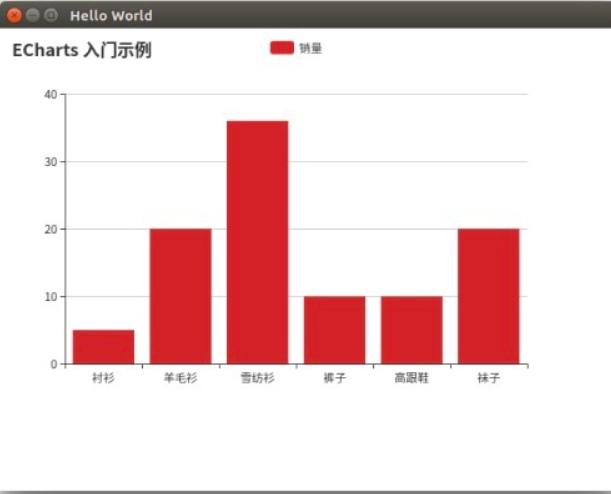
1.效果图
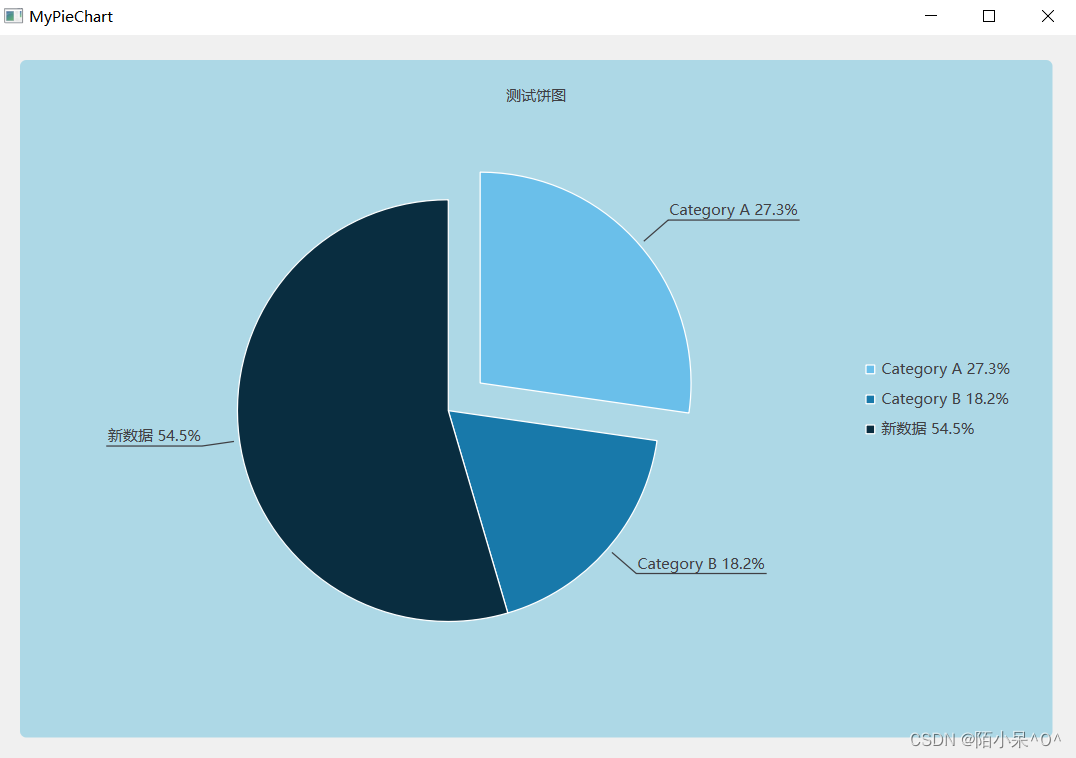
2.代码如下
2.1 .h文件
#ifndef PIECHARTWIDGET_H
#define PIECHARTWIDGET_H

#include <QWidget>
#include <QChartView>
#include <QPieSeries>

#include<QVBoxLayout>
#include<QMessageBox>
#include <QtCharts>

struct PieData
{
    QString type_s;
    qreal value_q;
};


class PieChartWidget : public QWidget
{
    Q_OBJECT

public:
    PieChartWidget(QWidget *parent = nullptr);
    ~PieChartWidget();

    //设置图表标题
    void f_setTitle(const QString& title);
    //设置图表数据
    void f_setSeries(const QMap<QString, int> &data);

    void f_insert_one(const QString& newType,const int& newValue);
    void f_delete_one(const QString& deleteType);


private slots:
    void f_updata_label();

private:
    QChartView *chartView; // 图表视图
    QChart *chart; // 图表
    QPieSeries *series; // 饼图数据系列

    //数据
    // QMap<QString, int> pieData;

};
#endif // PIECHARTWIDGET_H
2.2 .cpp文件
#include "piechartwidget.h"

PieChartWidget::PieChartWidget(QWidget *parent)
    : QWidget(parent)
{

    // 创建饼图数据系列
    series = new QPieSeries();
    // 创建图表并添加饼图数据系列
    chart = new QChart();
    chart->addSeries(series);

    // 创建图例
    chart->legend()->setVisible(true);
    //图例位置
    chart->legend()->setAlignment(Qt::AlignRight);


    // 创建一个QColor对象,表示浅蓝色
    QColor lightBlue = QColor(173, 216, 230); // 使用RGB值表示浅蓝色,RGB值为(173, 216, 230)
    // 创建一个QBrush对象,设置背景颜色为浅蓝色
    QBrush brush(lightBlue);
    // 使用setBrush方法设置图表的背景画刷为浅蓝色
    chart->setBackgroundBrush(brush);


    // 创建图表视图,并设置图表
    chartView = new QChartView(chart, this);
    chartView->setRenderHint(QPainter::Antialiasing);

    // 将图表视图添加到布局中
    QVBoxLayout *layout = new QVBoxLayout(this);
    layout->addWidget(chartView);

    // 连接数据系列的信号到自定义槽函数
    connect(series, &QPieSeries::added, this, &PieChartWidget::f_updata_label);
    connect(series, &QPieSeries::removed, this, &PieChartWidget::f_updata_label);


    // 连接饼图点击事件的信号和槽
    QObject::connect(series, &QPieSeries::clicked, [=](QPieSlice *slice){
        // 添加点击效果动画
        // 迭代所有饼片并将其还原
        if(slice->isExploded()){
            slice->setExploded(false);
            return;
        }
        for (QPieSlice *s : series->slices()) {
            s->setExploded(false);
        }
        slice->setExploded(true);
        slice->setLabelVisible(true);
        slice->setExplodeDistanceFactor(0.2);
    });

}

PieChartWidget::~PieChartWidget()
{


}

void PieChartWidget::f_setTitle(const QString &title)
{

    chart->setTitle(title);
}

void PieChartWidget::f_setSeries(const QMap<QString, int> &data)
{
    // 清空之前的数据系列
    series->clear();

    // 更新 pieData

    // 添加新的图表数据
    for (auto it = data.begin(); it != data.end(); ++it)
    {
        series->append(it.key(), it.value());
    }

}

void PieChartWidget::f_insert_one(const QString &newType, const int &newValue)
{
    // series->append(newType, newValue);
    bool isExist = false;

    // 获取所有的数据项
    QList<QPieSlice *> slices = series->slices();

    for (int i = 0; i < slices.size(); i++) {
        if (slices.at(i)->label().contains(newType)) {  // 如果类别已存在
            isExist = true;
            // slices.at(i)->setValue(newValue);
            // 如果类别已存在,则将原值与新值相加
            int oldValue = slices.at(i)->value();
            slices.at(i)->setValue(oldValue + newValue);

            break;
        }
    }

    if (!isExist) {  // 如果类别不存在,则添加新的数据项
        series->append(newType, newValue);
    }
    f_updata_label();
}

void PieChartWidget::f_delete_one(const QString &deleteType)
{
    // 从饼图系列中删除特定类型的数据
    for (QPieSlice *slice : series->slices()) {
        qDebug()<<slice->label()<<deleteType;
        if (slice->label().contains(deleteType)) {
            qDebug()<<"从饼图系列中删除特定类型的数据";
            series->remove(slice);
            return;
        }
    }

}

//更新百分比
void PieChartWidget::f_updata_label()
{
    for (int i = 0; i < series->count(); ++i) {
        QPieSlice *slice = series->slices().at(i);
        QString currentLabel = slice->label();
        // 如果当前标签已包含百分比信息,则只更新百分比内容
        QRegularExpression regex("\\d+\\.\\d+%");
        if(regex.match(currentLabel).hasMatch()) {
            QStringList labelParts = currentLabel.split(" ");
            int lastSpaceIndex = currentLabel.lastIndexOf(" ");  // 获取最后一个空格的索引
            QString category = currentLabel.mid(0, lastSpaceIndex);  // 提取空格前的部分作为类别
            QString updatedLabel = QString("%1 %2%").arg(category).arg(100 * slice->percentage(), 0, 'f', 1);
            slice->setLabel(updatedLabel);
        } else {  // 否则,在当前标签后面添加百分比信息
            slice->setLabel(QString("%1 %2%").arg(slice->label()).arg(100 * slice->percentage(), 0, 'f', 1));
        }
    }
    //是否显示在图表上
    series->setLabelsVisible(true);
    //箭头指内,注释指外
    // series->setLabelsPosition(QPieSlice::LabelInsideTangential);
}
3. main
#include "piechartwidget.h"

#include <QApplication>

int main(int argc, char *argv[])
{
    QApplication a(argc, argv);
    PieChartWidget w;


    // 创建 QMap 存储数据
    QMap<QString, int> data;
    data.insert("Category A", 30);
    data.insert("Category B", 20);
    data.insert("Category C", 50);

    w.f_setTitle("测试饼图");
    w.f_setSeries(data);

    w.f_insert_one("新数据",20);
    QString delete_s="Category C";
    w.f_delete_one(delete_s);

    w.f_insert_one("新数据",40);
    w.show();
    return a.exec();
}
2.4 .pro文件
QT       += core gui charts

greaterThan(QT_MAJOR_VERSION, 4): QT += widgets

CONFIG += c++17

# You can make your code fail to compile if it uses deprecated APIs.
# In order to do so, uncomment the following line.
#DEFINES += QT_DISABLE_DEPRECATED_BEFORE=0x060000    # disables all the APIs deprecated before Qt 6.0.0

SOURCES += \
    main.cpp \
    piechartwidget.cpp

HEADERS += \
    piechartwidget.h

# Default rules for deployment.
qnx: target.path = /tmp/$${TARGET}/bin
else: unix:!android: target.path = /opt/$${TARGET}/bin
!isEmpty(target.path): INSTALLS += target
