在WebGIS端制图是指通过Web浏览器界面实现地理信息数据的可视化、编辑、分析以及地图产品的制作。这一过程通常涉及以下几个关键环节:
**1. 前端技术栈:
•HTML/CSS/JavaScript:作为Web开发的基础,用于构建用户界面布局、样式设计以及交互逻辑。
•Web地图库:
•Leaflet、OpenLayers、Mapbox GL JS等开源库,提供地图容器、图层管理、交互控件等功能,便于快速构建Web地图应用。
•GIS服务接口:
•Web Map Service (WMS):用于请求地图影像瓦片。
•Web Feature Service (WFS):用于获取矢量地理数据。
•Web Coverage Service (WCS):用于获取栅格数据。
•GeoJSON、TopoJSON、KML等数据格式,直接嵌入或通过API加载。
•地图样式与主题:
•Mapbox Studio、QGIS Cloud等在线工具,或使用JSON-based样式语言(如Mapbox Style Specification、OpenLayers Style Format)自定义地图样式。
**2. 数据准备与集成:
•数据源接入:
连接本地或远程GIS服务器、云存储(如AWS S3、Azure Blob Storage)、开放数据平台(如OpenStreetMap、ArcGIS Online)等,获取所需GIS数据。
•数据处理:
•对接地理编码服务(如Google Maps Geocoding API、Mapbox Geocoding API)进行地址解析或逆地理编码。
•使用客户端库(如Turf.js、Mapbox GL Geostats)进行空间分析、统计计算。
•缓存与优化:
•利用客户端缓存(如IndexedDB、localStorage)存储常用数据或结果,提高加载速度。
•使用矢量瓦片、切片金字塔技术优化大规模数据展示。
**3. 地图交互设计:
•基础交互:缩放、平移、旋转地图,开启/关闭图层,调整图层透明度等。
•高级交互:
•查询与标注:实现点击查询、范围选择、热点分析等功能,显示相关信息或动态标注。
•编辑与绘图:支持用户在地图上添加、修改、删除地理要素,如使用Leaflet.draw、OpenLayers Editing等插件。
•路由规划:集成路线规划服务(如OSRM、GraphHopper),提供驾车、步行、骑行路径规划。
•空间分析:在浏览器端进行简单分析操作,如缓冲区分析、叠加分析等。
**4. 地图定制与输出:
•地图样式定制:通过调整颜色、图标、文字样式等元素,创建符合项目主题的地图样式。
•地图打印与导出:
•实现Web页面打印预览,支持自定义打印范围、比例尺、布局等。
•提供地图截图、PDF导出功能,或集成地图打包服务(如Mapfish Print、GeoServer Print)。
•地图分享与嵌入:
•提供短链接、嵌入代码,方便用户将地图分享至社交媒体或嵌入到其他网站。
**5. 跨平台兼容与响应式设计:
•移动端适配:确保地图应用在不同尺寸的移动设备上具有良好用户体验,如使用触屏手势、自适应布局。
•多浏览器支持:测试在主流浏览器(Chrome、Firefox、Safari、Edge)上的兼容性。
**6. 性能监控与优化:
•性能指标跟踪:监控地图加载时间、内存占用、网络请求等指标,识别性能瓶颈。
•优化措施:
•压缩与合并静态资源,减少HTTP请求。
•使用Web Workers进行大数据处理,避免阻塞主线程。
•采用矢量瓦片、LOD(Level of Detail)策略,按需加载数据。通过上述技术手段和流程,WebGIS端制图实现了从数据获取、处理到地图展现、交互的全流程操作,让用户能够在Web浏览器环境中便捷地进行地图制作与分析,满足各种GIS应用场景的需求。
关键代码实现
组件化代码:
import Draw from 'ol/interaction/Draw'
import VectorSource from 'ol/source/Vector';
import VectorLayer from 'ol/layer/Vector';
import TileLayer from 'ol/layer/Tile';
import OSM from 'ol/source/OSM';

import {unByKey} from 'ol/Observable.js';
import Overlay from 'ol/Overlay';
import {getArea, getLength} from 'ol/sphere.js';
import View from 'ol/View';
import {LineString, Polygon} from 'ol/geom.js';
import {Circle as CircleStyle, Fill, Stroke, Style} from 'ol/style.js';
import {generateUUID, getLayerByCode} from "@/components/iClientOpenLayers/MapCommon";

var DrawMap= /** @class */ (function () {
    function DrawMap(map, drawMapType,drawType,freeHand) {
        /**
         * Currently drawn feature.
         * @type {module:ol/Feature~Feature}
         */
        this.sketch=null;

        this.freeHand=freeHand;


        /**
         * The help tooltip element.
         * @type {Element}
         */
        this.helpTooltipElement=null;


        /**
         * Overlay to show the help messages.
         * @type {module:ol/Overlay}
         */
        this.helpTooltip=null;


        /**
         * The drawMap tooltip element.
         * @type {Element}
         */
        this.drawMapTooltipElement=null;


        /**
         * Overlay to show the drawMapment.
         * @type {module:ol/Overlay}
         */
        this.drawMapTooltip=null;


        /**
         * Message to show when the user is drawing a polygon.
         * @type {string}
         */
        this.continuePolygonMsg = '继续点击绘制多边形';


        /**
         * Message to show when the user is drawing a line.
         * @type {string}
         */
        this.continueLineMsg = '继续点击绘制线';
        this.map=map;
        this.drawMapType=drawMapType;
        this.draw=null;
        this.listener=null;
        this.source=null;
        // var layer ;
        // 获取存放feature的vectorlayer层。map初始化的时候可以添加好了
        for(let layerTmp of map.getLayers().getArray()){
            if(layerTmp.get("name")=="DrawMap"){
                this.source= layerTmp.getSource();
            }
        }
        if(this.source==undefined||this.source==null){
            this.source=getLayerByCode(this.map,"CRegion").getSource()
            // this.source = new VectorSource();

            // var vector = new VectorLayer({
            //     source: this.source,
            //     style: new Style({
            //         fill: new Fill({
            //             color: 'rgba(255, 255, 255, 0.2)',
            //         }),
            //         stroke: new Stroke({
            //             color: '#ffcc33',
            //             width: 2,
            //         }),
            //         image: new CircleStyle({
            //             radius: 7,
            //             fill: new Fill({
            //                 color: '#ffcc33',
            //             }),
            //         }),
            //     }),
            // });
            // vector.set("name","DrawMap");
            // vector.set("code","DrawMap");
            // this.map.addLayer(vector);
        }
        if(drawType=="DrawMap"){
            this.createDrawMapTooltip();
            this.createHelpTooltip();
            let that=this;
            this.pointerMoveHandler = function (evt) {
                if (evt.dragging) {
                    return;
                }
                /** @type {string} */
                var helpMsg = '请点击开始绘制';

                if (that.sketch) {
                    var geom = (that.sketch.getGeometry());
                    if (geom instanceof Polygon) {
                        helpMsg = that.continuePolygonMsg;
                    } else if (geom instanceof LineString) {
                        helpMsg = that.continueLineMsg;
                    }
                }

                that.helpTooltipElement.innerHTML = helpMsg;
                that.helpTooltip.setPosition(evt.coordinate);

                that.helpTooltipElement.classList.remove('hidden');
            };
            /**
             * Handle pointer move.
             * @param {module:ol/MapBrowserEvent~MapBrowserEvent} evt The event.
             */
            map.on('pointermove', this.pointerMoveHandler);

            map.getViewport().addEventListener('mouseout',() =>{
                this.helpTooltipElement.classList.add('hidden');
            });
            // 量测调用
            this.addInteraction();
        }else if(drawType=="Draw"){
            // 量测调用
            this.addInteractionEx();
        }

    };
    DrawMap.prototype. formatLength = function (line) {
        var length = getLength(line,{projection:'EPSG:4326'});
        var output;
        if (length > 100) {
            output = (Math.round(length / 1000 * 100) / 100) +
                ' ' + 'km';
        } else {
            output = (Math.round(length * 100) / 100) +
                ' ' + 'm';
        }
        return output;
    };
    DrawMap.prototype. formatArea = function (polygon) {
        var area = getArea(polygon,{projection:'EPSG:4326'});
        var output;
        if (area > 10000) {
            output = (Math.round(area / 1000000 * 100) / 100) +
                ' ' + 'km<sup>2</sup>';
        } else {
            output = (Math.round(area * 100) / 100) +
                ' ' + 'm<sup>2</sup>';
        }
        return output;
    };
    DrawMap.prototype.addInteraction=function() {
        var type = (this.drawMapType == 'area' ? 'Polygon' : 'LineString');
        this.draw = new Draw({
            ol_uid:'draw',
            source: this.source,
            type: type,
            snapTolerance:20,
            freehand: this.freeHand,
            style: new Style({
                fill: new Fill({
                    color: 'rgba(255, 255, 255, 0.2)'
                }),
                stroke: new Stroke({
                    color: 'rgba(0, 0, 0, 0.5)',
                    lineDash: [10, 10],
                    width: 2
                }),
                image: new CircleStyle({
                    radius: 5,
                    stroke: new Stroke({
                        color: 'rgba(0, 0, 0, 0.7)'
                    }),
                    fill: new Fill({
                        color: 'rgba(255, 255, 255, 0.2)'
                    })
                })
            })
        });
        this.map.addInteraction(this.draw);


        this.draw.on('drawstart',
            (evt)=> {
                // set sketch
                this.sketch = evt.feature;

                /** @type {module:ol/coordinate~Coordinate|undefined} */
                var tooltipCoord = evt.coordinate;

                this.listener = this.sketch.getGeometry().on('change', (evt)=> {
                    var geom = evt.target;
                    var output;
                    if (geom instanceof Polygon) {
                        output = this.formatArea(geom);
                        tooltipCoord = geom.getInteriorPoint().getCoordinates();
                    } else if (geom instanceof LineString) {
                        output = this.formatLength(geom);
                        tooltipCoord = geom.getLastCoordinate();
                    }
                    this.drawMapTooltipElement.innerHTML = output;
                    this.drawMapTooltip.setPosition(tooltipCoord);
                });
            }, this);

        this.draw.on('drawend',
            (e)=> {
                this.drawMapTooltipElement.className = 'ol-tooltip ol-tooltip-static';
                this.drawMapTooltip.setOffset([0, -7]);
                let cFeature = e.feature;
                cFeature.values_["ID"]=generateUUID()
                // unset sketch
                this.clearDraw();
            }, this);
    };

    DrawMap.prototype.addInteractionEx=function(){
        var type = (this.drawMapType == 'area' ? 'Polygon' : 'LineString');
        if(this.drawMapType=="Point"){
            type=this.drawMapType;
        }
        this.draw = new Draw({
            source: this.source,
            type: type,
            freehand: this.freeHand,
            snapTolerance:20,
        });
        this.draw.on('drawend',
            (e)=> {
                const geometry = e.feature.getGeometry()
                const corrdinates = geometry.getCoordinates()
                let cFeature = e.feature;
                cFeature.values_["ID"]=generateUUID()
                // unset sketch
                this.clearDraw();
            }, this);
        this.map.addInteraction(this.draw);
    };

    DrawMap.prototype.createDrawMapTooltip=function() {
        if (this.drawMapTooltipElement) {
            this.drawMapTooltipElement.parentNode.removeChild(this.drawMapTooltipElement);
        }
        this.drawMapTooltipElement = document.createElement('div');
        this.drawMapTooltipElement.className = 'ol-tooltip ol-tooltip-drawMap';
        this.drawMapTooltip = new Overlay({
            element: this.drawMapTooltipElement,
            offset: [0, -15],
            positioning: 'bottom-center'
        });
        this.drawMapTooltip.set("name","DrawMap");
        debugger
        this.drawMapTooltip.getElement().style.display = ''
        this.map.addOverlay(this.drawMapTooltip);
    };
    DrawMap.prototype.createHelpTooltip=function () {
        if (this.helpTooltipElement) {
            this.helpTooltipElement.parentNode.removeChild(this.helpTooltipElement);
        }
        this.helpTooltipElement = document.createElement('div');
        this.helpTooltipElement.className = 'ol-tooltip hidden';
        this.helpTooltip = new Overlay({
            element: this.helpTooltipElement,
            offset: [15, 0],
            positioning: 'center-left'
        });
        this.map.addOverlay(this.helpTooltip);
    };

    DrawMap.prototype.clearDraw=function () {
        debugger
        this.sketch = null;
        // unset tooltip so that a new one can be created
        this.drawMapTooltipElement = null;
        // this.createDrawMapTooltip();
        if(this.listener!=undefined&&this.listener!=null){
            unByKey(this.listener);
        }
        try{
            this.map.un('pointermove', this.pointerMoveHandler);
        }
        catch (e){

        }
        if(this.draw!=undefined&&this.draw!=null){
            for(let i = 0; i < this.map.interactions.array_.length; i++){
                if(this.draw.ol_uid == this.map.interactions.array_[i].ol_uid){
                    this.map.removeInteraction(this.map.interactions.array_[i]);break
                }
            }
        }
        if(this.helpTooltipElement!=undefined&&this.helpTooltipElement!=null){
            this.helpTooltipElement.classList.add('hidden');
        }
        if(this.helpTooltip!=undefined&&this.helpTooltip!=null){
            this.map.removeOverlay(this.helpTooltip);
        }

    };
    return DrawMap;
}());

export {DrawMap};
调用代码:
//绘制制图切换
drawMapSwitch(pIndex){
  if(this.curDraw!=null){
    this.curDraw.clearDraw();
    this.curDraw=null;
  }
  if(pIndex==0){
    this.curDraw=new DrawMap(this.sMap, "LineString","Draw",false);
  }else if(pIndex==1){
    this.curDraw=new DrawMap(this.sMap, "area","Draw",false);
  }else if(pIndex==2){
    this.curDraw=new DrawMap(this.sMap, "Point","Draw",false);
  }else if(pIndex==3){
    this.curDraw=new DrawMap(this.sMap, "LineString","Draw",true);
  }else if(pIndex==4){
    this.curDraw=new DrawMap(this.sMap, "area","Draw",true);
  }else if(pIndex==5){
    for(let layerTmp of this.sMap.getLayers().getArray()){
      if(layerTmp.get("code")=="CRegion"){
        layerTmp.getSource().clear();
        break;
      }
    }
    for(let i=0;i<this.sMap.getOverlays().getArray().length;i++){
      if(this.sMap.getOverlays().getArray()[i].get("code")=="CRegion"){
        this.sMap.removeOverlay(this.sMap.getOverlays().getArray()[i]);
        i--;
      }
    }
  }else if(pIndex==6){
    let geojson=getGeojsonByLayerCode(this.sMap,"CRegion")
    alert(geojson)
  }

}
前端代码设计
<div class="operate map_huizhi">
  <i class="icon huizhi"></i>
  <ul class="map-sub-nav">
    <li v-for="(item,index) in drawMapData" @click="drawMapSwitch(index)">{{item}}</li>
  </ul>
</div>
.huizhi{
  width: 38px;
  height: 38px;
  background: url('./img/huizhi.png') no-repeat center center;
  background-image: -webkit-image-set(url('./img/huizhi.png') 1x, url("./img/huizhi@2x.png") 2x);
  background-image: image-set(url('./img/huizhi.png') 1x, url("./img/huizhi@2x.png") 2x);
  background-repeat: no-repeat;
  background-position: center center;
}
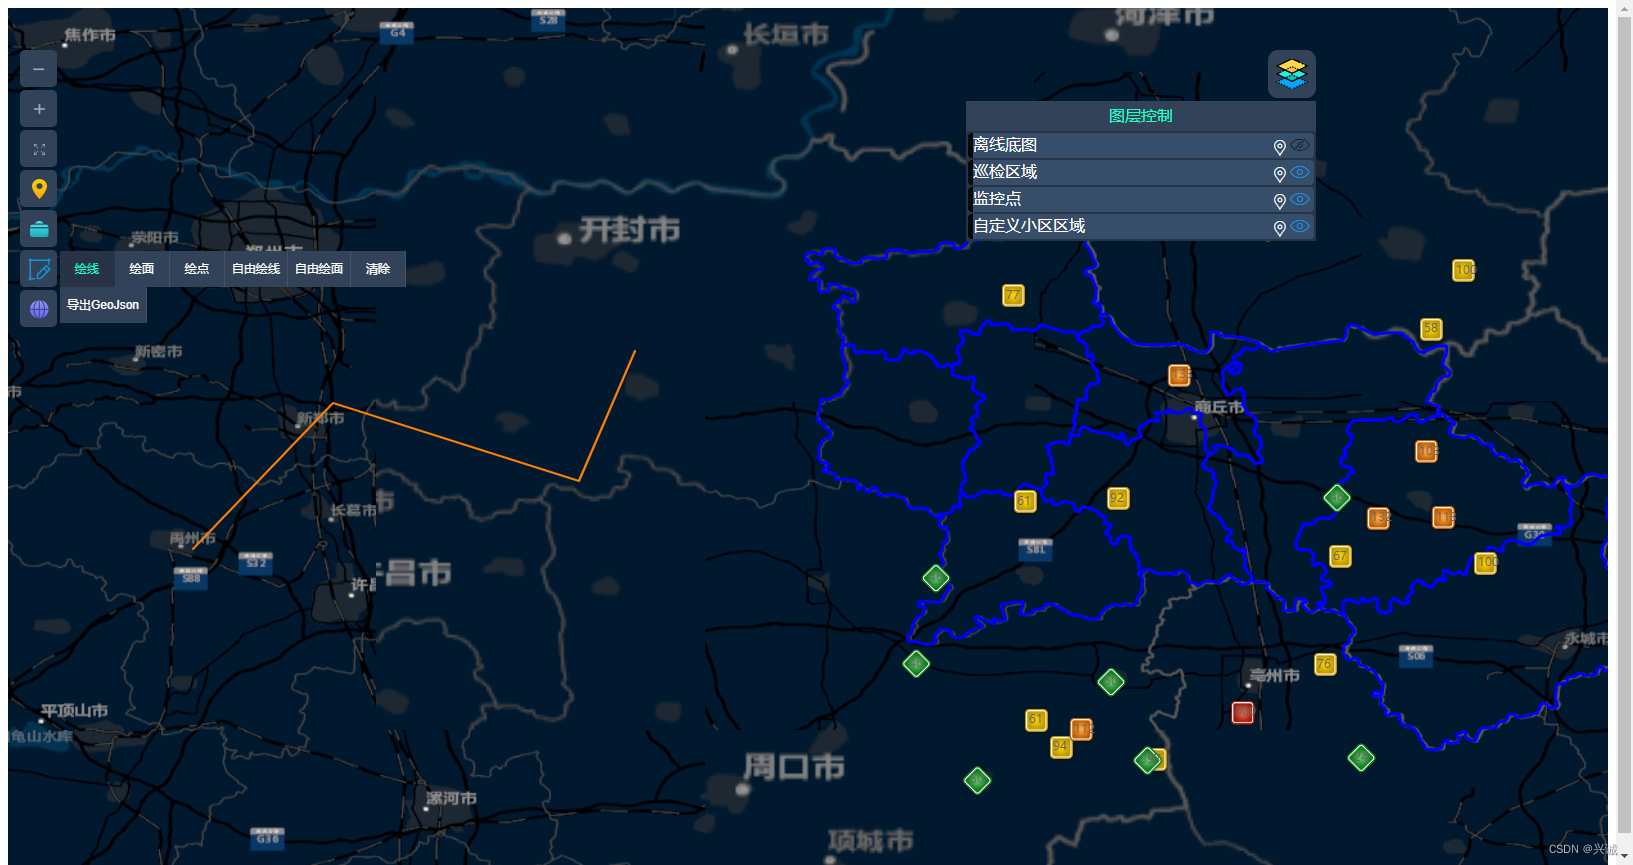
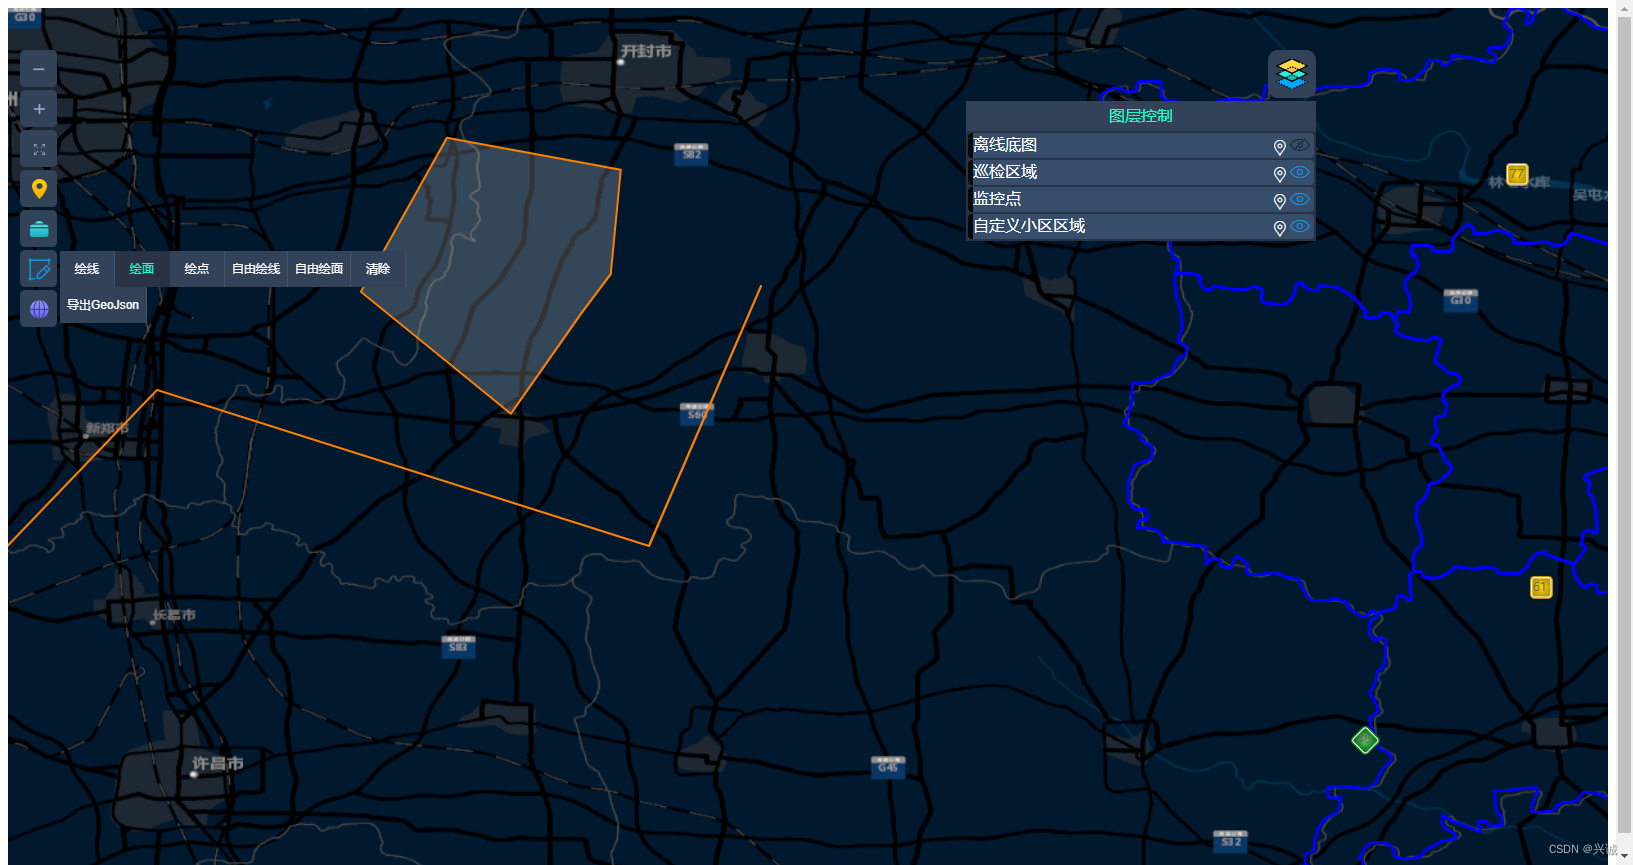
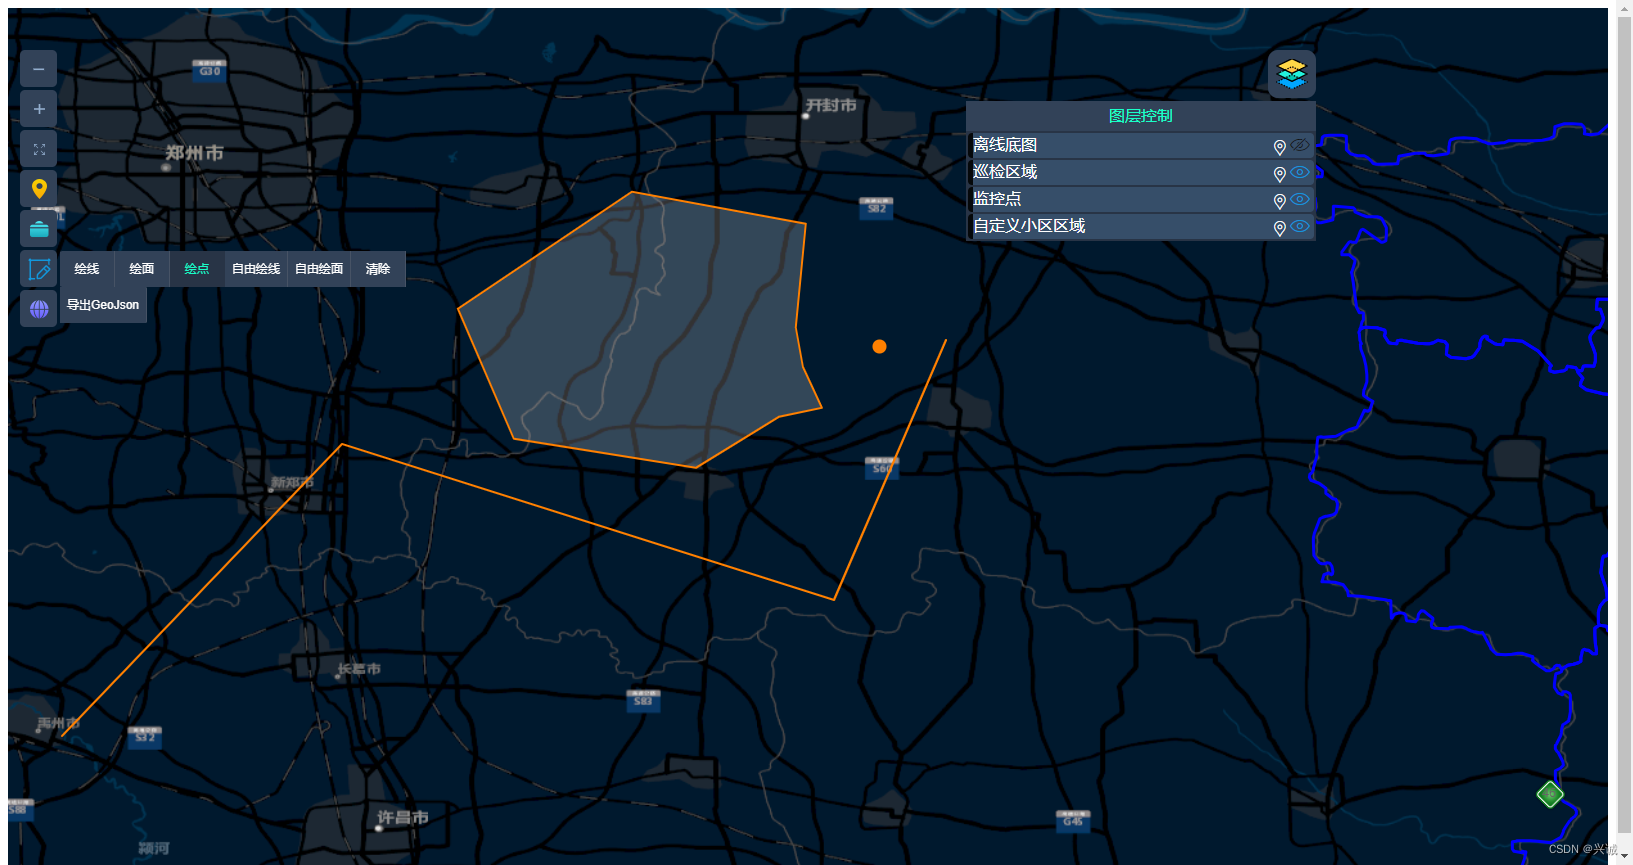
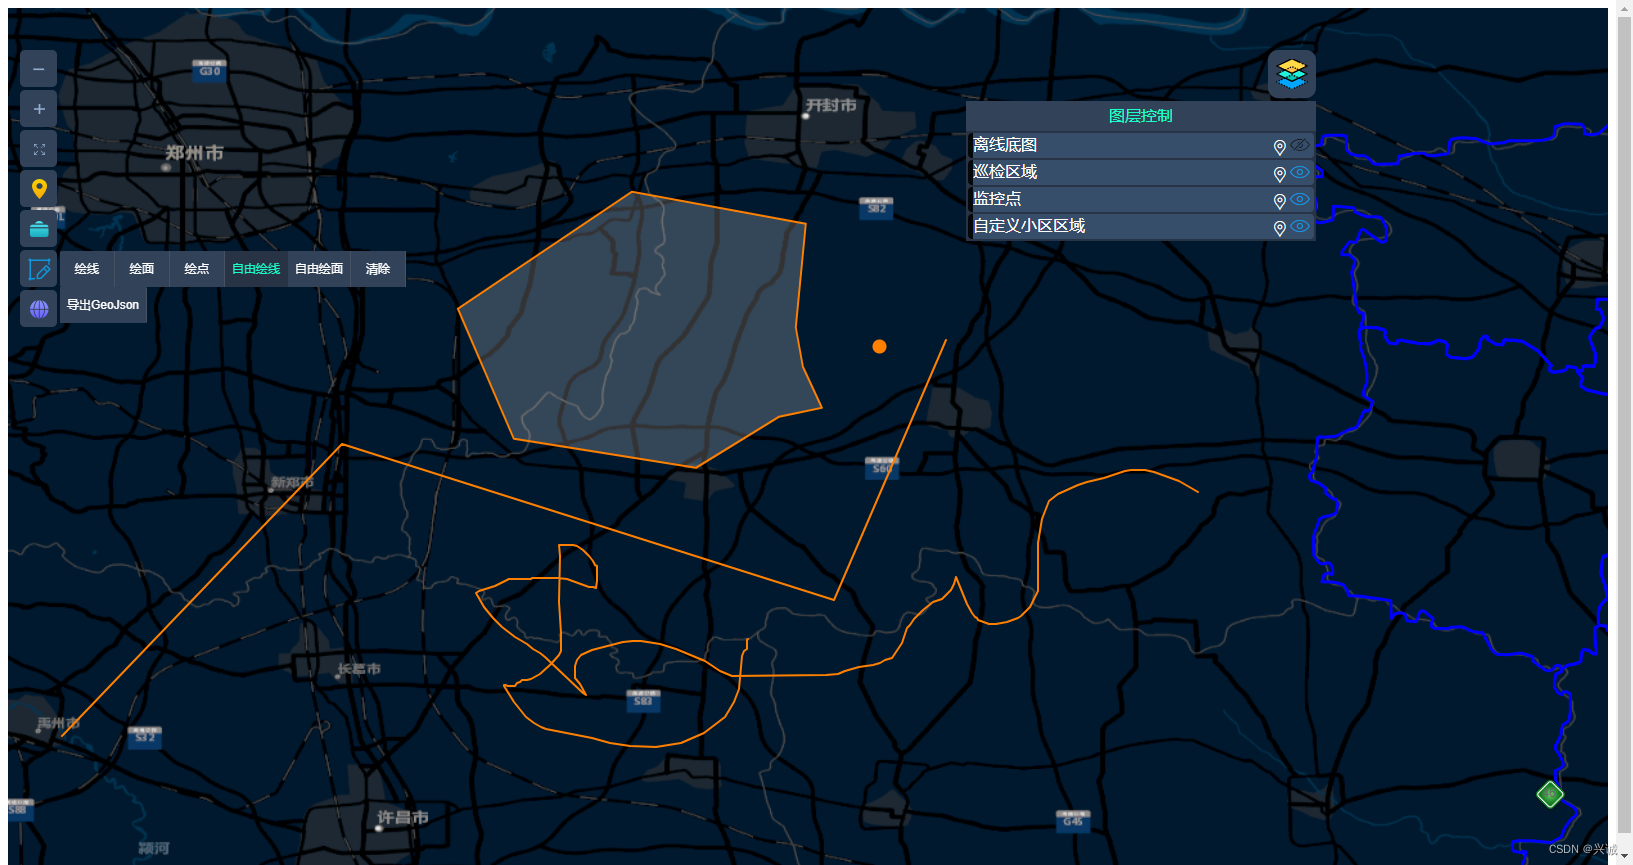
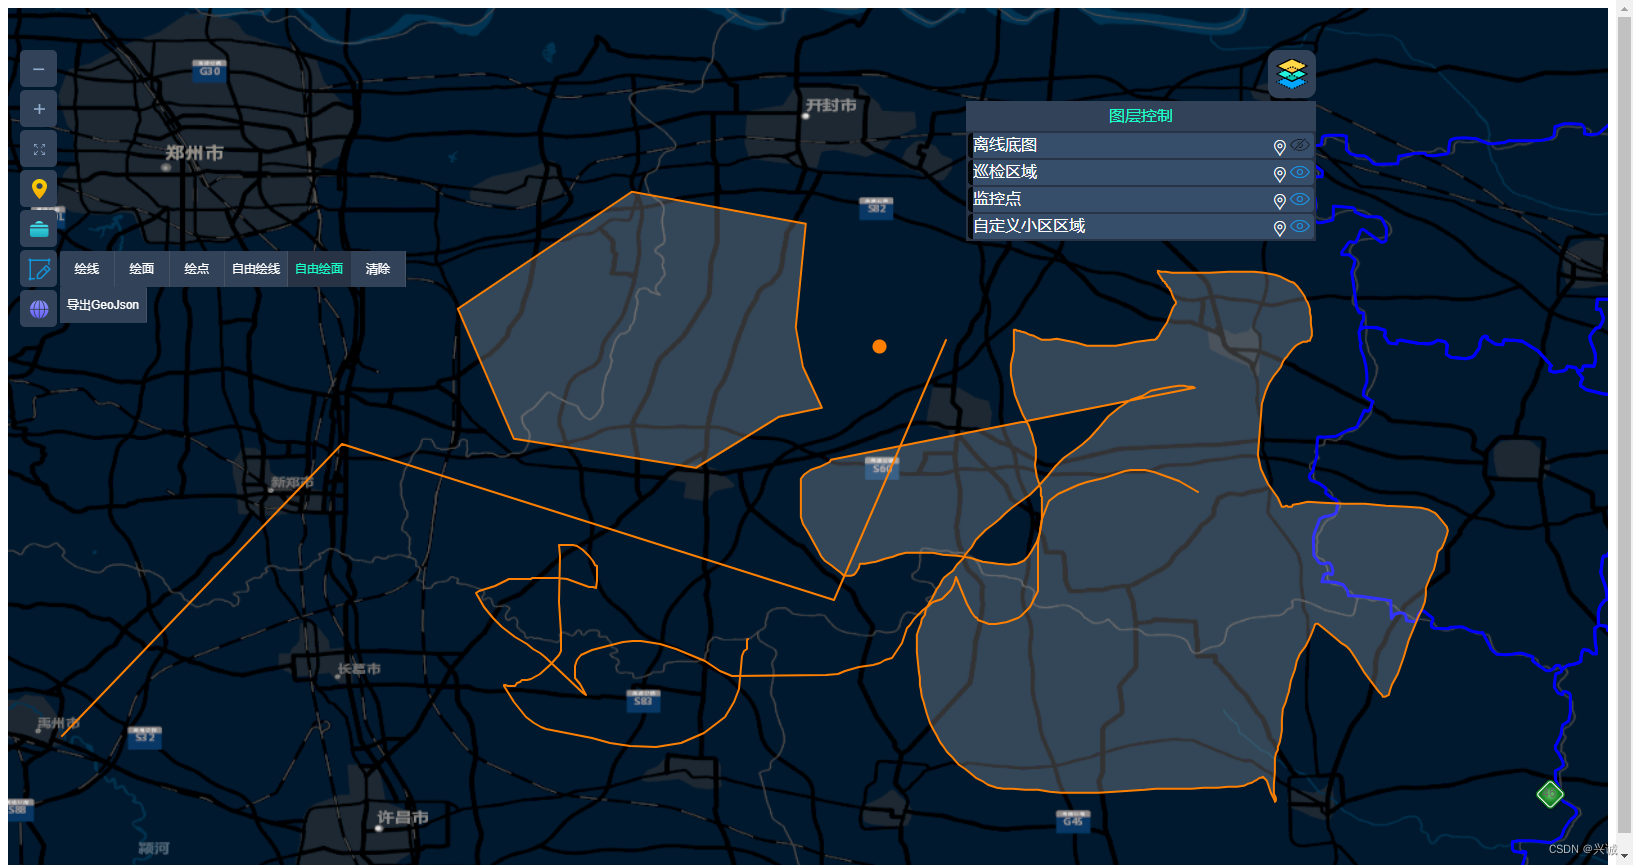
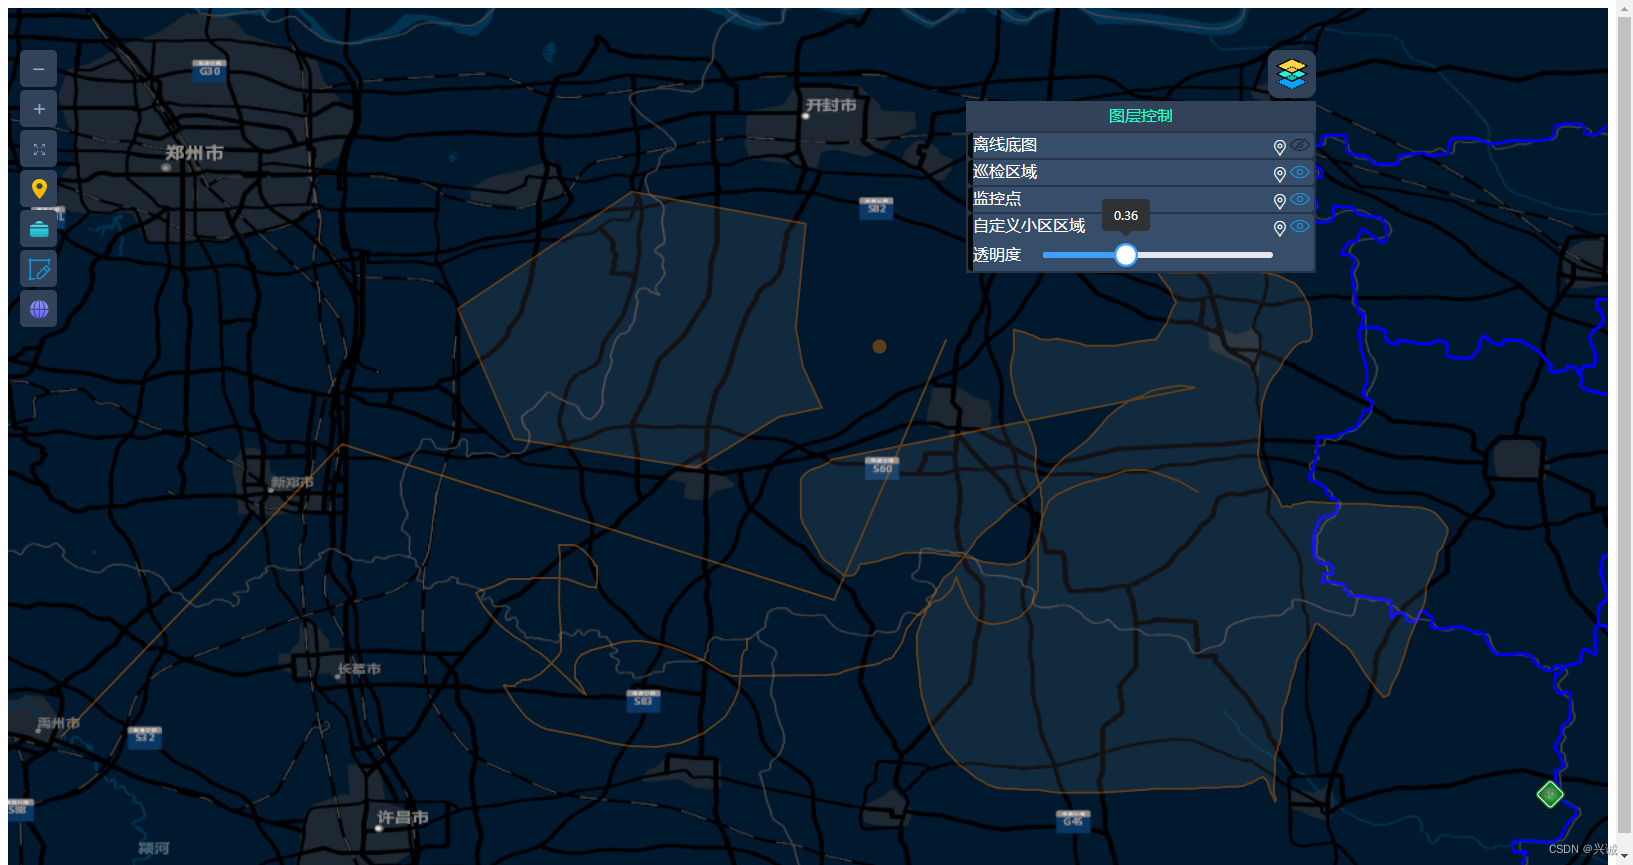
软件实现效果:

最后分享下地图下载器下载地址
通过百度网盘分享的文件:V-2.0jbr…
链接:https://pan.baidu.com/s/1AiFKTTknkEHkJ7t4nQ2P1g
提取码:8664
复制这段内容打开「百度网盘APP 即可获取」
如果对您有所帮助,请点赞打赏支持!
技术合作交流qq:2401315930


![C++初阶 | [十二] 模板进阶](https://img-blog.csdnimg.cn/direct/700f456bc95e4955b8f2550d32b84bcd.png)