一、背景:
写在前面:
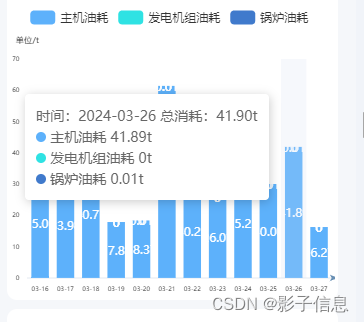
自行封装。一个可由多个柱形图叠加而成的图表,命名为someHoverLine(可自定义)。
下面罗列了移动端和web端的封装组件代码;
展示了vue2、uniapp、vue3的不同封装和使用案列。
二、问题描述:

三、解决办法:
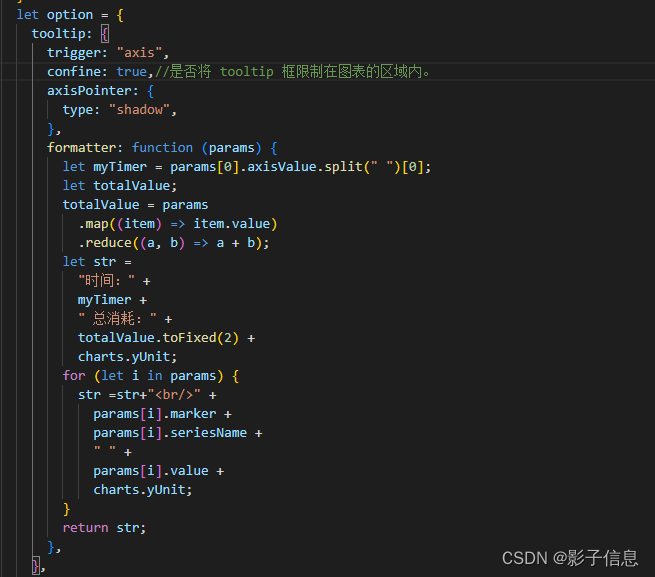
办法一:
tooltip: {
   confine: true,
}
实际代码:
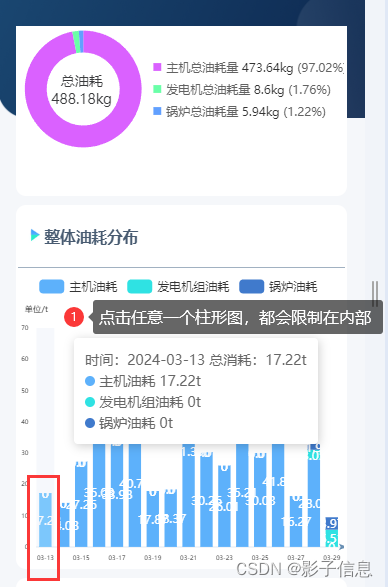
效果展示:
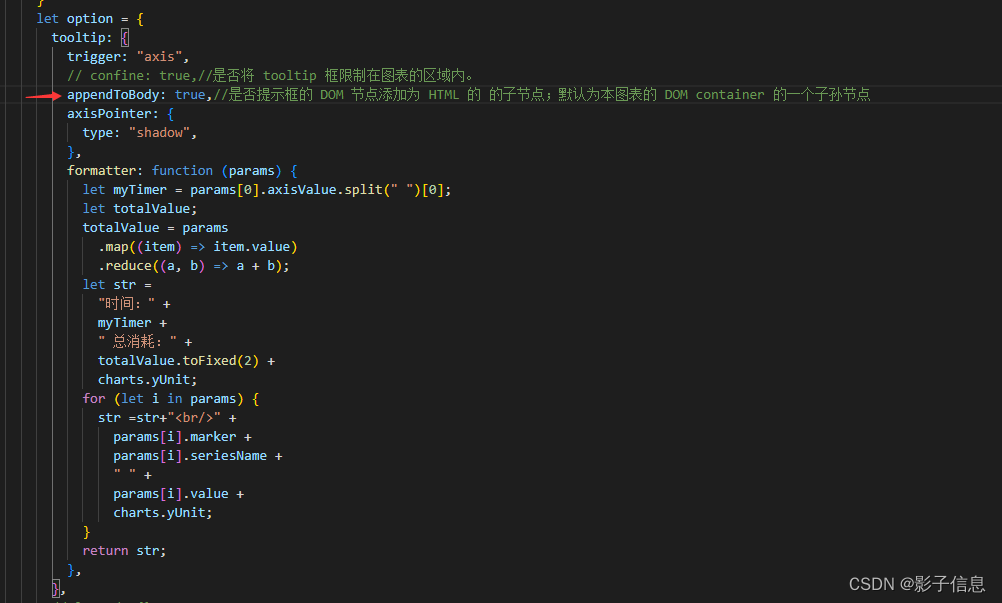
办法二:
tooltip: {
   appendToBody: true
},
实际代码:
实际效果:
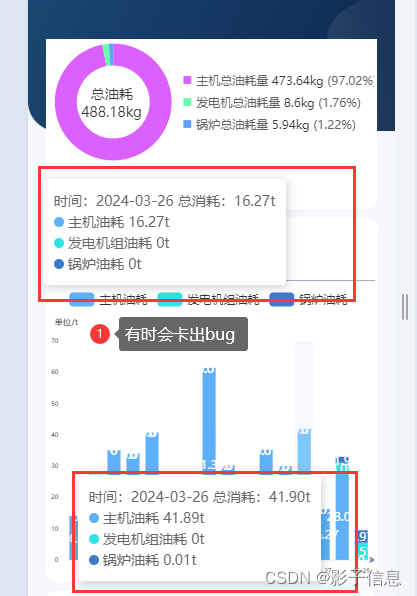
推荐使用第一种方法。。。
写到这儿就完毕了。
下面是封装的一个图表组件,一个由很多柱形图组成的叠加柱形图。。。
四、封装组件:
移动端:
效果展示:
移动端,vue2、uniapp写法:
封装组件:
//封装组件
//vue2、uniapp
<template>
  <view class="reMoreBar_home" :style="{ width: width, height: height }">
    <view
      ref="dbBarRef"
      :id="echartsId"
      :style="{ width: width, height: height }"
    ></view>
  </view>
</template>

<script module="echarts" lang="renderjs">
import { getAssetsFile, fontSize, nowResize } from "@/utils/index.js";
import * as echarts from "echarts";

let myEcharts;

export default {
  props: {
    echartsId: {
      type: String,
      default: "dbBarRef",
      required: true,
    },
    width: {
      type: String,
      default: "100%",
    },
    height: {
      type: String,
      default: "100%",
    },
    names: {
      type: Array,
      default: [
        // "蓄电池#1/Ah",
        // "蓄电池#2/Ah",
        // "蓄电池#3/Ah",
        // "蓄电池#4/Ah",
        // "蓄电池#5/Ah",
        // "蓄电池#6/Ah",
        // "蓄电池#7/Ah",
      ],
    },
    linxs: {
      type: Array,
      default: [
        // "2024-01-21 15:002",
        // "2024-01-21 15:01",
        // "2024-01-21 15:02",
        // "2024-01-21 15:03",
        // "2024-01-21 15:04",
        // "2024-01-21 15:05",
        // "2024-01-21 15:06",
        // "2024-01-21 15:07",
        // "2024-01-21 15:08",
        // "2024-01-21 15:09",
        // "2024-01-21 15:10",
        // "2024-01-21 15:11",
        // "2024-01-21 15:12",
        // "2024-01-21 15:13",
        // "2024-01-21 15:14",
        // "2024-01-21 15:15",
      ],
    },
    values: {
      type: Array,
      default: [
        // [
        //   580, 236, 217, 534, 580, 236, 217, 580, 151, 231, 0, 192, 453, 524, 165,
        //   0,
        // ],
        // [
        //   625, 345, 65, 192, 120, 180, 192, 80, 150, 153, 152, 128, 125, 625, 345,
        //   65,
        // ],
        // [
        //   4510, 352, 303, 534, 328, 159, 151, 192, 330, 151, 231, 192, 328, 159,
        //   151, 536,
        // ],
        // [
        //   120, 125, 0, 192, 120, 180, 0, 220, 125, 80, 192, 120, 125, 145, 65,
        //   125,
        // ],
        // [
        //   545, 80, 192, 330, 580, 236, 217, 328, 159, 151, 580, 236, 217, 524,
        //   165, 236,
        // ],
        // [
        //   360, 545, 360, 545, 80, 192, 80, 28, 625, 453, 80, 28, 625, 345, 65,
        //   105,
        // ],
        // [220, 125, 28, 625, 345, 65, 325, 80, 150, 153, 0, 128, 0, 220, 125, 80],
      ],
    },
    colors: {
      type: Array,
      default: [
        "rgba(266, 102, 304)",
        "rgba(0, 121, 202)",
        "rgba(247,220,111)",
        "rgba(0, 202, 104)",
        "rgba(909, 66, 22)",
        "rgba(100, 50, 102)",
        "rgba(147,120,211)",
        "rgba(245,107,184)",
        "rgba(35,172,201)",
        "rgba(66, 199, 102)",
        "rgba(241,148,138)",
        "rgba(130,182,220)",
      ],
    },
    xUnit: {
      type: String,
      default: "单位",
    },
    yUnit: {
      type: String,
      default: "单位",
    },
    // legendStyle: {
    //   type: Object,
    //   default: {
    //     fontSize: 12,
    //     color: "#000",
    //     top: "5%",
    //     left: "10%",
    //   },
    // },
    // 图表x,y轴定制
    xType: {
      type: String,
      default: "category",
    },
    unitX: {
      type: String,
      default: "",
    },
  },
  data() {
    return {
      myCharts: null,
    };
  },
  methods: {
    init() {
      let charts = {
        unit: this.yUnit || "数值",
        names: this.names,
        lineX: this.linxs,
        value: this.values,
        colors: this.colors,
        xType: this.xType,
        xUnit: this.xUnit,
        yUnit: this.yUnit,
      };
      let lineY = [];
      for (var i = 0; i < charts.names.length; i++) {
        let seriesItem = {
          name: charts.names[i],
          type: "bar",
          barMaxWidth: 36,
          stack: "Ad",
          emphasis: {
            focus: "series",
          },
          itemStyle: {
            // color: "#5CB1FF",
            color: charts.colors[i],
          },
          data: charts.value[i],
          label: {
            show: true,
            color: "#fff",
          },
        };
        lineY.push(seriesItem);
      }
      let option = {
        tooltip: {
          trigger: "axis",
          // confine: true,//是否将 tooltip 框限制在图表的区域内。
          appendToBody: true,//是否提示框的 DOM 节点添加为 HTML 的 的子节点;默认为本图表的 DOM container 的一个子孙节点
          axisPointer: {
            type: "shadow",
          },
          formatter: function (params) {
            let myTimer = params[0].axisValue.split(" ")[0];
            let totalValue;
            totalValue = params
              .map((item) => item.value)
              .reduce((a, b) => a + b);
            let str =
              "时间:" +
              myTimer +
              " 总消耗:" +
              totalValue.toFixed(2) +
              charts.yUnit;
            for (let i in params) {
              str =str+"<br/>" +
                params[i].marker +
                params[i].seriesName +
                " " +
                params[i].value +
                charts.yUnit;
            }
            return str;
          },
        },
        // legend: {},
        legend: {
          data: charts.names,
          type: "scroll",
          top: "2%",
          left: "5%",
          // left: "right",
          // icon: "circle",
        },
        dataZoom: [
          {
            type: "inside", //1平移 缩放。
            // zoomLock: true, //如果设置为 true 则锁定选择区域的大小,也就是说,只能平移,不能缩放。
            preventDefaultMouseMove: false,
          },
        ],
        grid: {
          left: "1%",
          right: "1%",
          bottom: "2%",
          containLabel: true,
        },
        xAxis: {
          name: charts.xType === "value" ? charts.xUnit : "",
          nameTextStyle: {
            color: "#000",
            fontSize: nowResize(24),
          },
          type: charts.xType,
          data: charts.lineX,
          // maxInterval: 3600 * 1000 * 24,
          boundaryGap: true, // 留白
          splitLine: {
            show: false,
            lineStyle: {
              type: "dotted",
              color: "rgba(255,255,255,0.2)",
            },
          },
          axisLabel: {
            color: "#000",
            fontSize: nowResize(32),
            symbol: [
              "none",
              "path://M5,20 L5,5 L8,8 L5,2 L2,8 L5,5 L5.3,6 L5.3,20",
            ],
            formatter: function (params) {
              // return params.split(" ")[0];
              // return params.replace(' ', '\n')
              let arr = params.split(" ");
              let space = "\n";
              // const myFormatter =
              //   arr[0]?.slice(5) + space + arr[1]?.substring(0, 5);
              const myFormatter = arr[0]?.slice(5);
              return myFormatter;
            },
          },
          axisLine: {
            symbol: ["none", "arrow"],
            symbolOffset: 6,
            symbolSize: [5, 8],
            lineStyle: {
              color: "rgba(104,143,179)",
              width: nowResize(1),
              type: "solid",
            },
          },
          axisTick: {
            show: false,
          },
        },
        yAxis: {
          name: charts.xType !== "value" ? `单位/${charts.yUnit}` : "单位/",
          nameTextStyle: {
            color: "#000",
            fontSize: nowResize(44),
          },
          type: charts.xType === "value" ? "category" : "value",
          minInterval: charts.xType !== "value" && 10,
          data: charts.lineX,
          splitLine: {
            lineStyle: {
              type: "dotted",
              color: "rgba(255,255,255,0.2)",
            },
          },
          axisLabel: {
            interval: 0,
            color: "#000",
            fontSize: nowResize(32),
            formatter: (value) => {
              return Math.ceil(value); // 向上取整,去除小数
            },
          },
          axisLine: {
            symbol: ["none", "arrow"],
            symbolOffset: 6,
            symbolSize: [5, 8],
            lineStyle: {
              color: "rgba(104,143,179)",
              width: nowResize(1),
              type: "solid",
            },
          },
          axisTick: {
            show: false,
          },
        },
        series: lineY, //接口数据
        // series: [
        //   {
        //     name: "Email",
        //     type: "bar",
        //     stack: "Ad",
        //     emphasis: {
        //       focus: "series",
        //     },
        //     itemStyle: {
        //       color: "#4279CA",
        //     },
        //     data: [
        //       120, 132, 101, 134, 90, 230, 210, 120, 132, 101, 134, 90, 230, 210,
        //     ],
        //     label: {
        //       show: true,
        //       textStyle: {
        //         color: "#fff",
        //       },
        //     },
        //   },
        //   {
        //     name: "Union Ads",
        //     type: "bar",
        //     stack: "Ad",
        //     emphasis: {
        //       focus: "series",
        //     },
        //     itemStyle: {
        //       color: "#2FE1E1",
        //     },
        //     data: [
        //       220, 182, 191, 234, 290, 330, 310, 120, 132, 101, 134, 90, 230, 210,
        //     ],
        //     label: {
        //       show: true,
        //       textStyle: {
        //         color: "#fff",
        //       },
        //     },
        //   },
        //   {
        //     name: "Video Ads",
        //     type: "bar",
        //     stack: "Ad",
        //     emphasis: {
        //       focus: "series",
        //     },
        //     itemStyle: {
        //       color: "#5CB1FF",
        //     },
        //     data: [
        //       150, 232, 201, 154, 190, 330, 410, 120, 132, 101, 134, 90, 230, 210,
        //     ],
        //     label: {
        //       show: true,
        //       textStyle: {
        //         color: "#fff",
        //       },
        //     },
        //   },
        // ],
      };
      option && this.myCharts && this.myCharts.setOption(option, true);
    },
    end() {
      this.myCharts && this.myCharts.dispose();
      window.removeEventListener("resize", function () {
        this.myCharts && this.myCharts.resize();
      });
      this.myCharts = null;
    },
  },
  mounted() {
    this.$nextTick(() => {
      this.myCharts = echarts.init(
        document.getElementById(this.echartsId),
        null,
        {
          renderer: "svg",
        }
      );
      window.addEventListener("resize", function () {
        this.myCharts && this.myCharts.resize();
      });
      this.init();
    });
  },
  beforeMount() {
    this.end();
  },
  watch: {
    option: {
      handler: function (newV, olgV) {
        this.myCharts.clear();
        this.init();
      },
      deep: true,
    },
    names: {
      handler: function (newV, olgV) {
        this.myCharts.clear();
        this.init();
      },
      deep: true,
    },
    linxs: {
      handler: function (newV, olgV) {
        this.myCharts.clear();
        this.init();
      },
      deep: true,
    },
    values: {
      handler: function (newV, olgV) {
        this.myCharts.clear();
        this.init();
      },
      deep: true,
    },
  },
};
</script>
<style lang="scss" scoped>
.reMoreBar_home {
  width: 100%;
  height: 100%;
  display: flex;
  justify-content: center;
  align-items: center;
  position: relative;

  #dbBarRef {
    width: calc(100vw - 13vw);
    height: 100%;
  }
}
</style>
组件使用案列:
//1.注册组件
//2.使用组件
//3.组件传参
                 <someHoverLine
                    echartsId="mainB"
                    :names="echartData.names"
                    :linxs="echartData.linxs"
                    :values="echartData.values"
                    :colors="echartData.colors"
                    :yUnit="echartData.yUnit"
                  />
this.echartData = {
yUnit: "t",
linxs: resTimeArr,
names: ["主机油耗", "发电机组油耗", "锅炉油耗"],
values: resNumArr,
colors: [
"rgba(93, 177, 251, 1)",
"rgba(47, 226, 227, 1)",
"rgba(64, 122, 204, 1)",
],
};
let resTimeArr= [
"2024-03-13",
"2024-03-14",
"2024-03-15",
"2024-03-16",
"2024-03-17",
"2024-03-18",
"2024-03-19",
"2024-03-20",
"2024-03-21",
"2024-03-22",
"2024-03-23",
"2024-03-24",
"2024-03-25",
"2024-03-26",
"2024-03-27",
"2024-03-28",
"2024-03-29"
]
let resNumArr = [
[
17.22,
14.08,
27.26,
35.03,
33.98,
40.75,
17.87,
18.37,
61.39,
30.26,
26.01,
35.21,
30.03,
41.89,
16.27,
28.02,
0
],
[
0,
0,
0.01,
0,
0,
0.01,
0,
0,
0.01,
0,
0,
0.01,
0,
0,
0,
3.05,
5.51
],
[
0,
0,
0,
0,
0.01,
0,
0,
0.01,
0.01,
0.01,
0,
0.01,
0.01,
0.01,
0,
1.9,
3.97
]
]备注:
解决了toolTips提示框显示不全的问题。
解决办法:
confine: true,//是否将 tooltip 框限制在图表的区域内。
web端:
效果展示:

封装组件:
//封装组件
//vue3 setup
<script setup>
import { Warning } from "@element-plus/icons-vue";
import { onMounted, onUnmounted, watch } from "vue";
import { getAssetsFile, fontSize } from "@/utils";
const _echarts = inject("$echarts");
const dbBarRef = ref(null);
const props = defineProps({
  width: {
    type: String,
    default: "100%",
  },
  height: {
    type: String,
    default: "100%",
  },
  names: {
    type: Array,
    default: [
      // "蓄电池#1/Ah",
      // "蓄电池#2/Ah",
      // "蓄电池#3/Ah",
      // "蓄电池#4/Ah",
      // "蓄电池#5/Ah",
      // "蓄电池#6/Ah",
      // "蓄电池#7/Ah",
    ],
  },
  linxs: {
    type: Array,
    default: [
      // "2024-01-21 15:002",
      // "2024-01-21 15:01",
      // "2024-01-21 15:02",
      // "2024-01-21 15:03",
      // "2024-01-21 15:04",
      // "2024-01-21 15:05",
      // "2024-01-21 15:06",
      // "2024-01-21 15:07",
      // "2024-01-21 15:08",
      // "2024-01-21 15:09",
      // "2024-01-21 15:10",
      // "2024-01-21 15:11",
      // "2024-01-21 15:12",
      // "2024-01-21 15:13",
      // "2024-01-21 15:14",
      // "2024-01-21 15:15",
    ],
  },
  values: {
    type: Array,
    default: [
      // [
      //   580, 236, 217, 534, 580, 236, 217, 580, 151, 231, 0, 192, 453, 524, 165,
      //   0,
      // ],
      // [
      //   625, 345, 65, 192, 120, 180, 192, 80, 150, 153, 152, 128, 125, 625, 345,
      //   65,
      // ],
      // [
      //   4510, 352, 303, 534, 328, 159, 151, 192, 330, 151, 231, 192, 328, 159,
      //   151, 536,
      // ],
      // [
      //   120, 125, 0, 192, 120, 180, 0, 220, 125, 80, 192, 120, 125, 145, 65,
      //   125,
      // ],
      // [
      //   545, 80, 192, 330, 580, 236, 217, 328, 159, 151, 580, 236, 217, 524,
      //   165, 236,
      // ],
      // [
      //   360, 545, 360, 545, 80, 192, 80, 28, 625, 453, 80, 28, 625, 345, 65,
      //   105,
      // ],
      // [220, 125, 28, 625, 345, 65, 325, 80, 150, 153, 0, 128, 0, 220, 125, 80],
    ],
  },
  colors: {
    type: Array,
    default: [
      "rgba(266, 102, 304)",
      "rgba(0, 121, 202)",
      "rgba(247,220,111)",
      "rgba(0, 202, 104)",
      "rgba(909, 66, 22)",
      "rgba(100, 50, 102)",
      "rgba(147,120,211)",
      "rgba(245,107,184)",
      "rgba(35,172,201)",
      "rgba(66, 199, 102)",
      "rgba(241,148,138)",
      "rgba(130,182,220)",
    ],
  },
  xUnit: {
    type: String,
    default: "单位",
  },
  yUnit: {
    type: String,
    default: "单位",
  },
  legendStyle: {
    type: Object,
    default: {
      fontSize: 12,
      color: "#000",
      top: "5%",
      left: "10%",
    },
  },
  // 图表x,y轴定制
  xType: {
    type: String,
    default: "category",
  },
  unitX: {
    type: String,
    default: "",
  },
});
let myEcharts;
onMounted(() => {
  nextTick(() => {
    myEcharts = _echarts.init(dbBarRef.value, null, {
      renderer: "svg",
    });
    window.addEventListener("resize", function () {
      myEcharts && myEcharts.resize();
    });
    _init();
  });
});
onUnmounted(() => {
  _end();
});
watch(
  () => props.names,
  (val) => {
    if (val) {
      nextTick(() => {
        _init();
      });
    }
  }
);
watch(
  () => props.linxs,
  (val) => {
    if (val) {
      nextTick(() => {
        _init();
      });
    }
  }
);
watch(
  () => props.values,
  (val) => {
    if (val) {
      nextTick(() => {
        _init();
      });
    }
  }
);
const _init = () => {
  let charts = {
    unit: props.yUnit || "数值",
    names: props.names,
    lineX: props.linxs,
    value: props.values,
    colors: props.colors,
    xType: props.xType,
    xUnit: props.xUnit,
    yUnit: props.yUnit,
  };
  let lineY = [];
  for (var i = 0; i < charts.names.length; i++) {
    let seriesItem = {
      name: charts.names[i],
      type: "bar",
      barMaxWidth: 36,
      stack: "Ad",
      emphasis: {
        focus: "series",
      },
      itemStyle: {
        // color: "#5CB1FF",
        color: charts.colors[i],
      },
      data: charts.value[i],
      label: {
        show: false,
        color: "#fff",
      },
    };
    lineY.push(seriesItem);
  }
  let option = {
    tooltip: {
      trigger: "axis",
      axisPointer: {
        type: "shadow",
      },
      formatter: function (params) {
        let myTimer = params[0].axisValue.split(" ")[0];
        let totalValue;
        totalValue = params.map((item) => item.value).reduce((a, b) => a + b);
        let str =
          "时间:" +
          myTimer +
          " 总消耗:" +
          totalValue.toFixed(2) +
          charts.yUnit;
        for (let i in params) {
          str =str+"<br/>" +
            params[i].marker +
            params[i].seriesName +
            " " +
            params[i].value +
            charts.yUnit;
        }
        // const marker1 = params[0].marker;
        // const seriesName1 = params[0].seriesName;
        // const myValue1 = params[0].value;
        // const marker2 = params[1].marker;
        // const seriesName2 = params[1].seriesName;
        // const myValue2 = params[1].value;
        // const marker3 = params[2].marker;
        // const seriesName3 = params[2].seriesName;
        // const myValue3 = params[2].value;
        // const str1 = marker1 + seriesName1 + " " + myValue1 + charts.yUnit;
        // const str2 = marker2 + seriesName2 + " " + myValue2 + charts.yUnit;
        // const str3 = marker3 + seriesName3 + " " + myValue3 + charts.yUnit;
        // const str =
        //   "时间:" +
        //   myTimer +
        //   " 总消耗:" +
        //   totalValue.toFixed(2) +
        //   charts.yUnit +
        //   "<br/>" +
        //   str +
        //   "<br/>" +
        //   str2 +
        //   "<br/>" +
        //   str3;
        return str;
      },
    },
    // legend: {},
    legend: {
      data: charts.names,
      type: "scroll",
      top: "5%",
      left: "75%",
      // left: "right",
      // icon: "circle",
    },
    grid: {
      left: "1%",
      right: "1%",
      bottom: "2%",
      containLabel: true,
    },
    xAxis: {
      name: charts.xType === "value" ? charts.xUnit : "",
      nameTextStyle: {
        color: "#000",
        fontSize: fontSize(12),
      },
      type: charts.xType,
      data: charts.lineX,
      // maxInterval: 3600 * 1000 * 24,
      boundaryGap: true, // 留白
      splitLine: {
        show: false,
        lineStyle: {
          type: "dotted",
          color: "rgba(255,255,255,0.2)",
        },
      },
      axisLabel: {
        color: "#000",
        fontSize: fontSize(16),
        symbol: [
          "none",
          "path://M5,20 L5,5 L8,8 L5,2 L2,8 L5,5 L5.3,6 L5.3,20",
        ],
        formatter: function (params) {
          // return params.split(" ")[0];
          // return params.replace(' ', '\n')
          let arr = params.split(" ");
          let space = "\n";
          // const myFormatter =
          //   arr[0]?.slice(5) + space + arr[1]?.substring(0, 5);
          const myFormatter = arr[0]?.slice(5);
          return myFormatter;
        },
      },
      axisLine: {
        symbol: ["none", "arrow"],
        symbolOffset: 6,
        symbolSize: [5, 8],
        lineStyle: {
          color: "rgba(104,143,179)",
          width: fontSize(1),
          type: "solid",
        },
      },
      axisTick: {
        show: false,
      },
    },
    yAxis: {
      name: charts.xType !== "value" ? `单位/${charts.yUnit}` : "单位/",
      nameTextStyle: {
        color: "#000",
        fontSize: fontSize(16),
      },
      type: charts.xType === "value" ? "category" : "value",
      minInterval: charts.xType !== "value" && 10,
      data: charts.lineX,
      splitLine: {
        lineStyle: {
          type: "dotted",
          color: "rgba(255,255,255,0.2)",
        },
      },
      axisLabel: {
        interval: 0,
        color: "#000",
        fontSize: fontSize(16),
        formatter: (value) => {
          return Math.ceil(value); // 向上取整,去除小数
        },
      },
      axisLine: {
        symbol: ["none", "arrow"],
        symbolOffset: 6,
        symbolSize: [5, 8],
        lineStyle: {
          color: "rgba(104,143,179)",
          width: fontSize(1),
          type: "solid",
        },
      },
      axisTick: {
        show: false,
      },
    },
    series: lineY, //接口数据
    // series: [
    //   {
    //     name: "Email",
    //     type: "bar",
    //     stack: "Ad",
    //     emphasis: {
    //       focus: "series",
    //     },
    //     itemStyle: {
    //       color: "#4279CA",
    //     },
    //     data: [
    //       120, 132, 101, 134, 90, 230, 210, 120, 132, 101, 134, 90, 230, 210,
    //     ],
    //     label: {
    //       show: true,
    //       textStyle: {
    //         color: "#fff",
    //       },
    //     },
    //   },
    //   {
    //     name: "Union Ads",
    //     type: "bar",
    //     stack: "Ad",
    //     emphasis: {
    //       focus: "series",
    //     },
    //     itemStyle: {
    //       color: "#2FE1E1",
    //     },
    //     data: [
    //       220, 182, 191, 234, 290, 330, 310, 120, 132, 101, 134, 90, 230, 210,
    //     ],
    //     label: {
    //       show: true,
    //       textStyle: {
    //         color: "#fff",
    //       },
    //     },
    //   },
    //   {
    //     name: "Video Ads",
    //     type: "bar",
    //     stack: "Ad",
    //     emphasis: {
    //       focus: "series",
    //     },
    //     itemStyle: {
    //       color: "#5CB1FF",
    //     },
    //     data: [
    //       150, 232, 201, 154, 190, 330, 410, 120, 132, 101, 134, 90, 230, 210,
    //     ],
    //     label: {
    //       show: true,
    //       textStyle: {
    //         color: "#fff",
    //       },
    //     },
    //   },
    // ],
  };
  option && myEcharts && myEcharts.setOption(option, true);
};
const _end = () => {
  myEcharts && myEcharts.dispose();
  window.removeEventListener("resize", function () {
    myEcharts && myEcharts.resize();
  });
  myEcharts = null;
};
</script>

<template>
  <div
    class="reMoreBar_home"
    :style="{ width: props.width, height: props.height }"
  >
    <div
      ref="dbBarRef"
      id="dbBarRef"
      :style="{ width: props.width, height: props.height }"
    ></div>
  </div>
</template>

<style lang="less" scoped>
.reMoreBar_home {
  width: 100%;
  height: 100%;
  display: flex;
  justify-content: center;
  align-items: center;
  position: relative;

  #dbBarRef {
    width: calc(100vw - 13vw);
    height: 100%;
  }
}
</style>
组件使用案列:
//vue3组件使用
<someHoverLine
            :names="data.echartData.names"
            :linxs="data.echartData.linxs"
            :values="data.echartData.values"
            :colors="data.echartData.colors"
            :yUnit="data.echartData.yUnit"
          />
//组件的参数
data.echartData = {
        yUnit: "kg",
        linxs: resTimeArr,
        names: ["主机油耗", "发电机组油耗", "锅炉油耗"],
        values: resNumArr,
        colors: [
          "rgba(93, 177, 251, 1)",
          "rgba(47, 226, 227, 1)",
          "rgba(64, 122, 204, 1)",
        ],
      };
//备注:resTimeArr、resNumArr同上