matplotlib 绘图
- 方便设置legend图例的位置
ax1.legend(loc=‘upper center’, bbox_to_anchor=(0.3, -0.1))
ax2.legend(loc=‘upper center’, bbox_to_anchor=(0.6, -0.1))
import numpy as np
import matplotlib.pyplot as plt
from scipy.stats import norm
from scipy.interpolate import make_interp_spline
# 不确定性分布数据
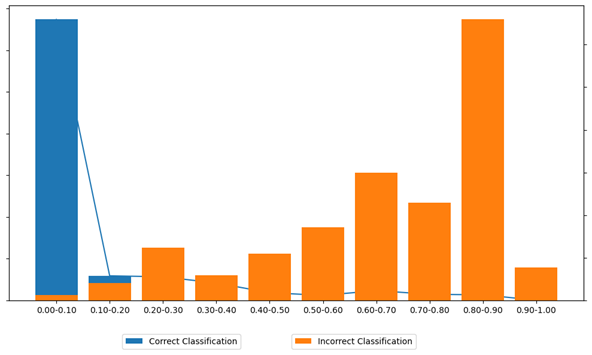
correct_samples={
    '0.00-0.10': 33692,
    '0.10-0.20': 2939,
    '0.20-0.30': 2815,
    '0.30-0.40': 2074,
    '0.40-0.50': 912,
    '0.50-0.60': 589,
    '0.60-0.70': 1162,
    '0.70-0.80': 721,
    '0.80-0.90': 655,
    '0.90-1.00': 14
}
incorrect_samples={
    '0.00-0.10': 13,
    '0.10-0.20': 40,
    '0.20-0.30': 124,
    '0.30-0.40': 59,
    '0.40-0.50': 110,
    '0.50-0.60': 171,
    '0.60-0.70': 300,
    '0.70-0.80': 229,
    '0.80-0.90': 659,
    '0.90-1.00': 77
}
# 计算区间的数量和标签
labels = list(correct_samples.keys())
correct_counts = list(correct_samples.values())
incorrect_counts = list(incorrect_samples.values())

# 创建图表和第一个轴
fig, ax1 = plt.subplots(figsize=(10, 6))
rects = ax1.bar(labels, correct_counts, label='Correct Classification', color='#1f77b4')
# 获取条形的中心点坐标
x = [rect.get_x() + rect.get_width() / 2 for rect in rects]
y = correct_counts
# 绘制点之间的连线
ax1.plot(x, y, linestyle='-', color='#1f77b4')
# ax1.set_xlabel('Uncertainty Interval')
# ax1.set_ylabel('Number of Correct Samples', color='b')
# ax1.tick_params('y', colors='b')
# 隐藏 y 轴的刻度标签
ax1.set_yticklabels([])
# 创建第二个轴
ax2 = ax1.twinx()
rects2 = ax2.bar(labels, incorrect_counts, label='Incorrect Classification', color='#ff7f0e')
x = [rect.get_x() + rect.get_width() / 2 for rect in rects2]
y = incorrect_counts
ax2.set_yticklabels([])
# 显示图例在中间位置并避免被覆盖
ax1.legend(loc='upper center', bbox_to_anchor=(0.3, -0.1))
ax2.legend(loc='upper center', bbox_to_anchor=(0.6, -0.1))
plt.grid(False)
plt.tight_layout()
plt.show()






![状态压缩dp[详解 + 例题]](https://img-blog.csdnimg.cn/direct/ccc04e0d664143608f64d693908e1eac.png)
