Dijkstra 算法可在 Python 库 OSMNX 中实现,可用于查找两个位置之间按距离或时间加权的最短路径。该算法使用 OpenStreetMap (OSM) 网络来驾驶、步行或骑自行车,并在后台使用 Python 库 NETWORKX 查找路线。
编码练习
正如我提到的,我将做一个分步指南,所以让我们开始吧。首先让我们导入所需的库
import osmnx as ox
import geopandas as gpd
from shapely.geometry import Point, LineString
import pandas as pd
import matplotlib.pyplot as plt
1. 定义出发地和目的地
简单地说,我们将创建几何对象作为点:
# origin and destination geom

origin_geom = Point(-5.6613932957355715, 32.93210288339607)

destination_geom = Point(-3.3500597061072726, 34.23038027794419)
2. 获取OSM Graph对象
然后,我们将提取将用于生成最短路径的图。让我们一步一步来看看。
- 从起点和终点创建 GeoDataFrame
# create origin dataframe
origin =  gpd.GeoDataFrame(columns = ['name', 'geometry'], crs = 4326, geometry = 'geometry')
origin.at[0, 'name'] = 'origin'
origin.at[0, 'geometry'] =origin_geom

# create destination dataframe
destination =  gpd.GeoDataFrame(columns = ['name', 'geometry'], crs = 4326, geometry = 'geometry')
destination.at[0, 'name'] = 'destination'
destination.at[0, 'geometry'] = destination_geom- 获取包含出发地和目的地的图表
我们将使用 Geopandas 中的函数Envelope来使用多边形作为掩码来获取图形。
首先是一个简单的功能。
def get_graph_from_locations(origin, destination, network='drive'):
    '''
    network_type as drive, walk, bike
    origin gdf 4326
    destination gdf 4326
    '''
    # combine and area buffer
    combined = pd.concat([origin, destination])

    convex = combined.unary_union.envelope # using envelope instead of convex, otherwise it breaks the unary_union

    graph_extent = convex.buffer(0.02)

    graph = ox.graph_from_polygon(graph_extent, network_type= network)

    return graph
然后,使用它并绘制结果。
graph = get_graph_from_locations(origin, destination)fig, ax = ox.plot_graph(graph, node_size=0, edge_linewidth=0.2)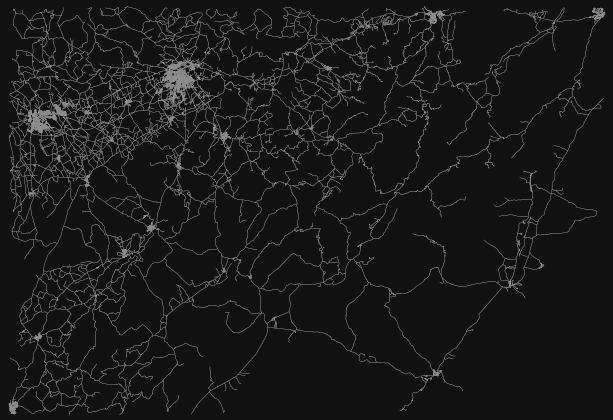
图片由作者提供。图表包含出发地和目的地
3. 查找最近的出发地和目的地节点
使用起始位置和目标位置获取属于网络一部分的最近节点。可以使用 osmnx 函数获取节点的代码。
# ------------- get closest nodes

# origin
closest_origin_node = ox.nearest_nodes(G=graph,
                                       X=origin_geom.x,
                                       Y=origin_geom.y)

# destination
closest_destination_node = ox.nearest_nodes(G=graph,
                                           X=destination_geom.x,
                                           Y=destination_geom.y)
您可以检查并注意到我们目前只有代码。
4. 寻找最短路径
然后,利用最短路径函数来获取路径。
# run
route = ox.shortest_path(graph,
                         orig = closest_origin_node,
                         dest = closest_destination_node,
                         weight = 'length')
这将返回一堆作为路由一部分的节点代码。

图片来自AuthorNode的代码
5. 从节点创建线几何图形
我们将从图中提取节点的几何图形并创建表示最短路径的 LineString 几何图形
首先是一个用于此的函数。
def nodes_to_route(graph_nodes, path_nodes):

    # Extract the route nodes of the graph
    route_nodes = graph_nodes.loc[path_nodes]

    # ---> note! If you have more routes, check for each one, to be removed in length is 1.  A path can not be built with only 1 node.

    # Create a LineString out of the route
    list_geom = route_nodes.geometry.to_list()
    path = LineString(list_geom)

    # Append the result into the GeoDataFrame
    route_df = gpd.GeoDataFrame( [[path]] )

    # Add a column name
    route_df.columns = ['geometry']

    # Set geometry
    route_df = route_df.set_geometry('geometry')

    # Set coordinate reference system
    route_df.crs = graph_nodes.crs

    # remove nans
    route_df = route_df.dropna(subset=['geometry'])

    return route_df
获取节点,并在函数中使用它们。
# get all network nodes
graph_nodes = ox.graph_to_gdfs(graph, edges=False)

# get the line geometries from osm nodes
route_gdf = nodes_to_route(graph_nodes, route)
6. 计算距离
我们将使用墨卡托投影以米为单位测量路线。如果您想要更准确的信息,可以使用位置投影。
首先,为此提供一个函数。
def compute_distance(shortest_path_gdf):
    '''
    Compute distance in EPSG:3387

    '''

    # project WGS84 to EPSG3387
    distances = shortest_path_gdf.to_crs("EPSG:3387").geometry.length

    # add
    shortest_path_gdf['distance'] = distances

    return shortest_path_gdf
然后,使用它:
# calculate distance m
route_distance_gdf = compute_distance(route_gdf)
它将测量大约 351.243 米的路线。
7. 保存网络和路径
将地图的网络和路径保存在本地磁盘中。
获取网络并定义 GeoDataFrame:
# fetch network
network = ox.graph_to_gdfs(graph, nodes=False)

# get only needed columns
network_gdf = network.reset_index(drop=True)[['geometry']]
然后存储:
network_gdf.to_file( r'osm_network.gpkg' )
route_distance_gdf.to_file( r'osm_shortest_path.gpkg' )
您可以使用此数据来创建您自己的地图。例如QGIS中的这个:
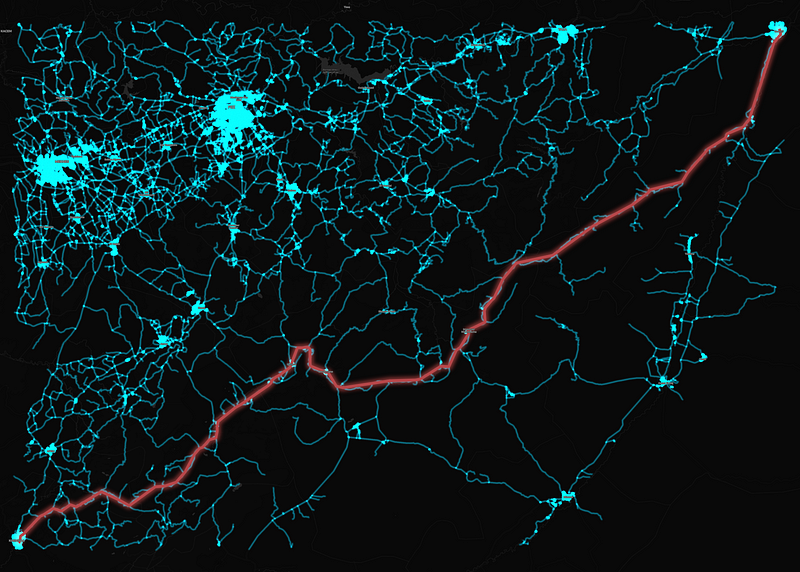
图片由作者提供。 QGIS中的最短路径和网络
8. 绘制结果
我们将通过绘制所有元素来检查我们的工作是否正确。
# plot network
ax = network_gdf.plot(figsize=(12, 10), linewidth = 0.2, color='grey', zorder=0);

# origin and destination
origin.plot(ax=ax, markersize=46, alpha=0.8, color='blue', zorder=1)
destination.plot(ax=ax, markersize=46, alpha=0.8, color='green', zorder=2)

# route
route_distance_gdf.plot(ax=ax, linewidth = 3, color='red', alpha=0.4, zorder=3)

plt.axis(False);
结果就这么简单。
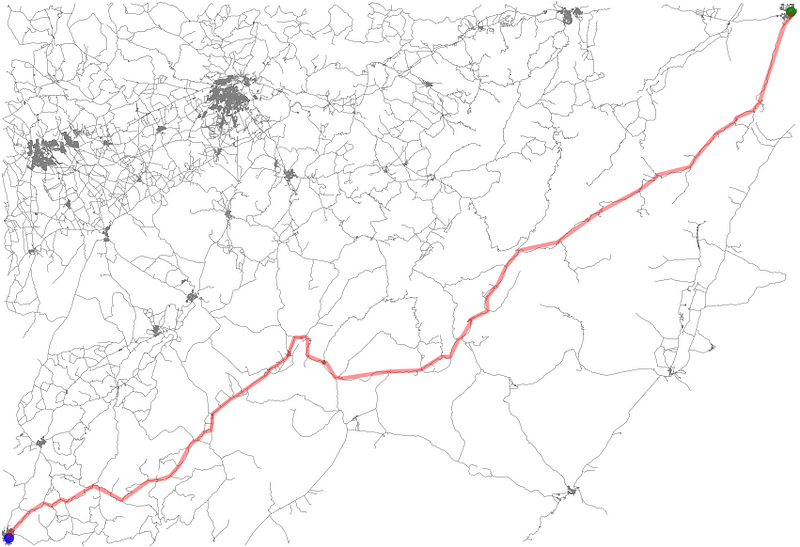
图片由作者提供。 Matplotlib 中的最短路径、网络、起点和终点


![[自研开源] 数据集成之分批传输 v0.7](https://img-blog.csdnimg.cn/direct/cc203271f1e94b9186cd195781d39c03.png)

