vue+Element UI项目中数据分析功能需要用到圆环图 折线图 饼图 柱状图等,可视化图形分析
安装流程及示例
1.安装依赖
npm install echarts --save
2.在main.js中引入并挂载echarts
import echarts from 'echarts'
Vue.prototype.$echarts = echarts
3.在需要使用echarts的页面引入echarts
import * as echarts from 'echarts'
4.在需要显示echarts地方引用以上定义的chart
<div id="myChartjw" :style="{ width: '366px', height: '30px' }"></div>
5.在 mounted中加载echarts定义的方法
  mounted(){
      this.progressBar()
  },
6.在methods方法中定义一个方法,并在此方法中写echarts代码
  progressBar() {
            var chartDom4 = document.getElementById("myChartjw");
            var myChart4 = echarts.init(chartDom4);
            var option = {
                title: {
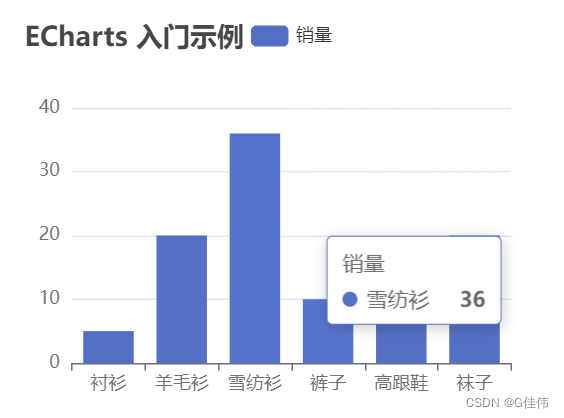
                    text: 'ECharts 入门示例'
                },
                tooltip: {},
                legend: {
                    data: ['销量']
                },
                xAxis: {
                    data: ['衬衫', '羊毛衫', '雪纺衫', '裤子', '高跟鞋', '袜子']
                },
                yAxis: {},
                series: [
                    {
                        name: '销量',
                        type: 'bar',
                        data: [5, 20, 36, 10, 10, 20]
                    }
                ]
            };
            option && myChart4.setOption(option);
        },
实现效果


![[office] EXCEL怎么制作大事记图表- #学习方法#其他](https://img-blog.csdnimg.cn/img_convert/4da21016c26200855505d9d7541ad3f9.jpeg)


