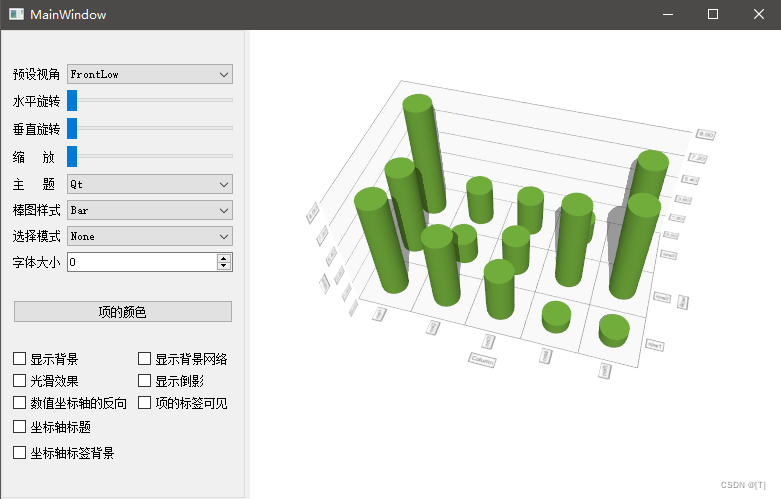
Data Visualization的三维显示功能主要有三种三维图形来实现,三各类的父类都是QAbstract3DGraph,从QWindow继承而来。这三类分别是:
三维柱状图Q3DBar 三维空间散点Q3DScatter 三维曲面Q3DSurface QWindow
QAbstract3DGraph
Q3DBar
Q3DScatter
Q3DSurface
QAbstract3DSeries
	QBar3DSeries
	QScatter3DSeries
	QSurface3DSeries
QAbstract3DAxis
	QCategory3DAxis
	QValue3DAxis
数据代理类与序列对应,用于存储序列的数据的类。
QAbstractDataProxy
	QBarDataProxy
		QItemModelBarDataProxy
	QScatterDataProxy
		QItemModelScatterDataProxy
	QSurfaceDataProxy
		QHeightMapSurfaceDataProxy
		QItemModelSurfaceDataProxy
QT += datavisualization
using namespace QtDataVisualization;
MainWindow::MainWindow( QWidget *parent) :
QMainWindow( parent) ,
ui( new Ui::MainWindow)
{
ui-> setupUi( this) ;
QSplitter *splitter = new QSplitter( Qt::Horizontal) ;
splitter-> addWidget( ui-> groupBox) ;
initGraph3D( ) ;
splitter-> addWidget( createWindowContainer( graph3D)) ;
setCentralWidget( splitter) ;
}
MainWindow::~MainWindow ( )
{
delete ui;
}
void MainWindow::initGraph3D ( )
{
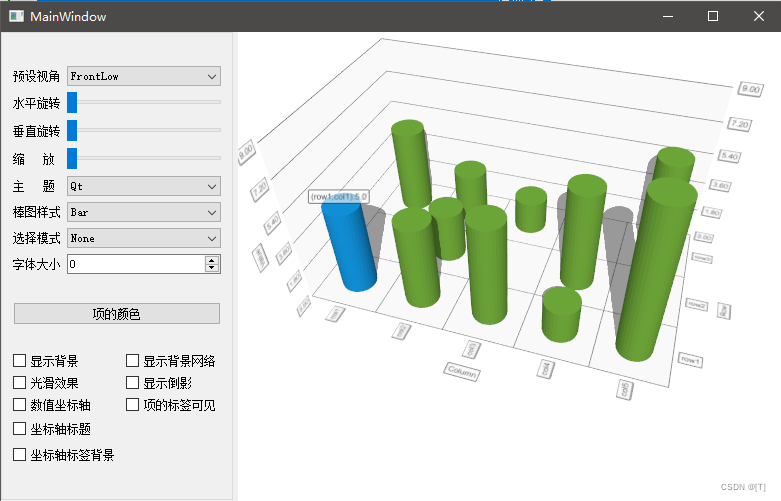
graph3D = new Q3DBars;
// 创建坐标系统
QStringList rowLabs, colLabs;
rowLabs << "row1" << "row2" << "row3" ;
colLabs << "col1" << "col2" << "col3" << "col4" << "col5" ;
QValue3DAxis *axisV = new QValue3DAxis;
axisV-> setTitle( "Value" ) ;
axisV-> setTitleVisible( true) ;
QCategory3DAxis * axisCol = new QCategory3DAxis;
axisCol-> setTitle( "Column" ) ;
axisCol-> setTitleVisible( true) ;
axisCol-> setLabels( colLabs) ;
QCategory3DAxis * axisRow = new QCategory3DAxis;
axisRow-> setTitle( "Row" ) ;
axisRow-> setTitleVisible( true) ;
axisRow-> setLabels( rowLabs) ;
graph3D-> setValueAxis( axisV) ;
graph3D-> setColumnAxis( axisCol) ;
graph3D-> setRowAxis( axisRow) ;
// 创建数据序列
QBar3DSeries *series = new QBar3DSeries;
series-> setMesh( QAbstract3DSeries::MeshCylinder) ; // 形状
series-> setItemLabelFormat( "(@rowLabel,@colLabel):%.1f" ) ;
// 添加数据
QBarDataArray *dataArray = new QBarDataArray;
dataArray-> reserve( rowLabs.count( )) ; // 三行数据
qsrand( QTime::currentTime( ) .second( )) ;
for ( int i = 0 ; i < rowLabs.count( ) ; ++i)
{
QBarDataRow *dataRow = new QBarDataRow;
for ( int j = 0 ; j < 5 ; ++j)
{
( *dataRow) << ( qrand( ) % 10 ) ;
}
dataArray-> append( dataRow) ;
}
series-> dataProxy( ) -> resetArray( dataArray) ;
graph3D-> addSeries( series) ;
}
void MainWindow::on_cboxCarmera_currentIndexChanged( int index)
{
graph3D-> scene( ) -> activeCamera( ) -> setCameraPreset( Q3DCamera::CameraPreset( index)) ;
}
void MainWindow::on_hSliderLevel_valueChanged( int value)
{
Q_UNUSED( value) ;
int xRot = ui-> hSliderLevel-> value( ) ;
int yRot = ui-> hSliderVertical-> value( ) ;
int zoom = ui-> hSliderScale-> value( ) ;
graph3D-> scene( ) -> activeCamera( ) -> setCameraPosition( xRot, yRot, zoom) ;
}
void MainWindow::on_hSliderVertical_valueChanged( int value)
{
Q_UNUSED( value) ;
int xRot = ui-> hSliderLevel-> value( ) ;
int yRot = ui-> hSliderVertical-> value( ) ;
int zoom = ui-> hSliderScale-> value( ) ;
graph3D-> scene( ) -> activeCamera( ) -> setCameraPosition( xRot, yRot, zoom) ;
}
void MainWindow::on_hSliderScale_valueChanged( int value)
{
Q_UNUSED( value) ;
int xRot = ui-> hSliderLevel-> value( ) ;
int yRot = ui-> hSliderVertical-> value( ) ;
int zoom = ui-> hSliderScale-> value( ) ;
graph3D-> scene( ) -> activeCamera( ) -> setCameraPosition( xRot, yRot, zoom) ;
}
void MainWindow::on_cboxTheme_currentIndexChanged( int index)
{
graph3D-> activeTheme( ) -> setType( Q3DTheme::Theme( index)) ;
}
void MainWindow::on_cboxStyle_currentIndexChanged( int index)
{
QBar3DSeries *series = graph3D-> seriesList( ) .at( 0 ) ;
series-> setMesh( QAbstract3DSeries::Mesh( index)) ;
}
void MainWindow::on_cboxMode_currentIndexChanged( int index)
{
graph3D-> setSelectionMode( QAbstract3DGraph::SelectionFlags( index)) ;
}
void MainWindow::on_spinBoxFontSize_valueChanged( int arg1)
{
QFont font = graph3D-> activeTheme( ) -> font( ) ;
font.setPointSize( arg1) ;
graph3D-> activeTheme( ) -> setFont( font) ;
}
void MainWindow::on_btnItemColor_clicked ( )
{
QBar3DSeries *series = graph3D-> seriesList( ) .at( 0 ) ;
QColor color = series-> baseColor( ) ;
color = QColorDialog::getColor( color) ;
if( color.isValid( ))
{
series-> setBaseColor( color) ;
}
}
void MainWindow::on_checkBoxBack_clicked( bool checked)
{
graph3D-> activeTheme( ) -> setBackgroundEnabled( checked) ;
}
void MainWindow::on_checkBoxBackNetwork_clicked( bool checked)
{
graph3D-> activeTheme( ) -> setGridEnabled( checked) ;
}
void MainWindow::on_checkBoxSmooth_clicked( bool checked)
{
QBar3DSeries *series = graph3D-> seriesList( ) .at( 0 ) ;
series-> setMeshSmooth( checked) ;
}
void MainWindow::on_checkBoxReflection_clicked( bool checked)
{
graph3D-> setReflection( checked) ;
}
void MainWindow::on_checkBoxValueAxis_clicked( bool checked)
{
graph3D-> valueAxis( ) -> setReversed( checked) ;
}
void MainWindow::on_checkBoxItemLabel_clicked( bool checked)
{
QBar3DSeries *series = graph3D-> seriesList( ) .at( 0 ) ;
series-> setItemLabelVisible( checked) ;
}
void MainWindow::on_checkBoxAxisBack_clicked( bool checked)
{
graph3D-> valueAxis( ) -> setTitleVisible( checked) ;
graph3D-> rowAxis( ) -> setTitleVisible( checked) ;
graph3D-> columnAxis( ) -> setTitleVisible( checked) ;
}
void MainWindow::on_checkBoxAxisLabelBack_clicked( bool checked)
{
graph3D-> activeTheme( ) -> setLabelBackgroundEnabled( checked) ;
}
MainWindow::MainWindow( QWidget *parent) :
QMainWindow( parent) ,
ui( new Ui::MainWindow)
{
ui-> setupUi( this) ;
QSplitter *splitter = new QSplitter( Qt::Horizontal) ;
splitter-> addWidget( ui-> groupBox) ;
initGraph3D( ) ;
splitter-> addWidget( createWindowContainer( graph3D)) ;
setCentralWidget( splitter) ;
}
MainWindow::~MainWindow ( )
{
delete ui;
}
void MainWindow::initGraph3D ( )
{
graph3D = new Q3DScatter;
// 创建坐标系统
graph3D-> axisX( ) -> setTitle( "X轴" ) ;
graph3D-> axisX( ) -> setTitleVisible( true) ;
graph3D-> axisY( ) -> setTitle( "Y轴" ) ;
graph3D-> axisY( ) -> setTitleVisible( true) ;
graph3D-> axisZ( ) -> setTitle( "Z轴" ) ;
graph3D-> axisZ( ) -> setTitleVisible( true) ;
// 创建数据序列
QScatterDataProxy *porxy = new QScatterDataProxy;
QScatter3DSeries *series = new QScatter3DSeries( porxy) ;
// series-> setMesh( QAbstract3DSeries::MeshCylinder) ; // 形状
series-> setItemLabelFormat( "(@rowLabel,@colLabel):%.1f" ) ;
series-> setItemSize( 0.2 ) ;
graph3D-> addSeries( series) ;
// 添加数据
int N = 41 ;
QScatterDataArray *dataArray = new QScatterDataArray;
dataArray-> resize( N * N) ;
QScatterDataItem *item = & dataArray-> first( ) ;
// 摩西跟草帽算法
float x, y, z;
x = -10;
for ( int i = 0 ; i < N; ++i)
{
y = -10;
for ( int j = 1 ; j <= N; ++j)
{
z = qSqrt( x * x + y * y) ;
if( z != 0 )
{
z = 10 * qSin( z) / z;
}
else
{
z = 10 ;
}
// 图形库的坐标系
item-> setPosition( QVector3D( x, z, y)) ;
item++;
y += 0.5 ;
}
x += 0.5 ;
}
series-> dataProxy( ) -> resetArray( dataArray) ;
}
void MainWindow::on_cboxCarmera_currentIndexChanged( int index)
{
graph3D-> scene( ) -> activeCamera( ) -> setCameraPreset( Q3DCamera::CameraPreset( index)) ;
}
void MainWindow::on_hSliderLevel_valueChanged( int value)
{
Q_UNUSED( value) ;
int xRot = ui-> hSliderLevel-> value( ) ;
int yRot = ui-> hSliderVertical-> value( ) ;
int zoom = ui-> hSliderScale-> value( ) ;
graph3D-> scene( ) -> activeCamera( ) -> setCameraPosition( xRot, yRot, zoom) ;
}
void MainWindow::on_hSliderVertical_valueChanged( int value)
{
Q_UNUSED( value) ;
int xRot = ui-> hSliderLevel-> value( ) ;
int yRot = ui-> hSliderVertical-> value( ) ;
int zoom = ui-> hSliderScale-> value( ) ;
graph3D-> scene( ) -> activeCamera( ) -> setCameraPosition( xRot, yRot, zoom) ;
}
void MainWindow::on_hSliderScale_valueChanged( int value)
{
Q_UNUSED( value) ;
int xRot = ui-> hSliderLevel-> value( ) ;
int yRot = ui-> hSliderVertical-> value( ) ;
int zoom = ui-> hSliderScale-> value( ) ;
graph3D-> scene( ) -> activeCamera( ) -> setCameraPosition( xRot, yRot, zoom) ;
}
void MainWindow::on_cboxTheme_currentIndexChanged( int index)
{
graph3D-> activeTheme( ) -> setType( Q3DTheme::Theme( index)) ;
}
void MainWindow::on_cboxStyle_currentIndexChanged( int index)
{
QScatter3DSeries *series = graph3D-> seriesList( ) .at( 0 ) ;
series-> setMesh( QAbstract3DSeries::Mesh( index)) ;
}
void MainWindow::on_cboxMode_currentIndexChanged( int index)
{
graph3D-> setSelectionMode( QAbstract3DGraph::SelectionFlags( index)) ;
}
void MainWindow::on_spinBoxFontSize_valueChanged( int arg1)
{
QFont font = graph3D-> activeTheme( ) -> font( ) ;
font.setPointSize( arg1) ;
graph3D-> activeTheme( ) -> setFont( font) ;
}
void MainWindow::on_btnItemColor_clicked ( )
{
QScatter3DSeries *series = graph3D-> seriesList( ) .at( 0 ) ;
QColor color = series-> baseColor( ) ;
color = QColorDialog::getColor( color) ;
if( color.isValid( ))
{
series-> setBaseColor( color) ;
}
}
void MainWindow::on_checkBoxBack_clicked( bool checked)
{
graph3D-> activeTheme( ) -> setBackgroundEnabled( checked) ;
}
void MainWindow::on_checkBoxBackNetwork_clicked( bool checked)
{
graph3D-> activeTheme( ) -> setGridEnabled( checked) ;
}
void MainWindow::on_checkBoxSmooth_clicked( bool checked)
{
QScatter3DSeries *series = graph3D-> seriesList( ) .at( 0 ) ;
series-> setMeshSmooth( checked) ;
}
void MainWindow::on_checkBoxReflection_clicked( bool checked)
{
graph3D-> setReflection( checked) ;
}
void MainWindow::on_checkBoxValueAxis_clicked( bool checked)
{
graph3D-> axisY( ) -> setReversed( checked) ;
}
void MainWindow::on_checkBoxItemLabel_clicked( bool checked)
{
QScatter3DSeries *series = graph3D-> seriesList( ) .at( 0 ) ;
series-> setItemLabelVisible( checked) ;
}
void MainWindow::on_checkBoxAxisBack_clicked( bool checked)
{
graph3D-> axisY( ) -> setTitleVisible( checked) ;
graph3D-> axisX( ) -> setTitleVisible( checked) ;
graph3D-> axisZ( ) -> setTitleVisible( checked) ;
}
void MainWindow::on_checkBoxAxisLabelBack_clicked( bool checked)
{
graph3D-> activeTheme( ) -> setLabelBackgroundEnabled( checked) ;
}
MainWindow::MainWindow( QWidget *parent) :
QMainWindow( parent) ,
ui( new Ui::MainWindow)
{
ui-> setupUi( this) ;
QSplitter *splitter = new QSplitter;
splitter-> addWidget( ui-> groupBox) ;
init3DGraph( ) ;
splitter-> addWidget( createWindowContainer( graph3D)) ;
setCentralWidget( splitter) ;
// 设置按钮的渐变色
QLinearGradient lgColor1( 0 , 0 , 100 , 0 ) ;
lgColor1.setColorAt( 1.0 , Qt::black) ;
lgColor1.setColorAt( 0.67 , Qt::blue) ;
lgColor1.setColorAt( 0.33 , Qt::red) ;
lgColor1.setColorAt( 0 , Qt::yellow) ;
QPixmap mp( 160 , 20 ) ;
QPainter painter( & mp) ;
painter.setBrush( lgColor1) ;
painter.drawRect( 0 , 0 , 160 , 20 ) ;
ui-> btnColors1-> setIcon( QIcon( mp)) ;
ui-> btnColors1-> setIconSize( QSize( 160 , 20 )) ;
lgColor1.setColorAt( 1.0 , Qt::darkBlue) ;
lgColor1.setColorAt( 0.5 , Qt::yellow) ;
lgColor1.setColorAt( 0.2 , Qt::red) ;
lgColor1.setColorAt( 0 , Qt::darkRed) ;
painter.setBrush( lgColor1) ;
painter.drawRect( 0 , 0 , 160 , 20 ) ;
ui-> btnColors2-> setIcon( QIcon( mp)) ;
ui-> btnColors2-> setIconSize( QSize( 160 , 20 )) ;
}
MainWindow::~MainWindow ( )
{
delete ui;
}
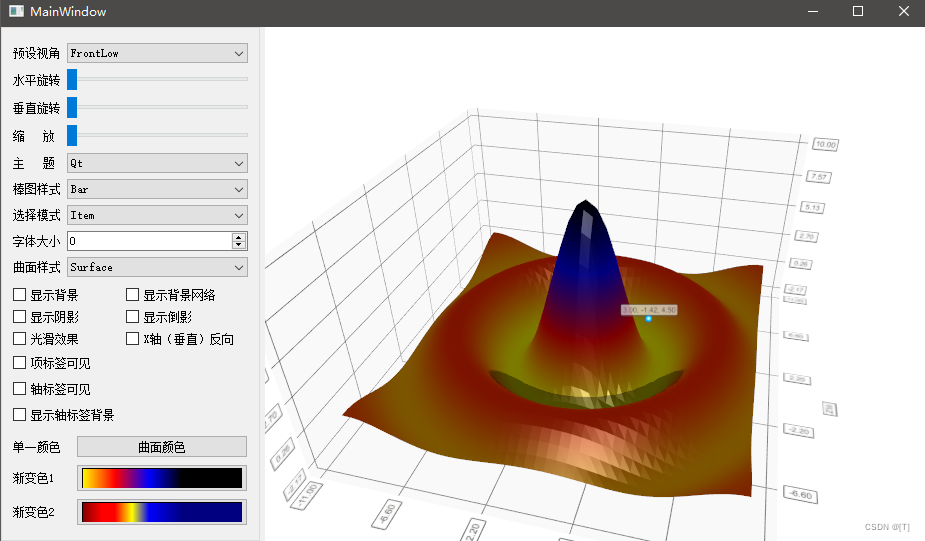
void MainWindow::init3DGraph ( )
{
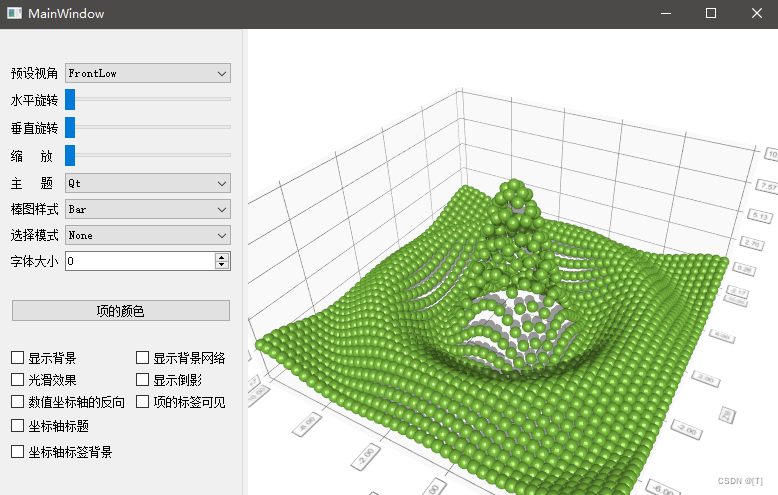
graph3D = new Q3DSurface;
graph3D-> axisX( ) -> setTitle( "X轴" ) ;
graph3D-> axisX( ) -> setTitleVisible( true) ;
graph3D-> axisX( ) -> setRange( -11, 11 ) ;
graph3D-> axisY( ) -> setTitle( "Y轴" ) ;
graph3D-> axisY( ) -> setTitleVisible( true) ;
graph3D-> axisZ( ) -> setTitle( "Z轴" ) ;
graph3D-> axisZ( ) -> setTitleVisible( true) ;
graph3D-> axisZ( ) -> setRange( -11, 11 ) ;
QSurfaceDataProxy *proxy = new QSurfaceDataProxy;
series = new QSurface3DSeries( proxy) ;
series-> setDrawMode( QSurface3DSeries::DrawSurface) ;
series-> setMeshSmooth( true) ; // 光滑曲面
graph3D-> addSeries( series) ;
QSurfaceDataArray *dataArray = new QSurfaceDataArray;
// 摩西跟草帽算法
int N = 41 ;
dataArray-> reserve( N) ;
float x, y, z;
x = -10;
for ( int i = 0 ; i < N; ++i)
{
QSurfaceDataRow *newRow = new QSurfaceDataRow( N) ;
y = -10;
int index = 0 ;
for ( int j = 1 ; j <= N; ++j)
{
z = qSqrt( x * x + y * y) ;
if( z != 0 )
{
z = 10 * qSin( z) / z;
}
else
{
z = 10 ;
}
// 图形库的坐标系
( *newRow) [ index++] .setPosition( QVector3D( x, z, y)) ;
y += 0.5 ;
}
x += 0.5 ;
*dataArray << newRow;
}
series-> dataProxy( ) -> resetArray( dataArray) ;
}
void MainWindow::on_btnOneColor_clicked ( )
{
QColor color = series-> baseColor( ) ;
color = QColorDialog::getColor( color) ;
if( color.isValid( ))
{
series-> setBaseColor( color) ;
series-> setColorStyle( Q3DTheme::ColorStyleUniform) ;
}
}
void MainWindow::on_btnColors1_clicked ( )
{
QLinearGradient lgColor1( 0 , 0 , 100 , 0 ) ;
lgColor1.setColorAt( 1.0 , Qt::black) ;
lgColor1.setColorAt( 0.67 , Qt::blue) ;
lgColor1.setColorAt( 0.33 , Qt::red) ;
lgColor1.setColorAt( 0 , Qt::yellow) ;
series-> setBaseGradient( lgColor1) ;
series-> setColorStyle( Q3DTheme::ColorStyleRangeGradient) ; //设置渐变色
}
void MainWindow::on_btnColors2_clicked ( )
{
QLinearGradient lgColor1( 0 , 0 , 100 , 0 ) ;
lgColor1.setColorAt( 1.0 , Qt::darkBlue) ;
lgColor1.setColorAt( 0.5 , Qt::yellow) ;
lgColor1.setColorAt( 0.2 , Qt::red) ;
lgColor1.setColorAt( 0 , Qt::darkRed) ;
series-> setBaseGradient( lgColor1) ;
series-> setColorStyle( Q3DTheme::ColorStyleRangeGradient) ;
}
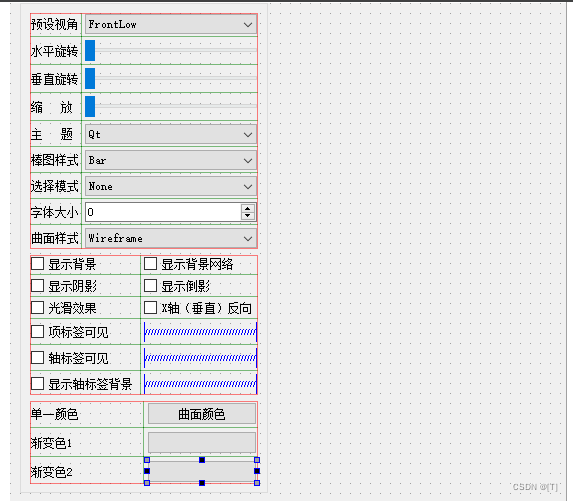
MainWindow::MainWindow( QWidget *parent) :
QMainWindow( parent) ,
ui( new Ui::MainWindow)
{
ui-> setupUi( this) ;
QSplitter *splitter = new QSplitter;
splitter-> addWidget( ui-> groupBox) ;
init3DGraph( ) ;
splitter-> addWidget( createWindowContainer( graph3D)) ;
setCentralWidget( splitter) ;
// 设置按钮的渐变色
QLinearGradient lgColor1( 0 , 0 , 100 , 0 ) ;
lgColor1.setColorAt( 1.0 , Qt::black) ;
lgColor1.setColorAt( 0.67 , Qt::blue) ;
lgColor1.setColorAt( 0.33 , Qt::red) ;
lgColor1.setColorAt( 0 , Qt::yellow) ;
QPixmap mp( 160 , 20 ) ;
QPainter painter( & mp) ;
painter.setBrush( lgColor1) ;
painter.drawRect( 0 , 0 , 160 , 20 ) ;
ui-> btnColors1-> setIcon( QIcon( mp)) ;
ui-> btnColors1-> setIconSize( QSize( 160 , 20 )) ;
lgColor1.setColorAt( 1.0 , Qt::darkBlue) ;
lgColor1.setColorAt( 0.5 , Qt::yellow) ;
lgColor1.setColorAt( 0.2 , Qt::red) ;
lgColor1.setColorAt( 0 , Qt::darkRed) ;
painter.setBrush( lgColor1) ;
painter.drawRect( 0 , 0 , 160 , 20 ) ;
ui-> btnColors2-> setIcon( QIcon( mp)) ;
ui-> btnColors2-> setIconSize( QSize( 160 , 20 )) ;
}
MainWindow::~MainWindow ( )
{
delete ui;
}
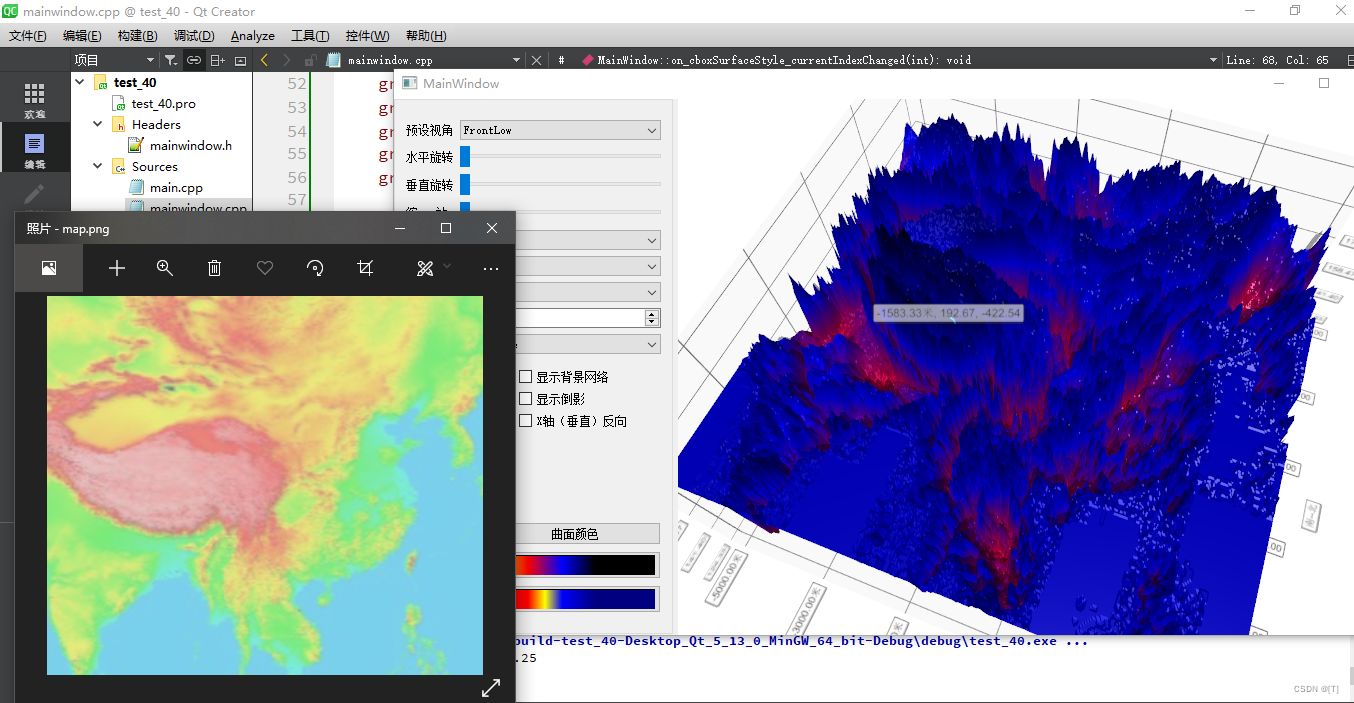
void MainWindow::init3DGraph ( )
{
graph3D = new Q3DSurface;
graph3D-> axisX( ) -> setTitle( "东--西" ) ;
graph3D-> axisX( ) -> setTitleVisible( true) ;
graph3D-> axisX( ) -> setLabelFormat( "%.2f米" ) ;
graph3D-> axisZ( ) -> setTitle( "南--北" ) ;
graph3D-> axisZ( ) -> setTitleVisible( true) ;
graph3D-> axisY( ) -> setTitle( "海拔" ) ;
graph3D-> axisY( ) -> setTitleVisible( true) ;
QImage mapImage( ":/images/images/map.png" ) ;
QHeightMapSurfaceDataProxy *proxy = new QHeightMapSurfaceDataProxy( mapImage) ;
proxy-> setValueRanges( -5000, 5000 , -5000, 5000 ) ;
series = new QSurface3DSeries( proxy) ;
series-> setDrawMode( QSurface3DSeries::DrawSurface) ;
graph3D-> addSeries( series) ;
}
void MainWindow::on_cboxSurfaceStyle_currentIndexChanged( int index)
{
series-> setDrawMode( QSurface3DSeries::DrawFlags( index + 1 )) ;
}
void MainWindow::on_btnOneColor_clicked ( )
{
QColor color = series-> baseColor( ) ;
color = QColorDialog::getColor( color) ;
if( color.isValid( ))
{
series-> setBaseColor( color) ;
series-> setColorStyle( Q3DTheme::ColorStyleUniform) ;
}
}
void MainWindow::on_btnColors1_clicked ( )
{
QLinearGradient lgColor1( 0 , 0 , 100 , 0 ) ;
lgColor1.setColorAt( 1.0 , Qt::black) ;
lgColor1.setColorAt( 0.67 , Qt::blue) ;
lgColor1.setColorAt( 0.33 , Qt::red) ;
lgColor1.setColorAt( 0 , Qt::yellow) ;
series-> setBaseGradient( lgColor1) ;
series-> setColorStyle( Q3DTheme::ColorStyleRangeGradient) ; //设置渐变色
}
void MainWindow::on_btnColors2_clicked ( )
{
QLinearGradient lgColor1( 0 , 0 , 100 , 0 ) ;
lgColor1.setColorAt( 1.0 , Qt::darkBlue) ;
lgColor1.setColorAt( 0.5 , Qt::yellow) ;
lgColor1.setColorAt( 0.2 , Qt::red) ;
lgColor1.setColorAt( 0 , Qt::darkRed) ;
series-> setBaseGradient( lgColor1) ;
series-> setColorStyle( Q3DTheme::ColorStyleRangeGradient) ;
}
void MainWindow::on_cboxMode_currentIndexChanged( int index)
{
switch ( index)
{
case 0 :
graph3D-> setSelectionMode( QAbstract3DGraph::SelectionNone) ;
break ;
case 1 :
graph3D-> setSelectionMode( QAbstract3DGraph::SelectionItem) ;
break ;
case 2 :
graph3D-> setSelectionMode( QAbstract3DGraph::SelectionRow |
QAbstract3DGraph::SelectionSlice) ;
break ;
case 3 :
graph3D-> setSelectionMode( QAbstract3DGraph::SelectionColumn |
QAbstract3DGraph::SelectionSlice) ;
break ;
default:
break ;
}
}