Pyecharts绘制多种炫酷气泡图
引言
数据可视化是数据分析中不可或缺的一环,而Pyecharts作为一款基于Echarts的Python图表库,提供了丰富的图表类型,其中气泡图是一种常用于展示三维数据的炫酷图表。本文将介绍如何使用Pyecharts绘制多种炫酷气泡图,并对各种参数进行详细说明,帮助读者更好地理解和定制气泡图。
准备工作
首先,确保你已经安装了Pyecharts库:
pip install pyecharts
然后,我们准备一些示例数据,这里以某公司销售数据为例。
import random

# 生成示例数据
data = [(i, random.randint(50, 200), random.randint(1, 100)) for i in range(1, 11)]
基础气泡图
首先,我们来绘制一个基础的气泡图。
from pyecharts import options as opts
from pyecharts.charts import Scatter

# 绘制基础气泡图
scatter_basic = Scatter()
scatter_basic.add_xaxis([str(item[0]) for item in data])
scatter_basic.add_yaxis("销售额", [item[1] for item in data],
                        symbol_size=[item[2] for item in data],
                        label_opts=opts.LabelOpts(is_show=False))
scatter_basic.set_global_opts(title_opts=opts.TitleOpts(title="基础气泡图"),
                              xaxis_opts=opts.AxisOpts(type_="category"))

# 渲染图表
scatter_basic.render("basic_bubble_chart.html")
在这个基础气泡图中,我们使用了Scatter类,通过add_xaxis和add_yaxis方法添加横纵坐标数据。symbol_size参数表示气泡的大小,这里使用了销售量作为气泡的大小。label_opts参数用于控制标签的显示,这里我们将标签关闭。

自定义气泡图
接下来,我们将进一步自定义气泡图,包括颜色、透明度等。
from pyecharts import options as opts
from pyecharts.charts import Scatter

# 绘制自定义气泡图
scatter_custom = Scatter()
scatter_custom.add_xaxis([str(item[0]) for item in data])
scatter_custom.add_yaxis("销售额", [item[1] for item in data],
                         symbol_size=[item[2] for item in data],
                         label_opts=opts.LabelOpts(is_show=False),
                         itemstyle_opts=opts.ItemStyleOpts(color="skyblue", opacity=0.8))
scatter_custom.set_global_opts(title_opts=opts.TitleOpts(title="自定义气泡图"),
                               xaxis_opts=opts.AxisOpts(type_="category"))

# 渲染图表
scatter_custom.render("custom_bubble_chart.html")
在这个自定义气泡图中,我们通过itemstyle_opts参数设置了气泡的颜色和透明度。这里我们将颜色设置为天蓝色,透明度设置为0.8。
多系列气泡图
有时候,我们需要在同一张图上展示多组数据,这时可以使用多系列气泡图。
from pyecharts import options as opts
from pyecharts.charts import Scatter

# 生成示例数据
data2 = [(i, random.randint(30, 150), random.randint(1, 100)) for i in range(1, 11)]

# 绘制多系列气泡图
scatter_multi_series = Scatter()
scatter_multi_series.add_xaxis([str(item[0]) for item in data])
scatter_multi_series.add_yaxis("销售A", [item[1] for item in data],
                               symbol_size=[item[2] for item in data],
                               label_opts=opts.LabelOpts(is_show=False))
scatter_multi_series.add_yaxis("销售B", [item[1] for item in data2],
                               symbol_size=[item[2] for item in data2],
                               label_opts=opts.LabelOpts(is_show=False))
scatter_multi_series.set_global_opts(title_opts=opts.TitleOpts(title="多系列气泡图"),
                                     xaxis_opts=opts.AxisOpts(type_="category"))

# 渲染图表
scatter_multi_series.render("multi_series_bubble_chart.html")
在多系列气泡图中,我们通过多次调用add_yaxis方法添加不同系列的数据。

气泡图标签和工具箱
除了基础的气泡图外,Pyecharts还支持对气泡图的标签和工具箱进行定制。
from pyecharts import options as opts
from pyecharts.charts import Scatter

# 绘制带标签的气泡图
scatter_with_label = Scatter()
scatter_with_label.add_xaxis([str(item[0]) for item in data])
scatter_with_label.add_yaxis("销售额", [item[1] for item in data],
                              symbol_size=[item[2] for item in data],
                              label_opts=opts.LabelOpts(is_show=True, position="top"))
scatter_with_label.set_global_opts(title_opts=opts.TitleOpts(title="带标签的气泡图"),
                                   xaxis_opts=opts.AxisOpts(type_="category"))

# 渲染图表
scatter_with_label.render("bubble_chart_with_label.html")
在这个带标签的气泡图中,我们通过label_opts参数开启了标签的显示,并设置标签位置为顶部。
接下来,我们将为气泡图添加工具箱,使用户可以更灵活地交互。
from pyecharts import options as opts
from pyecharts.charts import Scatter
from pyecharts.commons.utils import JsCode

# 绘制带工具箱的气泡图
scatter_with_toolbox = Scatter()
scatter_with_toolbox.add_xaxis([str(item[0]) for item in data])
scatter_with_toolbox.add_yaxis("销售额", [item[1] for item in data],
                                symbol_size=[item[2] for item in data],
                                label_opts=opts.LabelOpts(is_show=False))
scatter_with_toolbox.set_global_opts(
    title_opts=opts.TitleOpts(title="带工具箱的气泡图"),
    xaxis_opts=opts.AxisOpts(type_="category"),
    toolbox_opts=opts.ToolboxOpts(
        feature={
            "saveAsImage": {"title": "保存图片"},
            "dataZoom": {"title": {"zoom": "区域缩放", "back": "区域缩放还原"}},
        }
    ),
)

# 渲染图表
scatter_with_toolbox.render("bubble_chart_with_toolbox.html")
在这个带工具箱的气泡图中,我们通过toolbox_opts参数添加了两个功能按钮,一个用于保存图片,另一个用于区域缩放。
动态气泡图
最后,我们介绍如何制作一个动态气泡图,通过时间轴展示数据的变化。
from pyecharts import options as opts
from pyecharts.charts import Scatter, Timeline

# 生成示例数据
timeline_data = {
    f"2022-{i}": [(i, random.randint(50, 200), random.randint(1, 100)) for i in range(1, 11)] for i in range(1, 13)
}

# 绘制动态气泡图
timeline_scatter = Timeline()
for year_month, data in timeline_data.items():
    scatter = Scatter()
    scatter.add_xaxis([str(item[0]) for item in data])
    scatter.add_yaxis("销售额", [item[1] for item in data],
                      symbol_size=[item[2] for item in data],
                      label_opts=opts.LabelOpts(is_show=False))
    scatter.set_global_opts(
        title_opts=opts.TitleOpts(title=f"{year_month} 动态气泡图"),
        xaxis_opts=opts.AxisOpts(type_="category"),
    )
    timeline_scatter.add(scatter, year_month)

# 渲染图表
timeline_scatter.render("dynamic_bubble_chart.html")
在动态气泡图中,我们使用了Timeline类,并通过循环逐步添加各个时间点的气泡图,从而实现动态效果。
高级气泡图定制
除了上述介绍的基础和进阶功能之外,Pyecharts还提供了一些高级的定制选项,让气泡图更加炫酷。
渐变颜色气泡图
有时候,我们希望气泡的颜色能够根据数据的大小变化而渐变,以更直观地反映数值差异。
from pyecharts import options as opts
from pyecharts.charts import Scatter
from pyecharts.commons.utils import JsCode

# 绘制渐变颜色气泡图
scatter_gradient_color = Scatter()
scatter_gradient_color.add_xaxis([str(item[0]) for item in data])
scatter_gradient_color.add_yaxis("销售额", [item[1] for item in data],
                                 symbol_size=[item[2] for item in data],
                                 label_opts=opts.LabelOpts(is_show=False),
                                 itemstyle_opts=opts.ItemStyleOpts(
                                     color=JsCode("""new echarts.graphic.RadialGradient(0.4, 0.3, 1, [{
                                        offset: 0,
                                        color: 'rgba(0, 255, 255, 0.7)'
                                    }, {
                                        offset: 1,
                                        color: 'rgba(0, 255, 255, 0.3)'
                                    }])"""))
                                 )
scatter_gradient_color.set_global_opts(title_opts=opts.TitleOpts(title="渐变颜色气泡图"),
                                       xaxis_opts=opts.AxisOpts(type_="category"))

# 渲染图表
scatter_gradient_color.render("gradient_color_bubble_chart.html")
在这个渐变颜色气泡图中,我们通过itemstyle_opts参数使用JsCode设置了颜色为渐变效果。

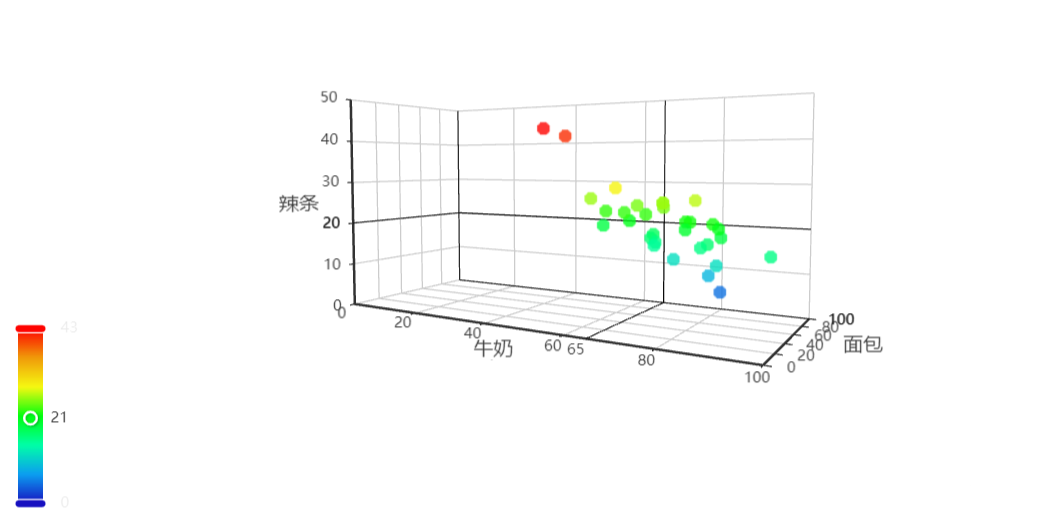
3D气泡图
为了展示更加立体的气泡图,Pyecharts也支持绘制3D气泡图。
from pyecharts import options as opts
from pyecharts.charts import Scatter3D

# 绘制3D气泡图
scatter_3d = Scatter3D()
scatter_3d.add("", [(item[0], item[1], item[2]) for item in data],
               grid3d_opts=opts.Grid3DOpts(width=100, height=100, depth=100),
               label_opts=opts.LabelOpts(is_show=False),
               itemstyle_opts=opts.ItemStyleOpts(color="skyblue", opacity=0.8))
scatter_3d.set_global_opts(title_opts=opts.TitleOpts(title="3D气泡图"))

# 渲染图表
scatter_3d.render("3d_bubble_chart.html")
在3D气泡图中,我们使用了Scatter3D类,并通过grid3d_opts参数设置了三维坐标系的网格大小。
结语
通过本文的介绍,读者可以更全面地了解如何使用Pyecharts绘制各种炫酷气泡图,包括标签、工具箱、动态效果以及一些高级的定制选项。希望本文能够帮助读者在实际项目中更灵活地运用Pyecharts进行数据可视化,使得分析结果更加生动有趣。


