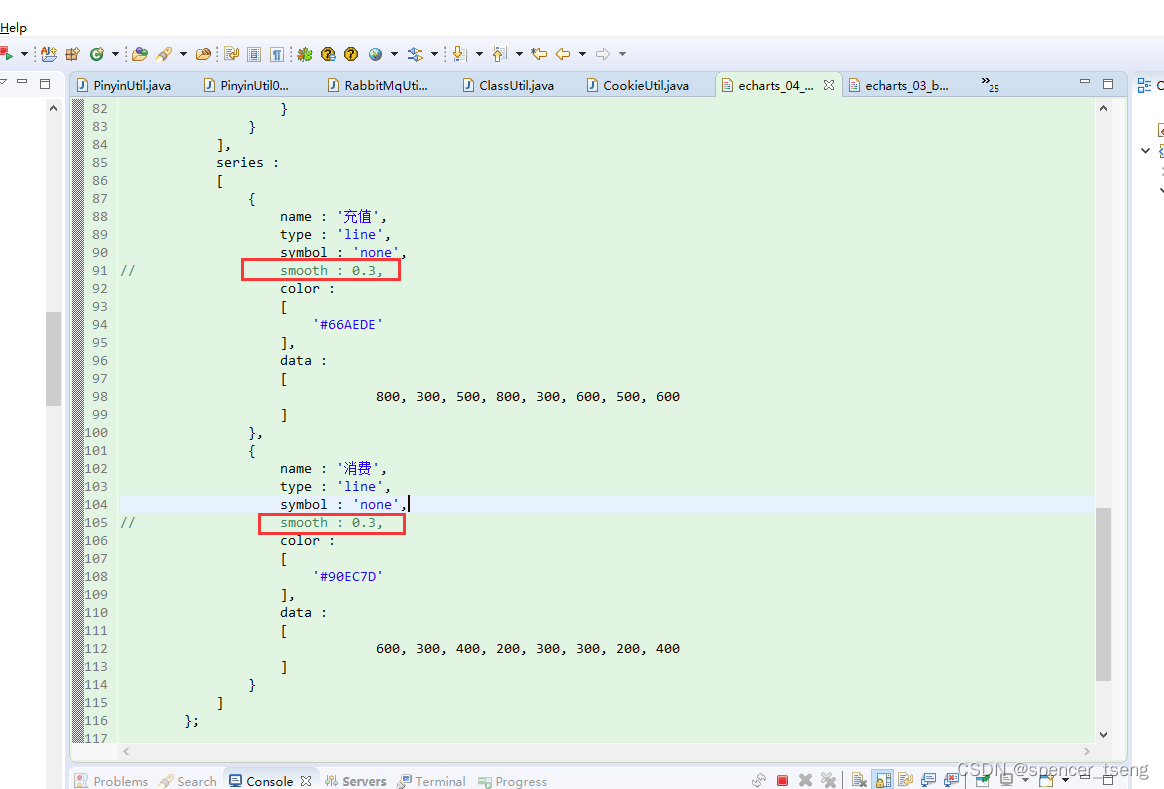
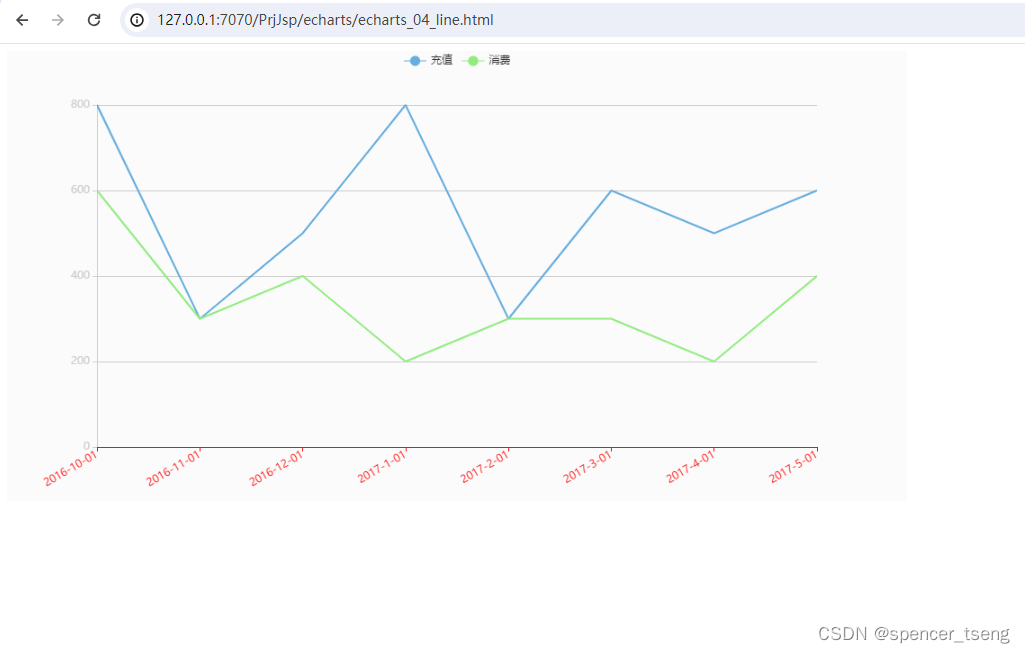
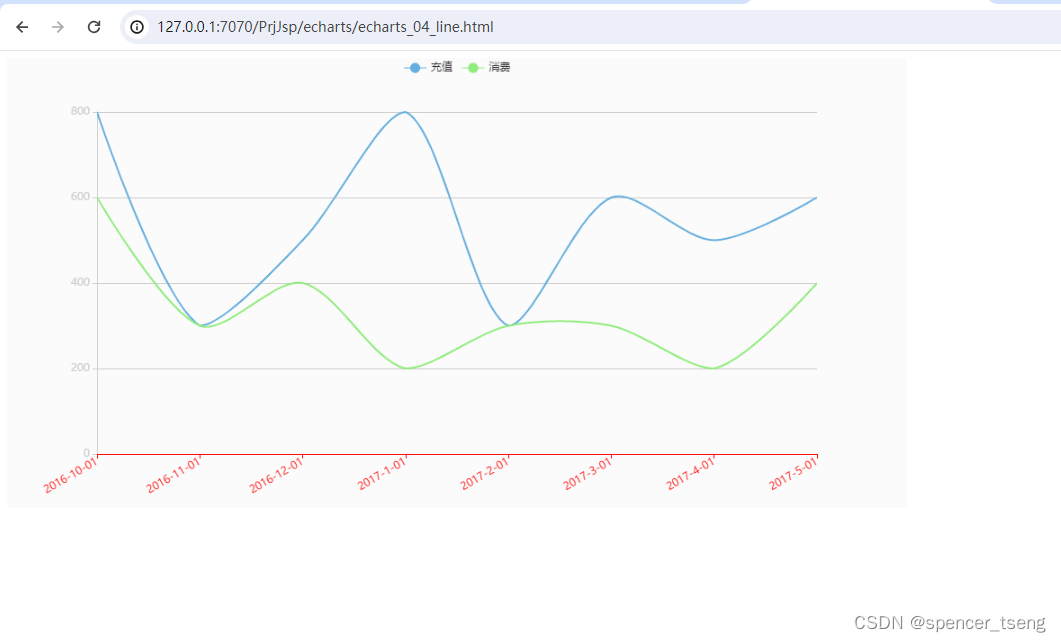
echarts option series smooth 平滑处理
==
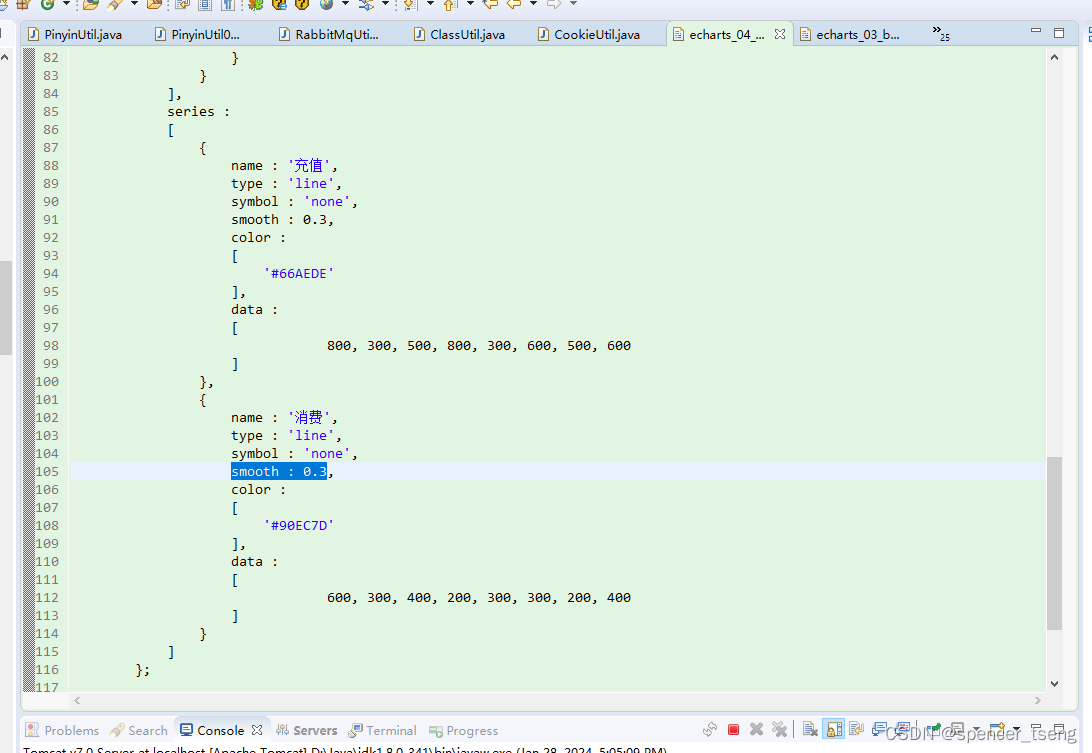
smooth:0.3
==
echarts_04_line.html
<!DOCTYPE html>
<html lang="en">

<head>
<meta charset="utf-8">
<title></title>
</head>

<body>
	<div id="box" style="width: 1000px; height: 500px; background-color: pink;"></div>
	<script type="text/javascript" src="echarts.min.js"></script>
	<script>
		/*-------------------------- +
		 http://127.0.0.1:7070/PrjJsp/echarts/echarts_04_line.html
		+-------------------------- */
		var myChart = echarts.init(document.getElementById("box"));

		// option 里面的内容基本涵盖你要画的图表的所有内容
		var option =
		{
			// 定义样式和数据
			backgroundColor : '#FBFBFB',
			tooltip :
			{
				trigger : 'axis'
			},
			legend :
			{
				data :
				[
					'充值', '消费'
				]
			},

			calculable : true,

			xAxis :
			[
				{
					axisLabel :
					{
						rotate : 30,
						interval : 0
					},
					axisLine :
					{
						lineStyle :
						{
							color : 'red'
						}
					},
					type : 'category',
					boundaryGap : false,
					data : function()
					{
						var list = [];
						for ( var i = 10; i < 18; i++)
						{
							if (i <= 12)
							{
								list.push('2016-' + i + '-01');
							}
							else
							{
								list.push('2017-' + (i - 12) + '-01');
							}
						}
						return list;
					}()
				}
			],
			yAxis :
			[
				{
					type : 'value',
					axisLine :
					{
						lineStyle :
						{
							color : '#CECECE'
						}
					}
				}
			],
			series :
			[
				{
					name : '充值',
					type : 'line',
					symbol : 'none',
					smooth : 0.3,
					color :
					[
						'#66AEDE'
					],
					data :
					[
								800, 300, 500, 800, 300, 600, 500, 600
					]
				},
				{
					name : '消费',
					type : 'line',
					symbol : 'none',
					smooth : 0.3,
					color :
					[
						'#90EC7D'
					],
					data :
					[
								600, 300, 400, 200, 300, 300, 200, 400
					]
				}
			]
		};

		// 一定不要忘了这个,具体是干啥的我忘了,官网是这样写的使用刚指定的配置项和数据显示图表。
		myChart.setOption(option);
	</script>
</body>

</html>

