客户行为分析是一个有价值的过程,它使企业能够做出数据驱动的决策,增强客户体验,并在动态市场中保持竞争力。
下面是我们可以遵循的客户行为分析任务的过程:
- 收集与客户互动相关的数据。它可以包括购买历史记录,网站访问,社交媒体参与,客户反馈等。
- 识别和解决数据不一致、缺失值和离群值,以确保数据的质量和准确性。
- 计算基本统计数据,如平均值,中位数和标准差,以汇总数据。
- 创建直方图、散点图和条形图等可视化效果,以探索数据中的趋势、模式和异常。
- 使用聚类等技术,根据共同的行为或特征对客户进行分组。
因此,这个过程从基于平台上的客户行为收集数据开始。
使用Python进行客户行为分析
首先,让我们通过导入必要的Python库和数据集来开始客户行为分析的任务:
import pandas as pd
import plotly.express as px
import plotly.graph_objects as go

data = pd.read_csv("ecommerce_customer_data.csv")
print(data.head())
输出
   User_ID  Gender  Age   Location Device_Type  Product_Browsing_Time  \
0        1  Female   23  Ahmedabad      Mobile                     60
1        2    Male   25    Kolkata      Tablet                     30
2        3    Male   32  Bangalore     Desktop                     37
3        4    Male   35      Delhi      Mobile                      7
4        5    Male   27  Bangalore      Tablet                     35

   Total_Pages_Viewed  Items_Added_to_Cart  Total_Purchases
0                  30                    1                0
1                  38                    9                4
2                  13                    5                0
3                  20                   10                3
4                  20                    8                2
在继续之前,让我们看看数据集中数值列和分类列的汇总统计量:
# Summary statistics for numeric columns
numeric_summary = data.describe()
print(numeric_summary)
输出
          User_ID         Age  Product_Browsing_Time  Total_Pages_Viewed  \
count  500.000000  500.000000             500.000000          500.000000
mean   250.500000   26.276000              30.740000           27.182000
std    144.481833    5.114699              15.934246           13.071596
min      1.000000   18.000000               5.000000            5.000000
25%    125.750000   22.000000              16.000000           16.000000
50%    250.500000   26.000000              31.000000           27.000000
75%    375.250000   31.000000              44.000000           38.000000
max    500.000000   35.000000              60.000000           50.000000

       Items_Added_to_Cart  Total_Purchases
count           500.000000       500.000000
mean              5.150000         2.464000
std               3.203127         1.740909
min               0.000000         0.000000
25%               2.000000         1.000000
50%               5.000000         2.000000
75%               8.000000         4.000000
max              10.000000         5.000000
# Summary for non-numeric columns
categorical_summary = data.describe(include='object')
print(categorical_summary)
输出
       Gender Location Device_Type
count     500      500         500
unique      2        8           3
top      Male  Kolkata      Mobile
freq      261       71         178
现在,让我们来看看数据集中的年龄分布:
# Histogram for 'Age'
fig = px.histogram(data, x='Age', title='Distribution of Age')
fig.show()

现在,让我们来看看性别分布:
# Bar chart for 'Gender'
gender_counts = data['Gender'].value_counts().reset_index()
gender_counts.columns = ['Gender', 'Count']
fig = px.bar(gender_counts, x='Gender',
             y='Count',
             title='Gender Distribution')
fig.show()

分析客户行为
现在,让我们来看看产品浏览时间和总浏览页面之间的关系:
# 'Product_Browsing_Time' vs 'Total_Pages_Viewed'
fig = px.scatter(data, x='Product_Browsing_Time', y='Total_Pages_Viewed',
                 title='Product Browsing Time vs. Total Pages Viewed',
                 trendline='ols')
fig.show()

上面的散点图显示,在浏览产品所花费的时间和浏览的总页面数之间没有一致的模式或强关联。它表明,如果客户在网站上花费更多时间,他们不一定会探索更多页面,这可能是由于各种因素,如网站设计,内容相关性或个人用户偏好。
现在,让我们来看看按性别划分的平均总页面数:
# Grouped Analysis
gender_grouped = data.groupby('Gender')['Total_Pages_Viewed'].mean().reset_index()
gender_grouped.columns = ['Gender', 'Average_Total_Pages_Viewed']
fig = px.bar(gender_grouped, x='Gender', y='Average_Total_Pages_Viewed',
             title='Average Total Pages Viewed by Gender')
fig.show()

现在,让我们来看看设备查看的平均总页面:
devices_grouped = data.groupby('Device_Type')['Total_Pages_Viewed'].mean().reset_index()
devices_grouped.columns = ['Device_Type', 'Average_Total_Pages_Viewed']
fig = px.bar(devices_grouped, x='Device_Type', y='Average_Total_Pages_Viewed',
             title='Average Total Pages Viewed by Devices')
fig.show()

现在,让我们计算客户生命周期价值,并根据客户生命周期价值可视化细分:
data['CLV'] = (data['Total_Purchases'] * data['Total_Pages_Viewed']) / data['Age']

data['Segment'] = pd.cut(data['CLV'], bins=[1, 2.5, 5, float('inf')],
                         labels=['Low Value', 'Medium Value', 'High Value'])

segment_counts = data['Segment'].value_counts().reset_index()
segment_counts.columns = ['Segment', 'Count']

# Create a bar chart to visualize the customer segments
fig = px.bar(segment_counts, x='Segment', y='Count',
             title='Customer Segmentation by CLV')
fig.update_xaxes(title='Segment')
fig.update_yaxes(title='Number of Customers')
fig.show()

现在,让我们来看看客户的转换漏斗:
# Funnel analysis
funnel_data = data[['Product_Browsing_Time', 'Items_Added_to_Cart', 'Total_Purchases']]
funnel_data = funnel_data.groupby(['Product_Browsing_Time', 'Items_Added_to_Cart']).sum().reset_index()

fig = px.funnel(funnel_data, x='Product_Browsing_Time', y='Items_Added_to_Cart', title='Conversion Funnel')
fig.show()
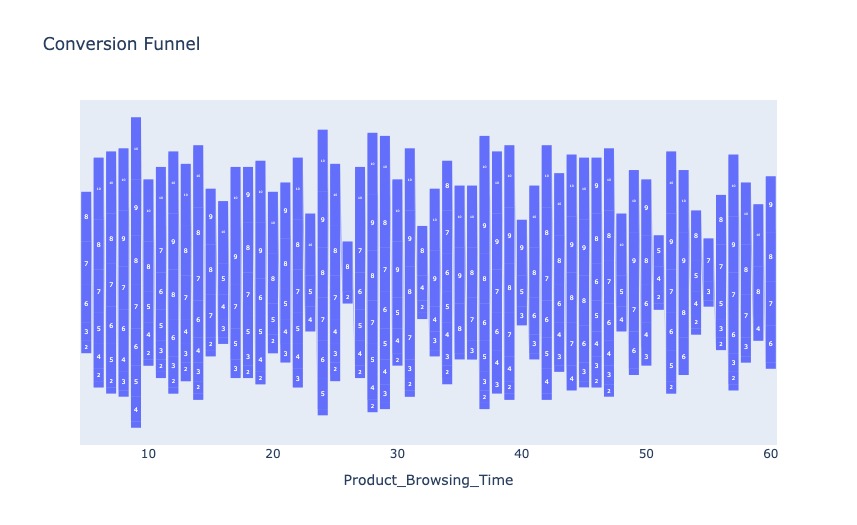
在上图中,x轴代表客户在电子商务平台上浏览产品所花费的时间。y轴表示客户在浏览会话期间添加到购物车的项目数量。
现在,让我们来看看客户的流失率:
# Calculate churn rate
data['Churned'] = data['Total_Purchases'] == 0

churn_rate = data['Churned'].mean()
print(churn_rate)
输出
0.198
客户流失率为0.198表明有相当一部分客户流失了,解决这一问题对于保持业务增长和盈利能力至关重要。


