内存泄漏检测原理介绍
malloc debug 原理介绍
分为初始化和内存泄漏检测两个阶段介绍。
初始化阶段
整体流程如下图
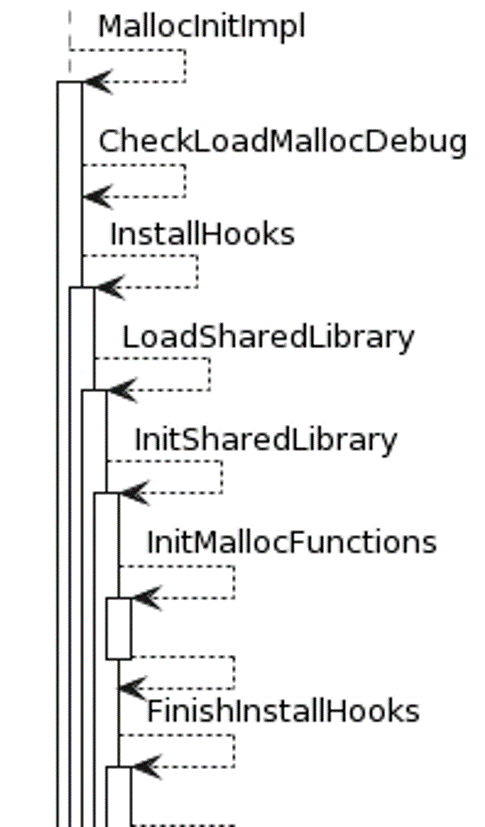
- libc 初始化时通过 __libc_init_malloc 函数调用 MallocInitImpl 来初始化 memory allocation framework。
// malloc_common_dynamic.cpp
static constexpr char kDebugSharedLib[] = "libc_malloc_debug.so";
static constexpr char kDebugPrefix[] = "debug";
static constexpr char kDebugPropertyOptions[] = "libc.debug.malloc.options";
static constexpr char kDebugPropertyProgram[] = "libc.debug.malloc.program";
static constexpr char kDebugEnvOptions[] = "LIBC_DEBUG_MALLOC_OPTIONS";
...
// Initializes memory allocation framework once per process.
static void MallocInitImpl(libc_globals* globals) {
  char prop[PROP_VALUE_MAX];
  char* options = prop;

  MaybeInitGwpAsanFromLibc(globals);

#if defined(USE_SCUDO)
  __libc_shared_globals()->scudo_stack_depot = __scudo_get_stack_depot_addr();
  __libc_shared_globals()->scudo_region_info = __scudo_get_region_info_addr();
  __libc_shared_globals()->scudo_ring_buffer = __scudo_get_ring_buffer_addr();
  __libc_shared_globals()->scudo_ring_buffer_size = __scudo_get_ring_buffer_size();
#endif

  // Prefer malloc debug since it existed first and is a more complete
  // malloc interceptor than the hooks.
  bool hook_installed = false;
  if (CheckLoadMallocDebug(&options)) {
    hook_installed = InstallHooks(globals, options, kDebugPrefix, kDebugSharedLib);
  } else if (CheckLoadMallocHooks(&options)) {
    hook_installed = InstallHooks(globals, options, kHooksPrefix, kHooksSharedLib);
  }

  if (!hook_installed) {
    if (HeapprofdShouldLoad()) {
      HeapprofdInstallHooksAtInit(globals);
    }
  } else {
    // Record the fact that incompatible hooks are active, to skip any later
    // heapprofd signal handler invocations.
    HeapprofdRememberHookConflict();
  }
}
- CheckLoadMallocDebug() 检查属性是否满足加载 lib_malloc_debug.so 的条件,检查的属性正是前面提到的两个 android prop 属性。
// malloc_common_dynamic.cpp
static bool CheckLoadMallocDebug(char** options) {
  // If kDebugMallocEnvOptions is set then it overrides the system properties.
  char* env = getenv(kDebugEnvOptions);
  if (env == nullptr || env[0] == '\0') {
    if (__system_property_get(kDebugPropertyOptions, *options) == 0 || *options[0] == '\0') {
      return false;
    }

    // Check to see if only a specific program should have debug malloc enabled.
    char program[PROP_VALUE_MAX];
    if (__system_property_get(kDebugPropertyProgram, program) != 0 &&
        strstr(getprogname(), program) == nullptr) {
      return false;
    }
  } else {
    *options = env;
  }
  return true;
}
- InstallHooks() 调用LoadSharedLibrary() 加载 libc_malloc_debug.so;调用 FinishInstallHooks 初始化 malloc_debug 和更新一些全局变量。
// malloc_common_dynamic.cpp
static bool InstallHooks(libc_globals* globals, const char* options, const char* prefix,
                         const char* shared_lib) {
  void* impl_handle = LoadSharedLibrary(shared_lib, prefix, &globals->malloc_dispatch_table);
  if (impl_handle == nullptr) {
    return false;
  }

  if (!FinishInstallHooks(globals, options, prefix)) {
    dlclose(impl_handle);
    return false;
  }
  return true;
}
- LoadSharedLibrary() 函数内部 dlopen lib_malloc_debug.so
- 之后调用 InitSharedLibrary() 查找如下names 数组中的 symbol,将查找到的 symbol 保存在全局数组变量 gfunctions 中。注意查找的函数都会加上 debug_ 前缀。
// malloc_common_dynamic.cpp
bool InitSharedLibrary(void* impl_handle, const char* shared_lib, const char* prefix, MallocDispatch* dispatch_table) {
  static constexpr const char* names[] = {
    "initialize",
    "finalize",
    "get_malloc_leak_info",
    "free_malloc_leak_info",
    "malloc_backtrace",
    "write_malloc_leak_info",
  };
  for (size_t i = 0; i < FUNC_LAST; i++) {
    char symbol[128];
    snprintf(symbol, sizeof(symbol), "%s_%s", prefix, names[i]);
    gFunctions[i] = dlsym(impl_handle, symbol);
    if (gFunctions[i] == nullptr) {
      error_log("%s: %s routine not found in %s", getprogname(), symbol, shared_lib);
      ClearGlobalFunctions();
      return false;
    }
  }

  if (!InitMallocFunctions(impl_handle, dispatch_table, prefix)) {
    ClearGlobalFunctions();
    return false;
  }
  return true;
}
- InitMallocFunctions() 用来初始化除了上一步names 中的函数以外其他的函数,包括 free,malloc 等。查找到的 (加上debug_前缀的)symbol 都存放到 MallocDispatch 对应的函数指针。
// malloc_common_dynamic.cpp
static bool InitMallocFunctions(void* impl_handler, MallocDispatch* table, const char* prefix) {
  if (!InitMallocFunction<MallocFree>(impl_handler, &table->free, prefix, "free")) {
    return false;
  }
  if (!InitMallocFunction<MallocCalloc>(impl_handler, &table->calloc, prefix, "calloc")) {
    return false;
  }
  if (!InitMallocFunction<MallocMallinfo>(impl_handler, &table->mallinfo, prefix, "mallinfo")) {
    return false;
  }
  if (!InitMallocFunction<MallocMallopt>(impl_handler, &table->mallopt, prefix, "mallopt")) {
    return false;
  }
  if (!InitMallocFunction<MallocMalloc>(impl_handler, &table->malloc, prefix, "malloc")) {
    return false;
  }
  if (!InitMallocFunction<MallocMallocInfo>(impl_handler, &table->malloc_info, prefix,
                                                "malloc_info")) {
    return false;
  }
  if (!InitMallocFunction<MallocMallocUsableSize>(impl_handler, &table->malloc_usable_size, prefix,
                                                  "malloc_usable_size")) {
    return false;
  }
  ...
}
InitMallocFunction() 内部作的还是去获取 malloc_debug 内的函数符号。
// malloc_common_dynamic.cpp
template<typename FunctionType>
static bool InitMallocFunction(void* malloc_impl_handler, FunctionType* func, const char* prefix, const char* suffix) {
  char symbol[128];
  snprintf(symbol, sizeof(symbol), "%s_%s", prefix, suffix);
  *func = reinterpret_cast<FunctionType>(dlsym(malloc_impl_handler, symbol));
  if (*func == nullptr) {
    error_log("%s: dlsym(\"%s\") failed", getprogname(), symbol);
    return false;
  }
  return true;
}
- FinishInstallHooks()
7.1 调用 malloc_debug 的 debug_initialize() 函数初始化 malloc debug;
7.2 更新 libc_globals.default_dispatch_table 和 current_dispatch_table 为 malloc_dispatch_table;
7.3 通过 __cxa_atexit() 注册 MallocFiniImpl(),在进程退出时回调此函数检查内存问题并写入dump 文件。
// malloc_common_dynamic.cpp
bool FinishInstallHooks(libc_globals* globals, const char* options, const char* prefix) {
  init_func_t init_func = reinterpret_cast<init_func_t>(gFunctions[FUNC_INITIALIZE]);

  // If GWP-ASan was initialised, we should use it as the dispatch table for
  // heapprofd/malloc_debug/malloc_debug.
  const MallocDispatch* prev_dispatch = GetDefaultDispatchTable();
  if (prev_dispatch == nullptr) {
    prev_dispatch = NativeAllocatorDispatch();
  }

  if (!init_func(prev_dispatch, &gZygoteChild, options)) {
    error_log("%s: failed to enable malloc %s", getprogname(), prefix);
    ClearGlobalFunctions();
    return false;
  }

  // Do a pointer swap so that all of the functions become valid at once to
  // avoid any initialization order problems.
  atomic_store(&globals->default_dispatch_table, &globals->malloc_dispatch_table);
  if (!MallocLimitInstalled()) {
    atomic_store(&globals->current_dispatch_table, &globals->malloc_dispatch_table);
  }

  // Use atexit to trigger the cleanup function. This avoids a problem
  // where another atexit function is used to cleanup allocated memory,
  // but the finalize function was already called. This particular error
  // seems to be triggered by a zygote spawned process calling exit.
  int ret_value = __cxa_atexit(MallocFiniImpl, nullptr, nullptr);
  if (ret_value != 0) {
    // We don't consider this a fatal error.
    warning_log("failed to set atexit cleanup function: %d", ret_value);
  }
  return true;
}
申请/释放内存阶段
其内存泄漏的检测原理可以简单概括为:维护一个记录内存申请和释放的列表,每当申请内存时列表成员+1,内存释放时列表成员-1,程序退出时列表中还存在的成员即内存泄漏的成员。
在调用 malloc 函数时,内部判断如果 dispatch_table 不为空,调用 dispatch_table->malloc(bytes),否则调用默认malloc 函数。dispatch_table 里面存储的是 “debug_”前缀的lib_malloc_debug.so 里的函数。
// malloc_common.cpp
extern "C" void* malloc(size_t bytes) {
  auto dispatch_table = GetDispatchTable();
  void *result;
  if (__predict_false(dispatch_table != nullptr)) {
    result = dispatch_table->malloc(bytes);
  } else {
    result = Malloc(malloc)(bytes);
  }
  if (__predict_false(result == nullptr)) {
    warning_log("malloc(%zu) failed: returning null pointer", bytes);
    return nullptr;
  }
  return MaybeTagPointer(result);
}
在 malloc debug 的 debug_malloc() 函数内,内存实际在 InternalMalloc 里申请,并且会根据初始化时配置的选项选择性开启功能。
// malloc_debug.cpp
void* debug_malloc(size_t size) {
  Unreachable::CheckIfRequested(g_debug->config());

  if (DebugCallsDisabled()) {
    return g_dispatch->malloc(size);
  }
  ScopedConcurrentLock lock;
  ScopedDisableDebugCalls disable;
  ScopedBacktraceSignalBlocker blocked;

  TimedResult result = InternalMalloc(size);

  if (g_debug->config().options() & RECORD_ALLOCS) {
    g_debug->record->AddEntry(new MallocEntry(result.getValue<void*>(), size,
                                              result.GetStartTimeNS(), result.GetEndTimeNS()));
  }

  return result.getValue<void*>();
}
InternalMalloc() 实现,可以看到下面代码中有多处根据 g_debug 的成员函数判断要执行的操作。
// malloc_debug.cpp
static TimedResult InternalMalloc(size_t size) {
 if ((g_debug->config().options() & BACKTRACE) && g_debug->pointer->ShouldDumpAndReset()) {
   debug_dump_heap(android::base::StringPrintf(
                       "%s.%d.txt", g_debug->config().backtrace_dump_prefix().c_str(), getpid())
                       .c_str());
 }

 if (size == 0) {
   size = 1;
 }

 TimedResult result;

 size_t real_size = size + g_debug->extra_bytes();
 if (real_size < size) {
   // Overflow.
   errno = ENOMEM;
   result.setValue<void*>(nullptr);
   return result;
 }

 if (size > PointerInfoType::MaxSize()) {
   errno = ENOMEM;
   result.setValue<void*>(nullptr);
   return result;
 }

 if (g_debug->HeaderEnabled()) {
   result = TCALL(memalign, MINIMUM_ALIGNMENT_BYTES, real_size);
   Header* header = reinterpret_cast<Header*>(result.getValue<void*>());
   if (header == nullptr) {
     return result;
   }
   result.setValue<void*>(InitHeader(header, header, size));
 } else {
   result = TCALL(malloc, real_size);
 }

 void* pointer = result.getValue<void*>();

 if (pointer != nullptr) {
   if (g_debug->TrackPointers()) {
     PointerData::Add(pointer, size);
   }

   if (g_debug->config().options() & FILL_ON_ALLOC) {
     size_t bytes = InternalMallocUsableSize(pointer);
     size_t fill_bytes = g_debug->config().fill_on_alloc_bytes();
     bytes = (bytes < fill_bytes) ? bytes : fill_bytes;
     memset(pointer, g_debug->config().fill_alloc_value(), bytes);
   }
 }

 return result;
}
在 PointData 里维护了一个全局的 pointers_ map。每次申请内存时调用 Add 函数增加 pointers_ 成员,释放内存时调用 Remove 函数移除 pointers_ 成员。申请内存时调用的Add 函数见上面的代码段PointerData::Add(pointer, size);,释放内存时PointerData::Remove(pointer);。
// malloc_debug.cpp
static TimedResult InternalFree(void* pointer) {
...
  if (g_debug->TrackPointers()) {
    PointerData::Remove(pointer);
  }
...
  return result;
}
退出时调用 debug_finalize() 打印内存泄漏并保存dump 文件
调用 LogLeaks() 将内存泄漏信息在log 打印,将dump 文件写入手机存储。
// malloc_debug.cpp
void debug_finalize() {
  if (g_debug == nullptr) {
    return;
  }

  // Make sure that there are no other threads doing debug allocations
  // before we kill everything.
  ScopedConcurrentLock::BlockAllOperations();

  // Turn off capturing allocations calls.
  DebugDisableSet(true);

  if (g_debug->config().options() & FREE_TRACK) {
    PointerData::VerifyAllFreed();
  }

  if (g_debug->config().options() & LEAK_TRACK) {
    PointerData::LogLeaks();
  }

  if ((g_debug->config().options() & BACKTRACE) && g_debug->config().backtrace_dump_on_exit()) {
    debug_dump_heap(android::base::StringPrintf("%s.%d.exit.txt",
                                                g_debug->config().backtrace_dump_prefix().c_str(),
                                                getpid()).c_str());
  }

  backtrace_shutdown();

  // In order to prevent any issues of threads freeing previous pointers
  // after the main thread calls this code, simply leak the g_debug pointer
  // and do not destroy the debug disable pthread key.
}
LogLeaks() 内部调用 GetList 函数获得 pointers_ 成员,按照 allocation size 排序后返回。
// PointerData.cpp
void PointerData::LogLeaks() {
  std::vector<ListInfoType> list;

  std::lock_guard<std::mutex> pointer_guard(pointer_mutex_);
  std::lock_guard<std::mutex> frame_guard(frame_mutex_);
  GetList(&list, false);

  size_t track_count = 0;
  for (const auto& list_info : list) {
    error_log("+++ %s leaked block of size %zu at 0x%" PRIxPTR " (leak %zu of %zu)", getprogname(),
              list_info.size, list_info.pointer, ++track_count, list.size());
    if (list_info.backtrace_info != nullptr) {
      error_log("Backtrace at time of allocation:");
      UnwindLog(*list_info.backtrace_info);
    } else if (list_info.frame_info != nullptr) {
      error_log("Backtrace at time of allocation:");
      backtrace_log(list_info.frame_info->frames.data(), list_info.frame_info->frames.size());
    }
    // Do not bother to free the pointers, we are about to exit any way.
  }
}
小结
- libc 初始化时通过属性控制加载 lib_malloc_debug.so;
- 替换系统 malloc/free 函数指针,注册退出时的调用的检测函数;
- 维护一个列表记录每一次的内存申请和释放信息;
- 每次 malloc 内存时列表成员+1,内存free 时列表成员-1;
- 程序退出时列表中还存在的成员即是内存泄漏的成员。
libmemunreachable 原理介绍
概述
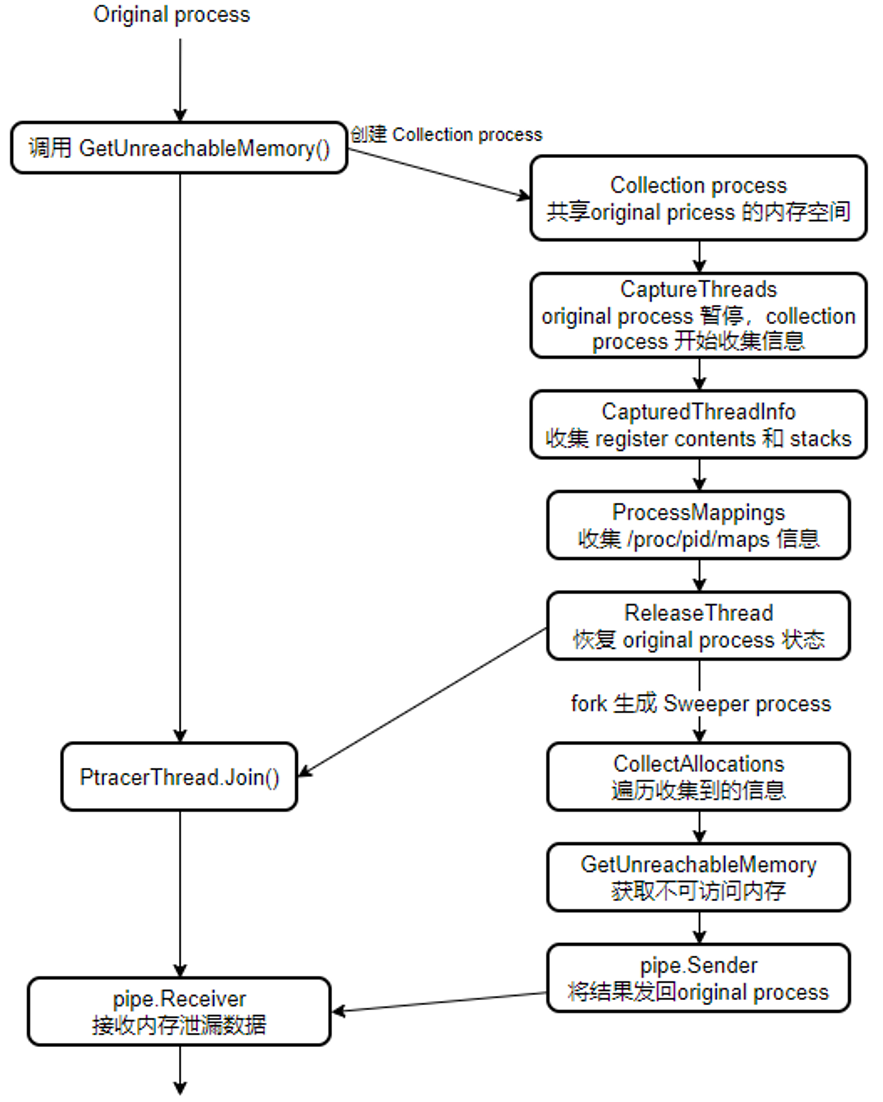
- 执行泄漏检测过程所需的步骤序列分为三个 process – original process、collection process 和 sweeper process;
- Original process 调用 GetUnreachableMemory 接口;
- Collection process 收集内存信息;
- Sweeper process 遍历内存信息得到内存泄漏结果返回给Original process;
整体流程图
接下来我们深入看一下每个步骤做了什么工作。
CaptureThreads() 函数遍历 pid 下所有 tid,调用 ptrace 使得线程的寄存器和内存信息可以被读取;
// ThreadCapture.cpp
bool ThreadCaptureImpl::CaptureThreads() {
  TidList tids{allocator_};

  bool found_new_thread;
  do {
    if (!ListThreads(tids)) {
      ReleaseThreads();
      return false;
    }

    found_new_thread = false;

    for (auto it = tids.begin(); it != tids.end(); it++) {
      auto captured = captured_threads_.find(*it);
      if (captured == captured_threads_.end()) {
        if (CaptureThread(*it) < 0) {
          ReleaseThreads();
          return false;
        }
        found_new_thread = true;
      }
    }
  } while (found_new_thread);

  return true;
}
CapturedThreadInfo() 函数获取线每个线程的 regs 和 stack 内容;
// ThreadCapture.cpp
bool ThreadCaptureImpl::CapturedThreadInfo(ThreadInfoList& threads) {
  threads.clear();

  for (auto it = captured_threads_.begin(); it != captured_threads_.end(); it++) {
    ThreadInfo t{0, allocator::vector<uintptr_t>(allocator_), std::pair<uintptr_t, uintptr_t>(0, 0)};
    if (!PtraceThreadInfo(it->first, t)) {
      return false;
    }
    threads.push_back(t);
  }
  return true;
}
ProcessMappings() 函数读取 pid maps 内容;
// ProcessMappings.cpp
bool ProcessMappings(pid_t pid, allocator::vector<Mapping>& mappings) {
  char map_buffer[1024];
  snprintf(map_buffer, sizeof(map_buffer), "/proc/%d/maps", pid);
  android::base::unique_fd fd(open(map_buffer, O_RDONLY));
  if (fd == -1) {
    return false;
  }
  allocator::string content(mappings.get_allocator());
  ssize_t n;
  while ((n = TEMP_FAILURE_RETRY(read(fd, map_buffer, sizeof(map_buffer)))) > 0) {
    content.append(map_buffer, n);
  }
  ReadMapCallback callback(mappings);
  return android::procinfo::ReadMapFileContent(&content[0], callback);
}
解析后的mapping
// Example of how a parsed line look line:
// 00400000-00409000 r-xp 00000000 fc:00 426998  /usr/lib/gvfs/gvfsd-http
格式和用dumpsys meminfo 得到的内容类似,只是这里通过一个回调函数把他们组装成了 Mapping 的数据结构。
CollectAllocations() 函数
- 调用 ClassifyMappings() 函数将 mappings 信息按照包含的关键字分类存放到 globals_mappings,heap_mappings,stack_mappings,anon_mappings(没有真正使用);
- 将 heap mapping allocation 记录插入到 allocations_ map 里,记录总的 allocation 的范围,以及总的 allocation bytes;
- 将每一条 globals mapping 和 stack mapping 的 range 插入到 roots_ vector;
bool MemUnreachable::CollectAllocations(const allocator::vector<ThreadInfo>& threads,
                                        const allocator::vector<Mapping>& mappings,
                                        const allocator::vector<uintptr_t>& refs) {
  MEM_ALOGI("searching process %d for allocations", pid_);

  for (auto it = mappings.begin(); it != mappings.end(); it++) {
    heap_walker_.Mapping(it->begin, it->end);
  }

  allocator::vector<Mapping> heap_mappings{mappings};
  allocator::vector<Mapping> anon_mappings{mappings};
  allocator::vector<Mapping> globals_mappings{mappings};
  allocator::vector<Mapping> stack_mappings{mappings};
  if (!ClassifyMappings(mappings, heap_mappings, anon_mappings, globals_mappings, stack_mappings)) {
    return false;
  }

  for (auto it = heap_mappings.begin(); it != heap_mappings.end(); it++) {
    MEM_ALOGV("Heap mapping %" PRIxPTR "-%" PRIxPTR " %s", it->begin, it->end, it->name);
    HeapIterate(*it,
                [&](uintptr_t base, size_t size) { heap_walker_.Allocation(base, base + size); });
  }

  for (auto it = anon_mappings.begin(); it != anon_mappings.end(); it++) {
    MEM_ALOGV("Anon mapping %" PRIxPTR "-%" PRIxPTR " %s", it->begin, it->end, it->name);
    heap_walker_.Allocation(it->begin, it->end);
  }

  for (auto it = globals_mappings.begin(); it != globals_mappings.end(); it++) {
    MEM_ALOGV("Globals mapping %" PRIxPTR "-%" PRIxPTR " %s", it->begin, it->end, it->name);
    heap_walker_.Root(it->begin, it->end);
  }

  for (auto thread_it = threads.begin(); thread_it != threads.end(); thread_it++) {
    for (auto it = stack_mappings.begin(); it != stack_mappings.end(); it++) {
      if (thread_it->stack.first >= it->begin && thread_it->stack.first <= it->end) {
        MEM_ALOGV("Stack %" PRIxPTR "-%" PRIxPTR " %s", thread_it->stack.first, it->end, it->name);
        heap_walker_.Root(thread_it->stack.first, it->end);
      }
    }
    heap_walker_.Root(thread_it->regs);
  }

  heap_walker_.Root(refs);

  MEM_ALOGI("searching done");

  return true;
}
GetUnreachableMemory()
- 调用 DetectLeaks() 检测泄漏,遍历 roots_ vector 里保存的 mapping ,给在 range 内的 allocator 地址加上可从 root 引用的标记;
- 调用 Leaked() 遍历总的 allocations_ map 记录,没有被标记引用的记录被认为是泄漏的内存。记录泄漏的数量和泄漏的大小,将记录保存到 leaked vector;
// MemUnreachable.cpp
bool MemUnreachable::GetUnreachableMemory(allocator::vector<Leak>& leaks, size_t limit,
                                          size_t* num_leaks, size_t* leak_bytes) {
  MEM_ALOGI("sweeping process %d for unreachable memory", pid_);
  leaks.clear();

  if (!heap_walker_.DetectLeaks()) {
    return false;
  }

  allocator::vector<Range> leaked1{allocator_};
  heap_walker_.Leaked(leaked1, 0, num_leaks, leak_bytes);

  MEM_ALOGI("sweeping done");

  MEM_ALOGI("folding related leaks");

  // ...  这部分内容还没有细看,暂时跳过

  MEM_ALOGI("folding done");

  std::sort(leaks.begin(), leaks.end(),
            [](const Leak& a, const Leak& b) { return a.total_size > b.total_size; });

  if (leaks.size() > limit) {
    leaks.resize(limit);
  }

  return true;
}
检测泄漏
遍历 roots_ vector 里保存的 mapping ,给在 range 内的 allocator 地址加上可从 root 引用的标记;
// HeapWalker.cpp
bool HeapWalker::DetectLeaks() {
  // Recursively walk pointers from roots to mark referenced allocations
  for (auto it = roots_.begin(); it != roots_.end(); it++) {
    RecurseRoot(*it);
  }

  Range vals;
  vals.begin = reinterpret_cast<uintptr_t>(root_vals_.data());
  vals.end = vals.begin + root_vals_.size() * sizeof(uintptr_t);

  RecurseRoot(vals);

  if (segv_page_count_ > 0) {
    MEM_ALOGE("%zu pages skipped due to segfaults", segv_page_count_);
  }

  return true;
}

// 遍历总的 allocations_ map 记录,没有被标记引用的记录被认为是泄漏的内存。记录泄漏的数量和泄漏的大小,将记录保存到 leaked vector;
bool HeapWalker::Leaked(allocator::vector<Range>& leaked, size_t limit, size_t* num_leaks_out,
                        size_t* leak_bytes_out) {
  leaked.clear();

  size_t num_leaks = 0;
  size_t leak_bytes = 0;
  for (auto it = allocations_.begin(); it != allocations_.end(); it++) {
    if (!it->second.referenced_from_root) {
      num_leaks++;  // 泄漏的数量
      leak_bytes += it->first.end - it->first.begin;  // 泄漏的总大小
    }
  }

  size_t n = 0;
  for (auto it = allocations_.begin(); it != allocations_.end(); it++) {
    if (!it->second.referenced_from_root) {
      if (n++ < limit) {
        leaked.push_back(it->first);  // 泄漏的记录
      }
    }
  }

  if (num_leaks_out) {
    *num_leaks_out = num_leaks;  // 更新输出
  }
  if (leak_bytes_out) {
    *leak_bytes_out = leak_bytes;  // 更新输出
  }

  return true;
}
小结
- Original process 调用 GetUnreachableMemory 接口触发内存泄漏检测;
- 创建 Collection process (共享 Original process 内存空间 )收集 regs,stack,heap 内存信息;
- 收集完毕后恢复 Original process 状态;
- 创建 Sweeper process 遍历内存信息得到内存泄漏结果;
- Sweeper process 将收集到的泄漏信息传送给 Original process;
总结
本文我们介绍了 Malloc Debug 和 libmenunreacbale 的大致工作原理介绍,下一篇我们将介绍如何自己编码实现一个初级的“内存泄漏”检测工具。
参考链接
- 【内存】Android C/C++ 内存泄漏分析 unreachable
- Malloc Debug (googlesource.com)
- libmemunreachable (googlesource.com)