一、项目场景:
Java使用JFreeChart库生成图片,主要场景为将具体的数据 可视化 生成曲线图等的图表。
本篇文章主要针对为数据集生成的图表添加特殊点及其标识框。具体包括两种场景:x轴为 时间戳 类型和普通 数值 类型。(y轴都为数值类型)
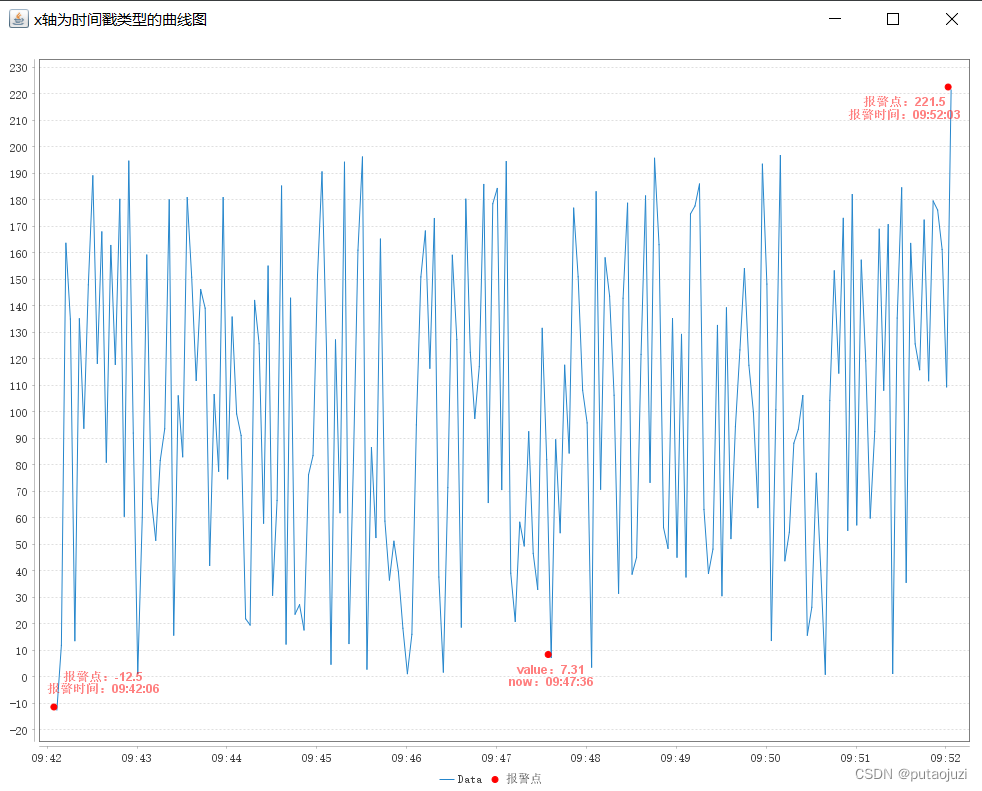
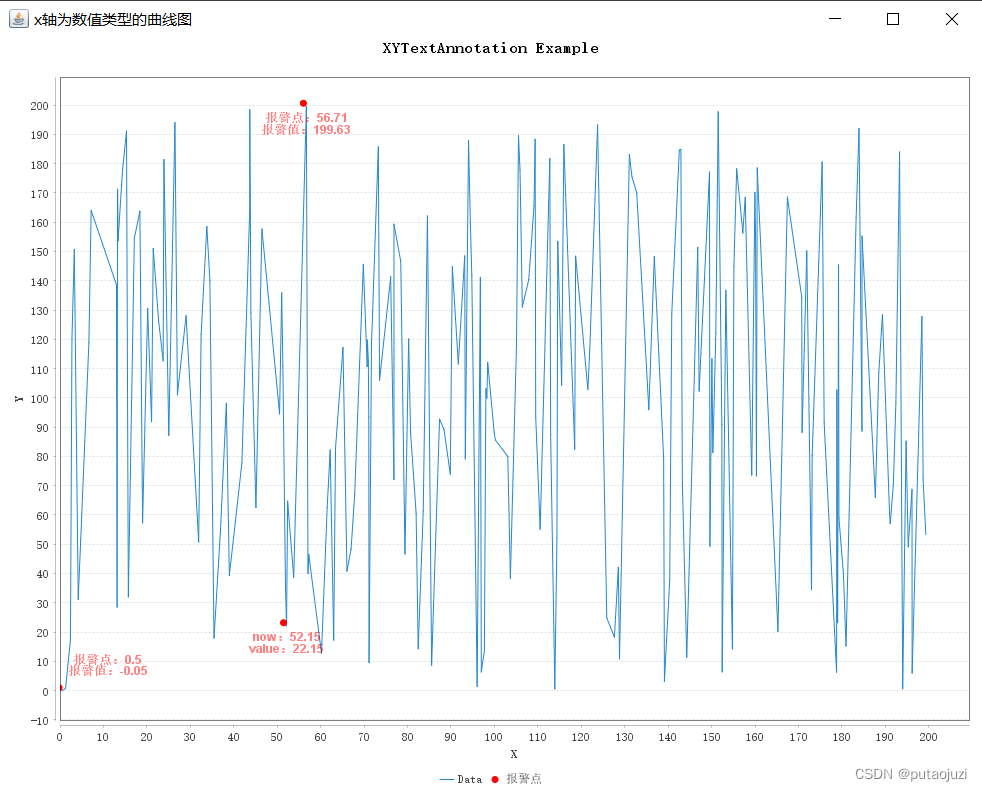
具体的效果图如下所示:
❀ x轴为 时间戳 形式
❀ x轴为 数值 形式
二、注意事项
❀ 前提介绍
这里 标注特殊点 以及 添加文本标识框 都不算是正规的方法,但是只要注意使 用,也是十分好用的。(正规的方法也能做,估计效果不一定ok)
实现方法: 利用JFreeChart一次可以将多个数据集渲染,也就是说可以一次画多条曲线(好像这种特性是普遍都有的QAQ),将所有的特殊点作为一个统一的数据集,放在整个(数据集)集合 的末尾。让集合的其它数据集正常渲染,然后取出最后一个特殊点数据集进行特殊样式化处理。比如:只显示点、点特殊显示、在点的附近添加文本注释框。这样做的好处就是:可以非常方便的添加多个特殊点。
(前提是特殊点一定是某个数据集的点位)
❀ 注意事项
🐟 多个数据集的命名不能重复,否则会出现某个数据集的数据不能正常显示;

🐟 如果添加的文本注释框需要换行功能,可惜JFreeChart中的XYTextAnnotation并不包括这个功能,即使在文本中手动添加 '\n' 也无法实现换行。这里采用添加多个注释框,再适当的调整位置,手动实现换行(也存在弊端,当图片缩放时,多行的文本注释框的内容可能会重叠或相隔太远的问题,笔者已经试着在解决这个问题了,但是效果仍未达到完美)
🐟 为特殊点添加文本注释框时,避免不了一个问题:当特殊点出现在图表边缘位置的时候,文本显示不完全。 这里呢,已经简单的根据x轴和y轴的数据范围进行了调整,也就是下面代码中annotationXPosFormat 和 annotationYPosFormat 方法所完成的功能。
But,解决了但没完全解决!窗口的大小也与文本框的位置调整相关,这方面我还没完善,但是如果仅需要生成一张数据可视化图片(例如:报警图),意思是不涉及图片(窗口)大小的随意变化的画,下面的代码完全是够用的了。
三、代码记录
这里直接给出所有的代码:
❀ 依赖库
<!--        JFreeChart-->
<dependency>
   <groupId>org.jfree</groupId>
   <artifactId>jfreechart</artifactId>
   <version>1.5.3</version>
</dependency>

<!--        hutool-->
<dependency>
   <groupId>cn.hutool</groupId>
   <artifactId>hutool-all</artifactId>
   <version>5.8.16</version>
</dependency>
❀ 完整代码:
public class SpecialPointAnnotationFormat {
    public static void main(String[] args) {
        //创建主题样式 解决乱码(CN代表中文,这一步一定要添加)
        StandardChartTheme standardChartTheme = new StandardChartTheme("CN");
        //设置标题字体
        standardChartTheme.setExtraLargeFont(new Font("宋体", Font.BOLD, 15));
        //设置图例的字体
        standardChartTheme.setRegularFont(new Font("宋体", Font.PLAIN, 12));
        //设置轴向的字体
        standardChartTheme.setLargeFont(new Font("宋体", Font.BOLD, 12));
        //设置主题样式
        ChartFactory.setChartTheme(standardChartTheme);

        // 展示x轴为时间戳的图表
//        showXTimeSeriesChart(1600,1000);
//        showXTimeSeriesChart(1200,750);
//        showXTimeSeriesChart(800,500);
//        showXTimeSeriesChart(400,250);
        // 建议的图片大小
        showXTimeSeriesChart(1000,800);

        // 展示x轴为普通数值的图表
//        showXNumberSeriesChart(1000,800);
    }

    // 展示x轴为普通数值的图表
    private static void showXNumberSeriesChart(int width,int height){
        // 准备数据
        XYSeries xySeries = new XYSeries("Data");
        // 报警点
        double xValue = 52.15d;
        double yValue = 22.15d;

		// 手动初始化数据集
        int dataSize = 200;
        xySeries.add(0.5,-0.05);
        for(int i=1;i<dataSize;i++){
//        for(int i=0;i<dataSize;i++){
            if(i == 100){
                xySeries.add(xValue,yValue);
                continue;
            }
            xySeries.add(getRandomDouble(dataSize),getRandomDouble(dataSize));
        }

		// 整个数据集的集合seriesCollection
        XYSeriesCollection seriesCollection = new XYSeriesCollection();
        seriesCollection.addSeries(xySeries);

        // 创建示例数据集
        XYDataset dataset = seriesCollection;

        // 创建图表
        JFreeChart chart = ChartFactory.createXYLineChart(
                "XYTextAnnotation Example",
                "X",
                "Y",
                dataset
        );

        // 获取图表的绘图区域
        XYPlot plot = chart.getXYPlot();

        // 设置曲线颜色
        plot.getRenderer().setSeriesPaint(0, Color.decode("#2586CC"));
        // 设置图表背景颜色
        plot.setBackgroundPaint(Color.WHITE);
        plot.setDomainGridlinePaint(Color.WHITE);
        plot.setRangeGridlinePaint(Color.WHITE);
        plot.setAxisOffset(new RectangleInsets(15.0, 5.0, 5.0, 5.0));
        plot.setRangeGridlinePaint(Color.LIGHT_GRAY);

        // 找到报警点对应的值
        Optional alarmOption = xySeries.getItems().stream().filter(obj -> {
            XYDataItem dataItem = (XYDataItem) obj;
            return NumberUtil.equals(dataItem.getXValue(), xValue) && NumberUtil.equals(dataItem.getYValue(), yValue);
        }).findFirst();
        if(alarmOption.isPresent()){
            XYDataItem alarmItem = (XYDataItem) alarmOption.get();
            addNumberSpecialPoint(plot,xySeries,alarmItem,"报警点","now","value");
        }else {
            System.out.println("未在数据集中找到报警点....");
        }

        // 找到值最大的点
        Optional<XYDataItem> maxOption = xySeries.getItems().stream().max(Comparator.comparingDouble(XYDataItem::getYValue));
        if (maxOption.isPresent()) {
            XYDataItem maxDataItem = maxOption.get();
            addNumberSpecialPoint(plot,xySeries,maxDataItem,"报警点","报警点","报警值");
        }
        // 找到值最小的点
        Optional<XYDataItem> minOption = xySeries.getItems().stream().min(Comparator.comparingDouble(XYDataItem::getYValue));
        if (minOption.isPresent()) {
            XYDataItem minDataItem = minOption.get();
            addNumberSpecialPoint(plot,xySeries,minDataItem,"报警点","报警点","报警值");
        }

        // 创建图表窗口并显示图表
        ChartFrame frame = new ChartFrame("x轴为数值类型的曲线图", chart);
        frame.setPreferredSize(new Dimension(width, height));
        frame.pack();
        frame.setVisible(true);
    }

    // 展示x轴为时间戳的图表
    private static void showXTimeSeriesChart(int width,int height){
        LocalDateTime alarmTime = LocalDateTime.now();

        LocalDateTime dateTime = alarmTime.minusMinutes(5l).minusSeconds(30l);

        TimeSeries series = new TimeSeries("Data");

		// 手动初始化数据集
        int num = 200;
        series.add(new Millisecond(Date.from(dateTime.atZone(ZoneId.systemDefault()).toInstant())),-12.5d);
//        for(int i=1;i<num;i++){
//        for(int i=0;i<num;i++){
        for(int i=1;i<num-1;i++){
            series.add(new Millisecond(Date.from(dateTime.plusSeconds((long)3*i).atZone(ZoneId.systemDefault()).toInstant())),getRandomDouble(num));
        }
        series.add(new Millisecond(Date.from(dateTime.plusSeconds((long)3*(num-1)).atZone(ZoneId.systemDefault()).toInstant())),num + 21.5);

		// 整个数据集的集合seriesCollection
        TimeSeriesCollection seriesCollection = new TimeSeriesCollection();
        seriesCollection.addSeries(series);

        // 创建示例数据集
        XYDataset dataset = seriesCollection;

        // 创建曲线图
        JFreeChart chart = ChartFactory.createTimeSeriesChart(
                "", // 图表标题
                "", // X轴标签
                "", // Y轴标签
                dataset // 数据集
        );

        // 获取图表的绘图区域
        XYPlot plot = chart.getXYPlot();

        // 设置曲线颜色
        plot.getRenderer().setSeriesPaint(0, Color.decode("#2586CC"));
        // 设置图表背景颜色
        plot.setBackgroundPaint(Color.WHITE);
        plot.setDomainGridlinePaint(Color.WHITE);
        plot.setRangeGridlinePaint(Color.WHITE);
        plot.setAxisOffset(new RectangleInsets(15.0, 5.0, 5.0, 5.0));
        plot.setRangeGridlinePaint(Color.LIGHT_GRAY);

        // 找到报警点对应的值
        // 将报警时间转换为毫秒表示
        long alarmTimeMillis = alarmTime.atZone(ZoneId.systemDefault()).toInstant().toEpochMilli();
        Optional alarmOptional = series.getItems().stream().filter(obj -> {
            long firstMillisecond = ((TimeSeriesDataItem) obj).getPeriod().getFirstMillisecond();
            return firstMillisecond == alarmTimeMillis;
        }).findFirst();
        if(alarmOptional.isPresent()){
            TimeSeriesDataItem alarmItem = (TimeSeriesDataItem) alarmOptional.get();
            addTimeSpecialPoint(plot,series,alarmItem,"报警点", "now","value");
        }else {
            System.out.println("未在数据集中找到报警点....");
        }

        // 找到值最大的点(一般值最大的点为报警点)
        Optional<TimeSeriesDataItem> maxOption = series.getItems().stream().max(Comparator.comparingDouble(item -> ((TimeSeriesDataItem) item).getValue().doubleValue()));
        if (maxOption.isPresent()) {
            TimeSeriesDataItem maxDataItem = maxOption.get();
            addTimeSpecialPoint(plot,series,maxDataItem,"报警点","报警时间","报警点");
        }
        // 找到值最小的点(一般值最大的点为报警点)
        Optional<TimeSeriesDataItem> minOption = series.getItems().stream().min(Comparator.comparingDouble(item -> ((TimeSeriesDataItem) item).getValue().doubleValue()));
        if (minOption.isPresent()) {
            TimeSeriesDataItem minDataItem = minOption.get();
            addTimeSpecialPoint(plot,series,minDataItem,"报警点","报警时间","报警点");
        }

        double xRange = plot.getDomainAxis().getRange().getLength();
        double yRange = plot.getRangeAxis().getRange().getLength();

        // 创建图表窗口并显示图表
        ChartFrame frame = new ChartFrame("x轴为时间戳类型的曲线图", chart);
        frame.setPreferredSize(new Dimension(width,height));
        frame.pack();// pack会默认渲染为frame的最佳尺寸
        frame.setVisible(true);

		// 这里也可以直接生成一张图片存放到指定位置(path)
        // 生成一张图片
//        try {
//            ByteArrayOutputStream out = new ByteArrayOutputStream();
//            ChartUtils.writeChartAsJPEG(out, chart, 1000, 800);
//            String path = System.getProperty("user.dir") + "\\images\\image.jpg";
//
//            downloadByteArrayOutputStream(out.toByteArray(), path);
//        } catch (IOException e) {
//            throw new RuntimeException(e);
//        }
    }

    public static void downloadByteArrayOutputStream(byte[] data, String outputPath) {
        try {
            ByteArrayInputStream inputStream = new ByteArrayInputStream(data);
            FileOutputStream outputStream = new FileOutputStream(outputPath);

            // 将字节数组写入到文件
            byte[] buffer = new byte[1024];
            int bytesRead;
            while ((bytesRead = inputStream.read(buffer)) != -1) {
                outputStream.write(buffer, 0, bytesRead);
            }

            // 关闭流
            inputStream.close();
            outputStream.close();

            System.out.println("文件下载完成:" + outputPath);
        } catch (IOException e) {
            e.printStackTrace();
        }
    }

    /**
     * 图表添加特殊点(x轴为数值类型:double)
     * @param plot 图层
     * @param xySeries 一个chart可以有多个数据集(多条折线),需要标识为哪个数据集添加特殊点
     * @param dataItem 需要标识的点
     * @param specialTextTitle 特殊点集合名称标识(可置为“”,注意不同数据集的名称不可重复)
     * @param xSpecialText 特殊点对应的x轴的提示内容
     * @param ySpecialText 特殊点对应的y轴的提示内容
     */
    private static void addNumberSpecialPoint(XYPlot plot,
                                              XYSeries xySeries ,
                                              XYDataItem dataItem,
                                              String specialTextTitle,
                                              String xSpecialText,
                                              String ySpecialText){
        XYSeriesCollection seriesCollection = (XYSeriesCollection) plot.getDataset();

        XYItemRenderer r = plot.getRenderer();
        XYLineAndShapeRenderer renderer = (XYLineAndShapeRenderer) r;

        double xValue = dataItem.getXValue();
        double yValue = dataItem.getYValue();

        // 设置特殊点的集合
        // 判断特殊点集合之前是否已创建
        XYSeries specialSeries = null;
        int seriesSize = seriesCollection.getSeries().size();
        if(seriesSize > 1){
            specialSeries = (XYSeries)seriesCollection.getSeries().get(seriesSize-1);
            // 再判断特殊点是否已添加
            Optional optional = specialSeries.getItems().stream().filter(item -> {
                XYDataItem xyDataItem = (XYDataItem) item;
                return NumberUtil.equals(xValue, xyDataItem.getXValue()) && NumberUtil.equals(yValue, xyDataItem.getYValue());
            }).findFirst();
            if(optional.isPresent()){
                // 特殊点已经添加
                return;
            }
        }else {
            specialSeries = new XYSeries(specialTextTitle);
            seriesCollection.addSeries(specialSeries);
        }

        // 添加特殊值
        specialSeries.add(xValue,yValue);

        // 格式
        // 设置文本颜色和透明度
        Color textColor = new Color(255, 0, 0, 128); // 设置为半透明的红色(透明度为 128)
        Font font = new Font("SansSerif", Font.BOLD, 12);

        // 创建一个带文字的注释框
        String alarmText1 = xSpecialText + ":" + xValue;
        XYTextAnnotation line1 = new XYTextAnnotation(alarmText1,xValue,yValue);
        line1.setFont(font);
        line1.setPaint(textColor);
        line1.setX((double) annotationXPosFormat(plot,xySeries,xValue, TextAnnotationTypeEnum.DOUBLE.getType()));
        line1.setY(annotationYPosFormat(plot,xySeries,yValue,TextAnnotationTypeEnum.DOUBLE.getType()));
        plot.addAnnotation(line1);

        double lineSpace = 3.0; // 3
        Optional<XYDataItem> maxOption = xySeries.getItems().stream().max(Comparator.comparingDouble(XYDataItem::getYValue));
        Optional<XYDataItem> minOption = xySeries.getItems().stream().min(Comparator.comparingDouble(XYDataItem::getYValue));
        if(maxOption.isPresent() && minOption.isPresent()) {
            double sub = maxOption.get().getYValue() - minOption.get().getYValue();
            lineSpace = sub/50;
        }
        String alarmText2 = ySpecialText + ":" + yValue;
        XYTextAnnotation line2 = new XYTextAnnotation(alarmText2,xValue,yValue);
        line2.setFont(font);
        line2.setPaint(textColor);
        line2.setX((double)annotationXPosFormat(plot,xySeries,xValue,TextAnnotationTypeEnum.DOUBLE.getType()));
        line2.setY(annotationYPosFormat(plot,xySeries,yValue,TextAnnotationTypeEnum.DOUBLE.getType())-lineSpace);
        plot.addAnnotation(line2);

        int pointSize = 3;
        Shape specifiedShape = new Ellipse2D.Double(-(pointSize*2), -(pointSize*2), pointSize*2, pointSize*2); // 指定点显示的形状
        Paint specifiedPaint = Color.RED; // 指定点显示的颜色

        // 对某个指定序列集合的点进行操作
        renderer.setSeriesShapesVisible(seriesCollection.getSeriesCount() - 1, true); // 显示指定点的形状
        renderer.setSeriesShape(seriesCollection.getSeriesCount() - 1, specifiedShape); // 设置指定点的形状
        renderer.setSeriesPaint(seriesCollection.getSeriesCount() - 1, specifiedPaint); // 设置指定点的颜色
        // 特殊点只显示点,而不显示曲线
        renderer.setSeriesLinesVisible(seriesCollection.getSeriesCount() - 1, false); // 不显示曲线
        renderer.setSeriesShapesVisible(seriesCollection.getSeriesCount() - 1, true); // 显示点
    }

    /**
     * 图表添加特殊点(x轴为时间戳类型)
     * @param plot 图层
     * @param timeSeries 一个chart可以有多个数据集(多条折线),需要标识为哪个数据集添加特殊点
     * @param dataItem 需要标识的点
     * @param specialTextTitle 特殊点集合名称标识(可置为“”,注意不同数据集的名称不可重复)
     * @param xSpecialText 特殊点对应的x轴的提示内容
     * @param ySpecialText 特殊点对应的y轴的提示内容
     */
    private static void addTimeSpecialPoint(XYPlot plot,
                                            TimeSeries timeSeries ,
                                            TimeSeriesDataItem dataItem,
                                            String specialTextTitle,
                                            String xSpecialText,
                                            String ySpecialText){
        TimeSeriesCollection seriesCollection = (TimeSeriesCollection) plot.getDataset();

        XYItemRenderer r = plot.getRenderer();
        XYLineAndShapeRenderer renderer = (XYLineAndShapeRenderer) r;

        long xValue = dataItem.getPeriod().getFirstMillisecond();
        double yValue = dataItem.getValue().doubleValue();

        // 设置特殊点的集合
        // 判断特殊点集合之前是否已创建
        TimeSeries specialSeries = null;
        int seriesSize = seriesCollection.getSeries().size();
        if(seriesSize > 1){
            specialSeries = (TimeSeries)seriesCollection.getSeries().get(seriesSize-1);
            // 再判断特殊点是否已添加
            Optional optional = specialSeries.getItems().stream().filter(item -> {
                TimeSeriesDataItem timeDataItem = (TimeSeriesDataItem) item;
                return NumberUtil.equals(xValue, timeDataItem.getPeriod().getFirstMillisecond()) && NumberUtil.equals(yValue, timeDataItem.getValue().doubleValue());
            }).findFirst();
            if(optional.isPresent()){
                // 特殊点已经添加
                return;
            }
        }else {
            specialSeries = new TimeSeries(specialTextTitle);
            seriesCollection.addSeries(specialSeries);
        }

        // 添加特殊值
        specialSeries.add(dataItem.getPeriod(),dataItem.getValue().doubleValue());

        // 格式
        // 设置文本颜色和透明度
        Color textColor = new Color(255, 0, 0, 128); // 设置为半透明的红色(透明度为 128)
        Font font = new Font("SansSerif", Font.BOLD, 12);

        // 创建一个带文字的注释框
        String alarmText1 = ySpecialText + ":" + yValue;
        XYTextAnnotation line1 = new XYTextAnnotation(alarmText1,xValue,yValue);
        line1.setFont(font);
        line1.setPaint(textColor);
        line1.setX((long)annotationXPosFormat(plot,timeSeries,xValue, TextAnnotationTypeEnum.TIME.getType()));
        line1.setY(annotationYPosFormat(plot,timeSeries,yValue,TextAnnotationTypeEnum.TIME.getType()));
        plot.addAnnotation(line1);

        /**
         * 通过获取font获取一行字的行高
         */
//        // 设置XYTextAnnotation之间的行间距
//        // 获取font的行高
//        FontMetrics fontMetrics = Toolkit.getDefaultToolkit().getFontMetrics(font);
//        int lineHeight = fontMetrics.getHeight();
//        // 250->1.2 | 500->0.6 | 750->0.3 | 1000->0.2
//        double lineSpace = lineHeight + xx;
//        System.out.println("lineSpace=" + lineSpace);
//        System.out.println("xx=" + xx);

        // 设置换行的间隔
        double lineSpace = 3.0; // 3
        Optional<TimeSeriesDataItem> maxOption = timeSeries.getItems().stream().max(Comparator.comparingDouble(item -> ((TimeSeriesDataItem) item).getValue().doubleValue()));
        Optional<TimeSeriesDataItem> minOption = timeSeries.getItems().stream().min(Comparator.comparingDouble(item -> ((TimeSeriesDataItem) item).getValue().doubleValue()));
        if(maxOption.isPresent() && minOption.isPresent()) {
            double sub = maxOption.get().getValue().doubleValue() - minOption.get().getValue().doubleValue();
            lineSpace = sub/50;
        }

        String alarmText2 = xSpecialText + ":" + LocalDateTime.ofInstant(Instant.ofEpochMilli(xValue), ZoneId.systemDefault()).format(DatePattern.NORM_TIME_FORMATTER);
        XYTextAnnotation line2 = new XYTextAnnotation(alarmText2,xValue,yValue);
        line2.setFont(font);
        line2.setPaint(textColor);
        line2.setX((long)annotationXPosFormat(plot,timeSeries,xValue,TextAnnotationTypeEnum.TIME.getType()));
        line2.setY(annotationYPosFormat(plot,timeSeries,yValue,TextAnnotationTypeEnum.TIME.getType())-lineSpace);
        plot.addAnnotation(line2);

        int dotSize = 3;
        Shape specifiedShape = new Ellipse2D.Double(-(dotSize*2), -(dotSize*2), dotSize*2, dotSize*2); // 指定点显示的形状
        Paint specifiedPaint = Color.RED; // 指定点显示的颜色

        // 对特殊点集合的点进行操作()
        renderer.setSeriesShapesVisible(seriesCollection.getSeriesCount() - 1, true); // 显示指定点的形状
        renderer.setSeriesShape(seriesCollection.getSeriesCount() - 1, specifiedShape); // 设置指定点的形状
        renderer.setSeriesPaint(seriesCollection.getSeriesCount() - 1, specifiedPaint); // 设置指定点的颜色
        // 特殊点只显示点,而不显示曲线
        renderer.setSeriesLinesVisible(seriesCollection.getSeriesCount() - 1, false); // 不显示曲线
        renderer.setSeriesShapesVisible(seriesCollection.getSeriesCount() - 1, true); // 显示点
    }

    /**
     * XYTextAnnotation 文本框位置(x)调整(防止文本框处于边缘位置导致的文本显示不全)
     * @param series 数据集合
     * @param value x轴的值
     * @param type x轴值的类型(有时间戳类型[long]和数值类型[double])
     * @return 返回值与type的入参类型相同(方法调用处需要类型转换)
     */
    private static Object annotationXPosFormat(XYPlot plot,Series series, Object value, String type){
        // x轴的范围
        double xRange = plot.getDomainAxis().getRange().getLength();
        double offset = xRange * 0.05;

        if(TextAnnotationTypeEnum.TIME.getType().equals(type)){
            // x轴为时间戳形式
            long xValue = (long) value;
            TimeSeries timeSeries = (TimeSeries) series;
            int size = timeSeries.getItems().size();

            long maxValue = timeSeries.getDataItem(size - 1).getPeriod().getFirstMillisecond();
            long minValue = timeSeries.getDataItem(0).getPeriod().getFirstMillisecond();
            if(xValue - minValue <= offset){
                return xValue + (long)offset;
            }
            if(maxValue - xValue <= offset){
                return xValue - (long)offset;
            }
            return xValue;
        }
        else if(TextAnnotationTypeEnum.DOUBLE.getType().equals(type)){
            // x轴为double形式
            double xValue = (double) value;
            XYSeries xySeries = (XYSeries) series;

            Optional<XYDataItem> maxOption = xySeries.getItems().stream().max(Comparator.comparingDouble(XYDataItem::getXValue));
            Optional<XYDataItem> minOption = xySeries.getItems().stream().min(Comparator.comparingDouble(XYDataItem::getXValue));
            if(minOption.isPresent() && xValue - minOption.get().getXValue() <= offset){
                return xValue + offset;
            }
            if(maxOption.isPresent() && maxOption.get().getXValue() - xValue <= offset){
                return xValue - offset;
            }
            return xValue;
        }
        else {
            return value;
        }
    }

    /**
     *  XYTextAnnotation 文本框位置(y)调整(防止文本框处于边缘位置导致的文本显示不全)
     * @param series 数据集合
     * @param yValue y轴的值
     * @param type x轴值的类型(有时间戳类型[long]和数值类型[double])
     * @return 统一为double
     */
    private static double annotationYPosFormat(XYPlot plot ,Series series,double yValue,String type){
        // y轴值的范围
        double yRange = plot.getRangeAxis().getRange().getLength();
        double offset = yRange * 0.05;

        // y轴一般都为double类型
        if(TextAnnotationTypeEnum.TIME.getType().equals(type)){
            TimeSeries timeSeries = (TimeSeries) series;

            Optional<TimeSeriesDataItem> maxOption = timeSeries.getItems().stream().max(Comparator.comparingDouble(item -> ((TimeSeriesDataItem) item).getValue().doubleValue()));
            Optional<TimeSeriesDataItem> minOption = timeSeries.getItems().stream().min(Comparator.comparingDouble(item -> ((TimeSeriesDataItem) item).getValue().doubleValue()));
            if(maxOption.isPresent() && minOption.isPresent()){
                double minValue = minOption.get().getValue().doubleValue();
                double maxValue = maxOption.get().getValue().doubleValue();
                if(minOption.isPresent() && yValue - minValue <= offset){
                    return yValue + offset;
                }
                if(maxOption.isPresent() && maxValue - yValue <= offset){
                    return yValue - offset/3;
                }
                return yValue - offset/3;
            }
            return yValue;
        }
        else if(TextAnnotationTypeEnum.DOUBLE.getType().equals(type)){
            XYSeries xySeries = (XYSeries) series;

            Optional<XYDataItem> maxOption = xySeries.getItems().stream().max(Comparator.comparingDouble(XYDataItem::getYValue));
            Optional<XYDataItem> minOption = xySeries.getItems().stream().min(Comparator.comparingDouble(XYDataItem::getYValue));
            if(maxOption.isPresent() && minOption.isPresent()){
                if(minOption.isPresent() && yValue - minOption.get().getYValue() <= offset){
                    return yValue + offset;
                }
                if(maxOption.isPresent() && maxOption.get().getYValue() - yValue <= offset){
                    return yValue - offset/3;
                }
                return yValue - offset/3;
            }
            return yValue;
        }
        else {
            return yValue;
        }
    }

    /**
     * 获取指定范围的double类型的随机数
     * @param scale 范围
     */
    private static Double getRandomDouble(Integer scale){
        Random random = new Random();
        double randomNumber = random.nextDouble() * scale; // 生成0到100之间的随机小数

        BigDecimal bigDecimal = BigDecimal.valueOf(randomNumber).setScale(2, RoundingMode.HALF_DOWN);

        return bigDecimal.doubleValue();
    }
}
❀
☀
🐟
bye!