Enabling Application Engine Tracing
启用应用程序引擎跟踪
By default, all Application Engine traces are turned off. To see a trace or a combination of traces, set trace options before you run a program.
默认情况下,所有应用程序引擎跟踪都处于关闭状态。若要查看跟踪或跟踪的组合,请在运行程序之前设置跟踪选项。
This section discusses how to:
本节讨论如何:
- Set command line options.
- 设置命令行选项。
- Set parameters in server configuration files.
- 在服务器配置文件中设置参数。
- Set client options in Configuration Manager.
- 在配置管理器中设置客户端选项。
- Enable selective tracing
- 启用选择性跟踪
Setting Command Line Options
设置命令行选项
The command line option is available for Microsoft Windows NT and UNIX, but it is not available when calling Application Engine programs from PeopleCode.
命令行选项对于微软的Windows NT和UNIX是可用的,但是当从PeopleCode调用应用程序引擎程序时,它是不可用的。
To enable tracing from the command line, specify the −TRACE option within the command line that you submit to PSAE.EXE. For example:
要从命令行启用跟踪,请在提交给PSA.EXE的命令行中指定TRACE选项。举个例子:
n:\pt840\bin\client\winx86\psae.exe -CT MICROSFT -CD PT800GES -CO PTDMO -password PTDMO -R PT8GES -AI AETESTPROG −I 45 -TRACE 2
The following table describes the available TRACE option parameter values:
| Value | Description |
| 0 | Disables tracing. |
| 1 | Initiates the Application Engine step trace. |
| 2 | Initiates the Application Engine SQL trace. |
| 4 | Initiates the trace for dedicated temporary table allocation to an Application Engine trace (AET) file. You can trace how the system allocates, locks, and releases temporary tables during program runs. |
| 8 | Initiates the trace for temporary table data. Should be used together with AET file analyzer to display the rows affected by insert/update/delete SQL statements. |
| 128 | Initiates the statement timings trace to a file, which is similar to the COBOL timings trace to a file. |
| 256 | Initiates the PeopleCode detail to the file for the timings trace. |
| 1024 | Initiates the statement timings trace and stores the results in the PS_BAT_TIMINGS_LOG and PS_BAT_TIMINGS_DTL tables. |
| 2048 | Requests a database optimizer trace file. |
| 4096 | Requests a database optimizer to be inserted in the Explain Plan table of the current database. |
| Value | Description |
| 8192 | Sets a trace for PeopleSoft Integration Broker transform programs. |
| 16384 | Initiates a SQL timings trace and stores the results in the PS_ AE_TIMINGS_LG and PS_AE_TIMINGS_DT tables. |
To specify traces on the command line, you enter the sum of the desired trace options. This action is similar to adding the trace values using PSADMIN, such as the COBOL statement timings or the SQL statement trace value. To specify a combination of traces, enter the sum of the corresponding trace values. For example, to enable the step (1), the SQL (2), and the statement timings (128) traces, you would enter 131, which is the sum of 1 + 2 + 128.
若要在命令行上指定跟踪,请输入所需跟踪选项的总和。此操作类似于使用PSADMIN添加跟踪值,例如COBOL语句计时或SQL语句跟踪值。若要指定跟踪的组合,请输入相应跟踪值的总和。例如,为了启用步骤( 1 )、 SQL ( 2 )和语句计时( 128 )跟踪,您应该输入 131 ,这是 1 + 2 + 128 的和。
To disable tracing, explicitly specify −TRACE 0. If you do not include the −TRACE flag in the command line, Application Engine uses the value specified in the Process Scheduler configuration file or in Configuration Manager. Otherwise, the command-line parameters override any trace settings that may be set in Configuration Manager.
若要禁用跟踪,请显式指定TRACE 0。如果未在命令行中包含TRACE标志,则应用程序引擎将使用在“进程计划程序”配置文件或“配置管理器”中指定的值。否则,命令行参数将覆盖Configuration Manager中可能设置的任何跟踪设置。
Setting Parameters in Server Configuration Files
在服务器配置文件中设置参数
You can set the parameters in server configuration files of Application Server or PeopleSoft Process
Scheduler server to enable tracing in them and to get the trace output of both SQL and PeopleCode in the Application Engine Trace (AET) file. You can also set parameter to enable the trace output of sections in Application Engine programs.
您可以在Application Server或PeopleSoft Process Scheduler服务器的服务器配置文件中设置参数,以便在其中启用跟踪,并在Application Engine Trace(AET)文件中获取SQL和PeopleCode的跟踪输出。还可以设置参数以启用应用程序引擎程序中各节的跟踪输出。
Enabling Traces for Application Server and Process Scheduler Server
启用应用程序服务器和进程计划程序服务器的跟踪
You can also enable traces in the configuration files for both the application server and the PeopleSoft Process Scheduler server.
还可以在应用程序服务器和PeopleSoft Process Scheduler服务器的配置文件中启用跟踪。
For programs invoked by PeopleCode and run on the application server, set the TraceAE parameter in the Trace section of the Application Server configuration file (PSAPPSRV.CFG). You can use PSADMIN to set this parameter.
对于由PeopleCode调用并在应用服务器上运行的程序,在应用服务器配置文件(PSAPPSRV.CFG)的TraceAE部分设置TraceAE参数。您可以使用PSADMIN来设置此参数。
In the PeopleSoft Process Scheduler configuration file, set the TraceAE parameter in the Trace section to indicate a level of tracing. You can use PSADMIN to set this parameter.
在PeopleSoft Process Scheduler配置文件中,在Trace部分中设置TraceAE参数以指示跟踪级别。您可以使用PSADMIN来设置此参数。
This option is available on Microsoft Windows NT and UNIX, and it applies only to Application Engine programs invoked in batch mode.
此选项在Microsoft Windows NT和UNIX上可用,并且仅适用于以批处理模式调用的应用程序引擎程序。
Note: The TraceFile parameter does not specify the location of the Application Engine trace file; it applies only to the generic PeopleTools SQL and PeopleCode traces.
附注:TraceFile参数不指定应用程序引擎跟踪文件的位置;它仅适用于一般的PeopleTools SQL和PeopleCode跟踪。
Combining PeopleCode and SQL Trace into AET file
将PeopleCode和SQL Trace组合到AET文件中
You can combine PeopleCode and SQL Trace into AET file. You can set the TraceAECombineOutput parameter in server configuration file of Application Server or Process Scheduler Server to enable this feature.
您可以将PeopleCode和SQL Trace组合到AET文件中。您可以在Application Server或Process Scheduler Server的服务器配置文件中设置TraceAECombineOutput参数来启用该特性。
The default value of this parameter is set to “N”. You can set the parameter, to a value of “Y” to merge SQL/PeopleCode trace into AET file.
这个参数的默认值设置为“N”。您可以将参数设置为“Y”值,以便将SQL/PeopleCode跟踪合并到AET文件中。
Setting Client Options in PeopleSoft Configuration Manager
在PeopleSoft配置管理器中设置客户端选项
For processes running on a Microsoft Windows workstation, you can set trace options using the Trace tab in PeopleSoft Configuration Manager. This procedure is valid only if you are running Application Engine programs on a Microsoft Windows workstation in a development environment.
对于在微软Windows工作站上运行的进程,可以使用PeopleSoft配置管理器中的“跟踪”选项卡设置跟踪选项。只有在开发环境中的Microsoft Windows工作站上运行应用程序引擎程序时,此过程才有效。
Here, you can also define the file size of the trace file.
在这里,您还可以定义跟踪文件的文件大小。
This example illustrates the fields and controls on the Application Engine Trace File Settings. You can find definitions for the fields and controls later on this page.
此示例说明“应用程序引擎跟踪文件设置”上的字段和控件。您可以在本页稍后找到字段和控件的定义。

Application Engine Traces
应用程序引擎跟踪
To set Application Engine traces:
要设置应用引擎跟踪:
- Start Configuration Manager, and select the Trace tab.
启动配置管理器,然后选择跟踪选项卡。
- Select the appropriate trace options.
选择适当的跟踪选项。
You can select any combination of options.
您可以选择选项的任意组合。
- Click either the Apply or OK button to set trace options.
单击“应用”或“确定”按钮以设置跟踪选项。
Temporary Table Data Trace
临时表数据跟踪
You can enable temporary table data tracing for diagnostics purposes. Use AE Trace Analyzer to analyze the temporary table trace file and generate diagnostic results.
To enable temporary table data tracing:
- Select the Trace tab in PeopleSoft Configuration Manager.
- Under Application Engine Trace, select Temp. Table Data.
- Click either the Apply or OK button.
Note: The temporary table data trace file size can be up to 1 GB to limit the memory usage. To support files exceeding 1 GB size, increase the JVM heap size.
附注:临时表数据跟踪文件的大小可以高达1 GB,以限制内存使用。若要支持超过1 GB大小的文件,请增加JVM堆大小。
Note: To map the Application Engine steps logged in the AET file with the corresponding temporary table data output in the temporary table data, you can time stamp the Application Engine step’s start as an index. Use this time stamp to view the temporary table data of the desired Application Engine step.
附注:要将AET文件中记录的Application Engine步骤与临时表数据中输出的相应临时表数据进行映射,可以将Application Engine步骤的开始时间戳作为索引。使用此时间戳可查看所需的应用程序引擎步骤的临时表数据。
The naming convention of AE trace file is AE_Program_name_Process_Instance_Date/ Time_Stamp.AET, for example, AE_AP_MATCH_142879_1126204755.AET, and corresponding temporary table data trace file is AE_Program_name_Process_Instance_Date/
Time_Stamp_temptable.DAT, for example, AE_AP_MATCH_142879_1126204755_temptable.DAT.
AE跟踪文件的命名约定为AE_Program_name_Process_Instance_Date/时间戳。以AET为例,自动匹配_142879_1126204755.AET,对应的临时表数据跟踪文件是AE_Program_name_Process_Instance_Date/Time_Stamp_temptable。DAT,例如,AE_AP_MATCH_142879_1126204755_诱人的数据
You can also enable the trace output of sections from PeopleSoft Configuration Manager. To enable the section trace output:
您还可以从PeopleSoft Configuration Manager启用节的跟踪输出。要启用节跟踪输出,请执行以下操作:
- Select the Trace tab in PeopleSoft Configuration Manager.
在PeopleSoft配置管理器中选择“跟踪”选项卡。
- Select the Enable Section Trace(g) check box.
选中启用截面跟踪(g)复选框。
Application Engine Trace File Size
应用程序引擎跟踪文件大小
The Application Engine Trace file size can get too large making it hard to open and read. You can define the maximum file size for the file in AE Trace File Size field. The default value of the Application Engine trace file size is 500 MB.
应用程序引擎跟踪文件的大小可能会变得太大,使其难以打开和读取。您可以在AE跟踪文件大小字段中定义文件的最大文件大小。应用程序引擎跟踪文件大小的默认值为500 MB。
The file size can vary between 500 MB to 1500 MB. If the current Application Engine trace file size exceeds the user defined value, file is closed and logging is switched to a new trace file.
文件大小可以在500 MB到1500 MB之间变化。如果当前应用程序引擎跟踪文件大小超过用户定义的值,则关闭该文件,并将日志记录切换到新的跟踪文件。
Enabling Selective Tracing
启用选择性跟踪
You can enable selective tracing for PeopleCode or SQL trace output.
可以为PeopleCode或SQL跟踪输出启用选择性跟踪。
You can select any section, step, or action of an Application Engine program for selective tracing.
您可以选择应用程序引擎程序的任何部分、步骤或操作以进行选择性跟踪。
To enable selective tracing in PIA, navigate to PeopleTools > Application Engine > Selective Tracing.
要在PIA中启用选择性跟踪,请导航到PeopleTools>应用程序引擎>选择性跟踪。
This example illustrates the fields and controls on the Selective Tracing page.

| Field | Description |
| Enable Selective Tracing | Enable or disable selective tracing. |
| Enrolled | Select this option to enroll an Application Engine program. Only Application Engine programs that have a MAIN section is listed. |
| Section | This is enabled only when an Application Engine program is selected for selective tracing. |
| Step | This is enabled when you select a section. The steps are displayed based on the section you select. |
| Statement Type | This is enabled when you select a step. The statement types can be PeopleCode or SQL. |
| PC Trace Value | The PeopleCode trace value is displayed, which is selected from the Selective Trace page. |
| SQL Trace Value | The SQL trace value is displayed, which is selected from the Selective Trace page. |
| Selective Trace Settings | Use this to select the different PeopleCode trace and SQL trace settings for each AE program that is enrolled to use selective tracing. Refer to the subsequent section on PeopleCode and SQL trace settings. |
PeopleCode and SQL Trace Settings
PeopleCode和SQL跟踪设置
You can select the PeopleCode trace and SQL trace settings from this page. The trace value appears at the bottom of this Selective Trace page.
您可以在此页面中选择PeopleCode跟踪和SQL跟踪设置。跟踪值显示在此选择性跟踪页的底部。
After the selecting the trace settings on this page, the trace values then appear on the PC Trace Value and SQL Trace Value fields on the Selective Tracing page.
在此页面上选择跟踪设置后,跟踪值将显示在“选择性跟踪”页面上的“PC跟踪值”和“SQL跟踪值”字段中。
The values depend on the traces that you select. The values cannot be manually edited.
这些值取决于您选择的跟踪。无法手动编辑这些值。
This example illustrates the fields and controls on the Selective Trace page.

Administrator Enabled Selective Tracing
已启用管理员选择性追踪
From Selective Tracing Admin page, an administrator can specify selective tracing configuration for an user or a set of users by using the Enrolled Users link.
在Selective Tracing Admin页面中,管理员可以使用Enrolled Users链接为一个用户或一组用户指定选择性跟踪配置。
Navigate to PeopleTools > Application Engine > Selective Tracing Admin.
导航到PeopleTools>应用程序引擎>选择性跟踪管理。
This example illustrates the fields and controls on the Selective Tracing Admin page.
 On this page, you can enroll the selected Application Engine program with the trace settings for an user or a set of users.
在此页上,可以使用一个用户或一组用户的跟踪设置注册选定的应用程序引擎程序。
Select the Enrolled Users link to open the Selective Tracing page.
选择“注册用户”链接以打开“选择性跟踪”页面。
This example illustrates the fields and controls on the Selective Tracing Admin page.
此示例说明了“选择性跟踪管理”页上的字段和控件。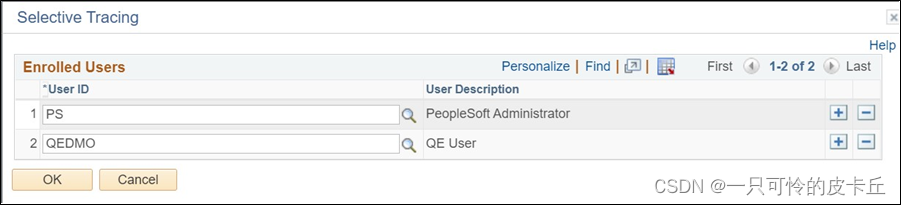
On this page, enroll an user or a set of users for whom you want to specify the selective tracing configuration.
在此页上,注册要为其指定选择性跟踪配置的一个或一组用户。
When administrator enables selective tracing for an user from the Selective Tracing Admin page, then on the Selective Tracing page (PeopleTools, Application Engine, Selective Tracing) of that user, the administrator-enabled selective tracing settings appear in display-only mode.
当管理员从“选择性跟踪管理”页为用户启用选择性跟踪时,在该用户的“选择性跟踪”页(PeopleTools、应用程序引擎、选择性跟踪)上,管理员启用的选择性跟踪设置将以仅显示模式显示。
Any trace setting done by the user on the Selective Tracing page will still be editable.
用户在“选择性跟踪”页上所做的任何跟踪设置仍将是可编辑的。
Note: The administrator's trace setting may override the user trace setting and the user trace setting will not be shown.
附注:管理员的跟踪设置可能会覆盖用户跟踪设置,并且不会显示用户跟踪设置。