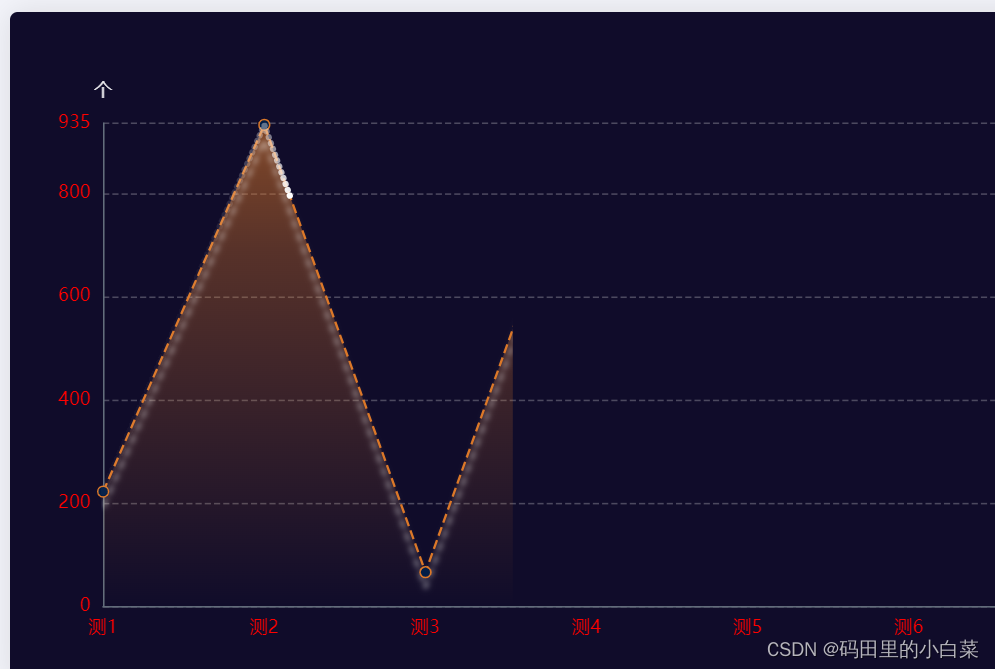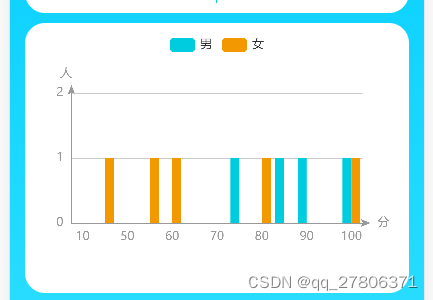
    function evaluationDistributionBar(data,id) {
		//data.series[0].data = [1,31,1,1]
		//data.series[1].data = [1,1,1,1]
		if(!data || data.series.length == 0) return
		for(let i in data.series){//给柱状图动态修改颜色
			if(data.series[i].name == '男'){
				data.series[i].itemStyle = {
					color : '#00ccdf'
				}
				data.series[i].barGap = '0%'//去掉双柱子中间的间距
			}else if(data.series[i].name == '女'){
				data.series[i].itemStyle = {
					color : '#f39801'//去掉双柱子中间的间距
				}
				data.series[i].barGap = '0%'
			}
		}
		let myChart = echarts.init(document.getElementById(id))
		var option = {
		    tooltip : {
		        trigger: 'axis'
		    },
		    title: { //y轴的写法 ************************************
			    text: '人',
			    left: '20',
			    top: '30',
			    textStyle:{
			    	color: '#999',
			    	fontSize: 12,
			    	fontWeight: 400
			   	}
			},
		    legend: {
		        data:data.legendData
		    },
		    xAxis : [
		        {
		            type : 'category',
		            data : data.xData,
		            axisTick: {
		                show: false //不显示刻度线
		            },
		            axisLine: {
	                    lineStyle: {
	                        color: '#999',
	                        width: 1, //这里是为了突出显示加上的
	                    },
	                    symbol: ['none', 'arrow'],    //只在末端显示箭头
	                    symbolSize: [6, 10],//原来是[8, 16]
	                    symbolOffset:[0, 8],//箭头段移动8个像素
	                },
	                name: '分', //x轴的写法 ************************************
	                nameLocation: 'end',//坐标位置,支持start,end
	                nameTextStyle: {
	                  fontSize: 12,
	                  color: '#999'
	                }
		        }
		    ],
		    yAxis : [
		        {
		            type : 'value',
		            minInterval: 1,//设置最小的刻度是1
		            boundaryGap: ['0', '10%'],//在Y轴的两端保留10%的空白间隔,使得柱状图不会与Y轴边界紧密相连。,
		            axisTick: {
		                show: false //不显示刻度线
		            },
		            axisLine: {
	                    lineStyle: {
	                        color: '#999',
	                        width: 1, //这里是为了突出显示加上的
	                    },
	                    symbol: ['none', 'arrow'],    //只在末端显示箭头
	                    symbolSize: [6, 10],//原来是[8, 16]
	                    symbolOffset:[0, 8],//箭头段移动8个像素
	                },
		        }
		    ],
		    series : data.series
		};

		myChart.setOption(option);
	}
看星星的位置


![CVE-2023-25573:MeterSphere 任意文件下载漏洞复现[附POC]](https://img-blog.csdnimg.cn/eb77a429cb2f41408403388560fb1b1b.png)
