1 【MATLAB】科研绘图第一期点线图
%% Made by Lwcah
%% 公众号:Lwcah
%% 知乎、B站、小红书、抖音同名账号:Lwcah,感谢关注~
%% 更多MATLAB+SCI绘图教程敬请观看~
%% 清除变量
clc; clear all; close all;
%% 一幅图的时候figureWidth = 8.5;figureHeight = 8;调整这两个参数就可以
%定义整幅图出现的在电脑屏幕上的位置以及长和宽
%这里有必要解释一下为什么figureWidth要设置为8.5;
%因详细解释需要很长的篇幅,请转公众号观看2023-03-21的文章观看。
figureUnits = 'centimeters';
figureWidth = 8.5;
figureHeight = 8;
set(gcf, 'Units', figureUnits, 'Position', [0 0 figureWidth figureHeight]);
%% 定义字体和字号大小
%% 通常的SCI一般Arial字体和10字号通用
fontnamed='Arial';%字号名字
ssize=10;%字号大小
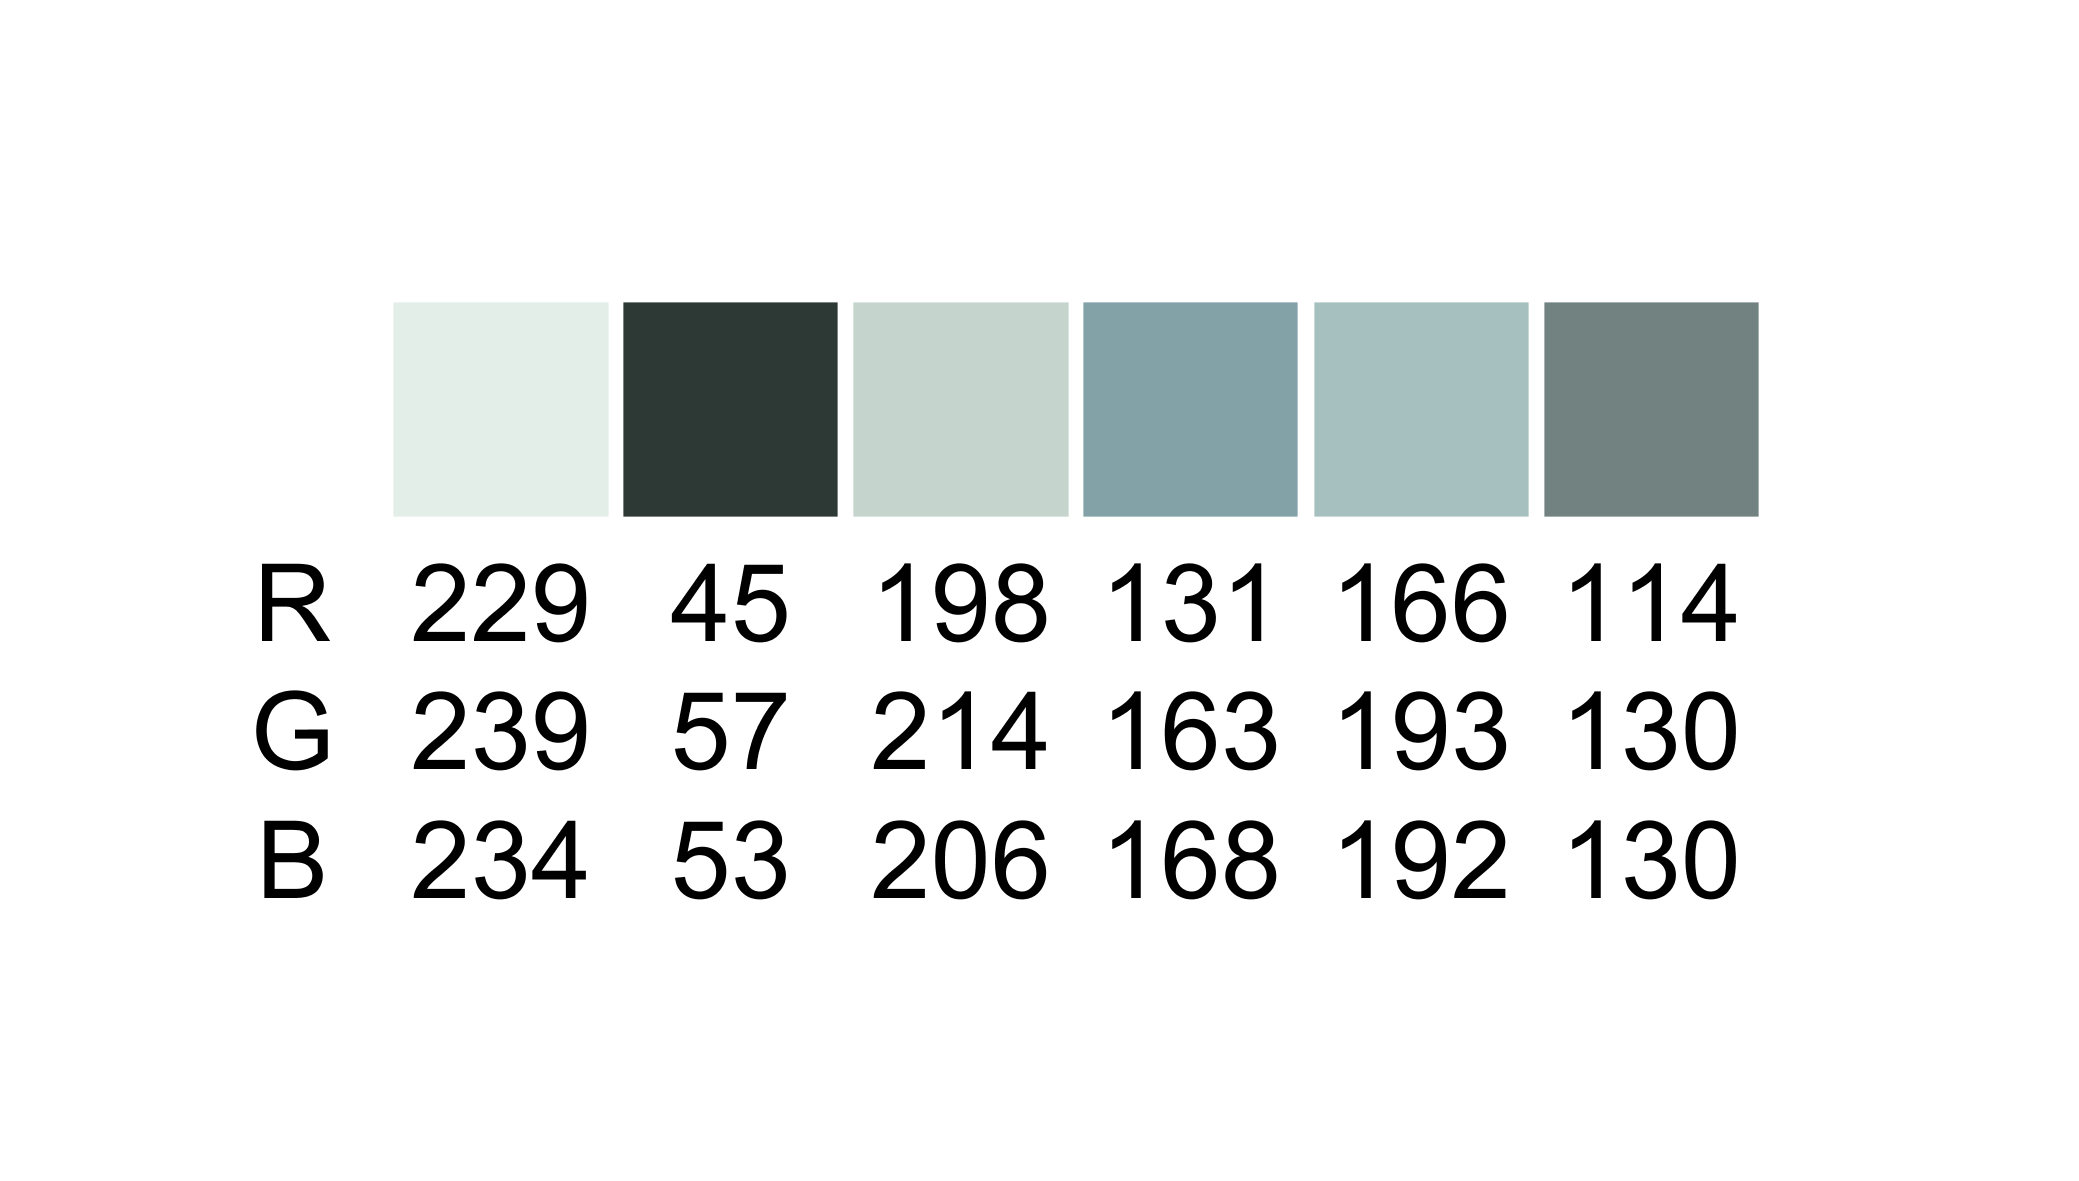
%% 定义颜色
load picture20%加载第一张图的颜色
C1=Color(1,:)./256;
C2=Color(2,:)./256;
C3=Color(3,:)./256;
C4=Color(4,:)./256;
C5=Color(5,:)./256;
C6=Color(6,:)./256;
%% 开始绘图
x=[1;2;3;4;5;6];
y1=[1;1;1;1;1;1];
y2=[2;2;2;2;2;2];
y3=[3;3;3;3;3;3];
y4=[4;4;4;4;4;4];
y5=[5;5;5;5;5;5];
y6=[6;6;6;6;6;6];
%% 绘制散点连线图
h1 = line (x,y1,'LineStyle','--','Marker','o','LineWidth',1,'Color',C1, 'MarkerEdgeColor',C1,'MarkerFaceColor',C1);hold on;
h2 = line (x,y2,'LineStyle','--','Marker','o','LineWidth',1,'Color',C1, 'MarkerEdgeColor',C2,'MarkerFaceColor',C2);hold on;
h3 = line (x,y3,'LineStyle','--','Marker','o','LineWidth',1,'Color',C1, 'MarkerEdgeColor',C3,'MarkerFaceColor',C3);hold on;
h4 = line (x,y4,'LineStyle','--','Marker','o','LineWidth',1,'Color',C2, 'MarkerEdgeColor',C4,'MarkerFaceColor',C4);hold on;
h5 = line (x,y5,'LineStyle','--','Marker','o','LineWidth',1,'Color',C2, 'MarkerEdgeColor',C5,'MarkerFaceColor',C5);hold on;
h6 = line (x,y6,'LineStyle','--','Marker','o','LineWidth',1,'Color',C2, 'MarkerEdgeColor',C6,'MarkerFaceColor',C6);hold on;
%% 画图的标准格式代码
% text(0.7,-0.10,'(b) Honor','fontsize',ssize,'FontName',fontnamed);%,'horiz','center'
% text(0.6,-0.20,str_equation,'fontsize',ssize,'FontName',fontnamed,'color',C2);
xlabel('X (m)','fontsize',ssize,'FontName',fontnamed);
ylabel('Y (m)','fontsize',ssize,'FontName',fontnamed);
axis([0 7 0 8]);
xticks([0 1 2 3 4 5 6 7]);%画格网的时候的小刻度
xticklabels({'0','1','2','3','4','5','6','7'});%加x轴刻度标注
yticks([0 1 2 3 4 5 6 7 8]);%画格网的时候的小刻度
yticklabels({'0','1','2','3','4','5','6','7','8'});%加y轴刻度标注
set(gca,'linewidth',1,'fontsize',ssize,'FontName',fontnamed);
% set(gca,'yticklabel',[]);%y轴不显示
% set(gca,'xticklabel',[]);%x轴不显示
grid on;box on;hold on;
%% 画legend
%位置可置换 North South East West NorthEast NorthWest SouthEast SouthWest
%方法一
% kk=legend([h1,h2,h3],'0-90','270-360','Fusion');%robust\_median
% set(kk,'location','NorthEast','orientation','horizontal','Box', 'off','fontsize',ssize,'FontName',fontnamed);%,'Orientation','horizontal'
%方法二
columnlegend(3,{'h1','h2','h3','h4','h5','h6'},'North');%表示一行放三个图例以及图例的位置
%% 背景颜色
set(gcf,'Color',[1 1 1])
%% 图片输出
figW = figureWidth;
figH = figureHeight;
set(figureHandle,'PaperUnits',figureUnits);
set(figureHandle,'PaperPosition',[0 0 figW figH]);
fileout = 'demo_plot20';
print(figureHandle,[fileout,'.png'],'-r600','-dpng');

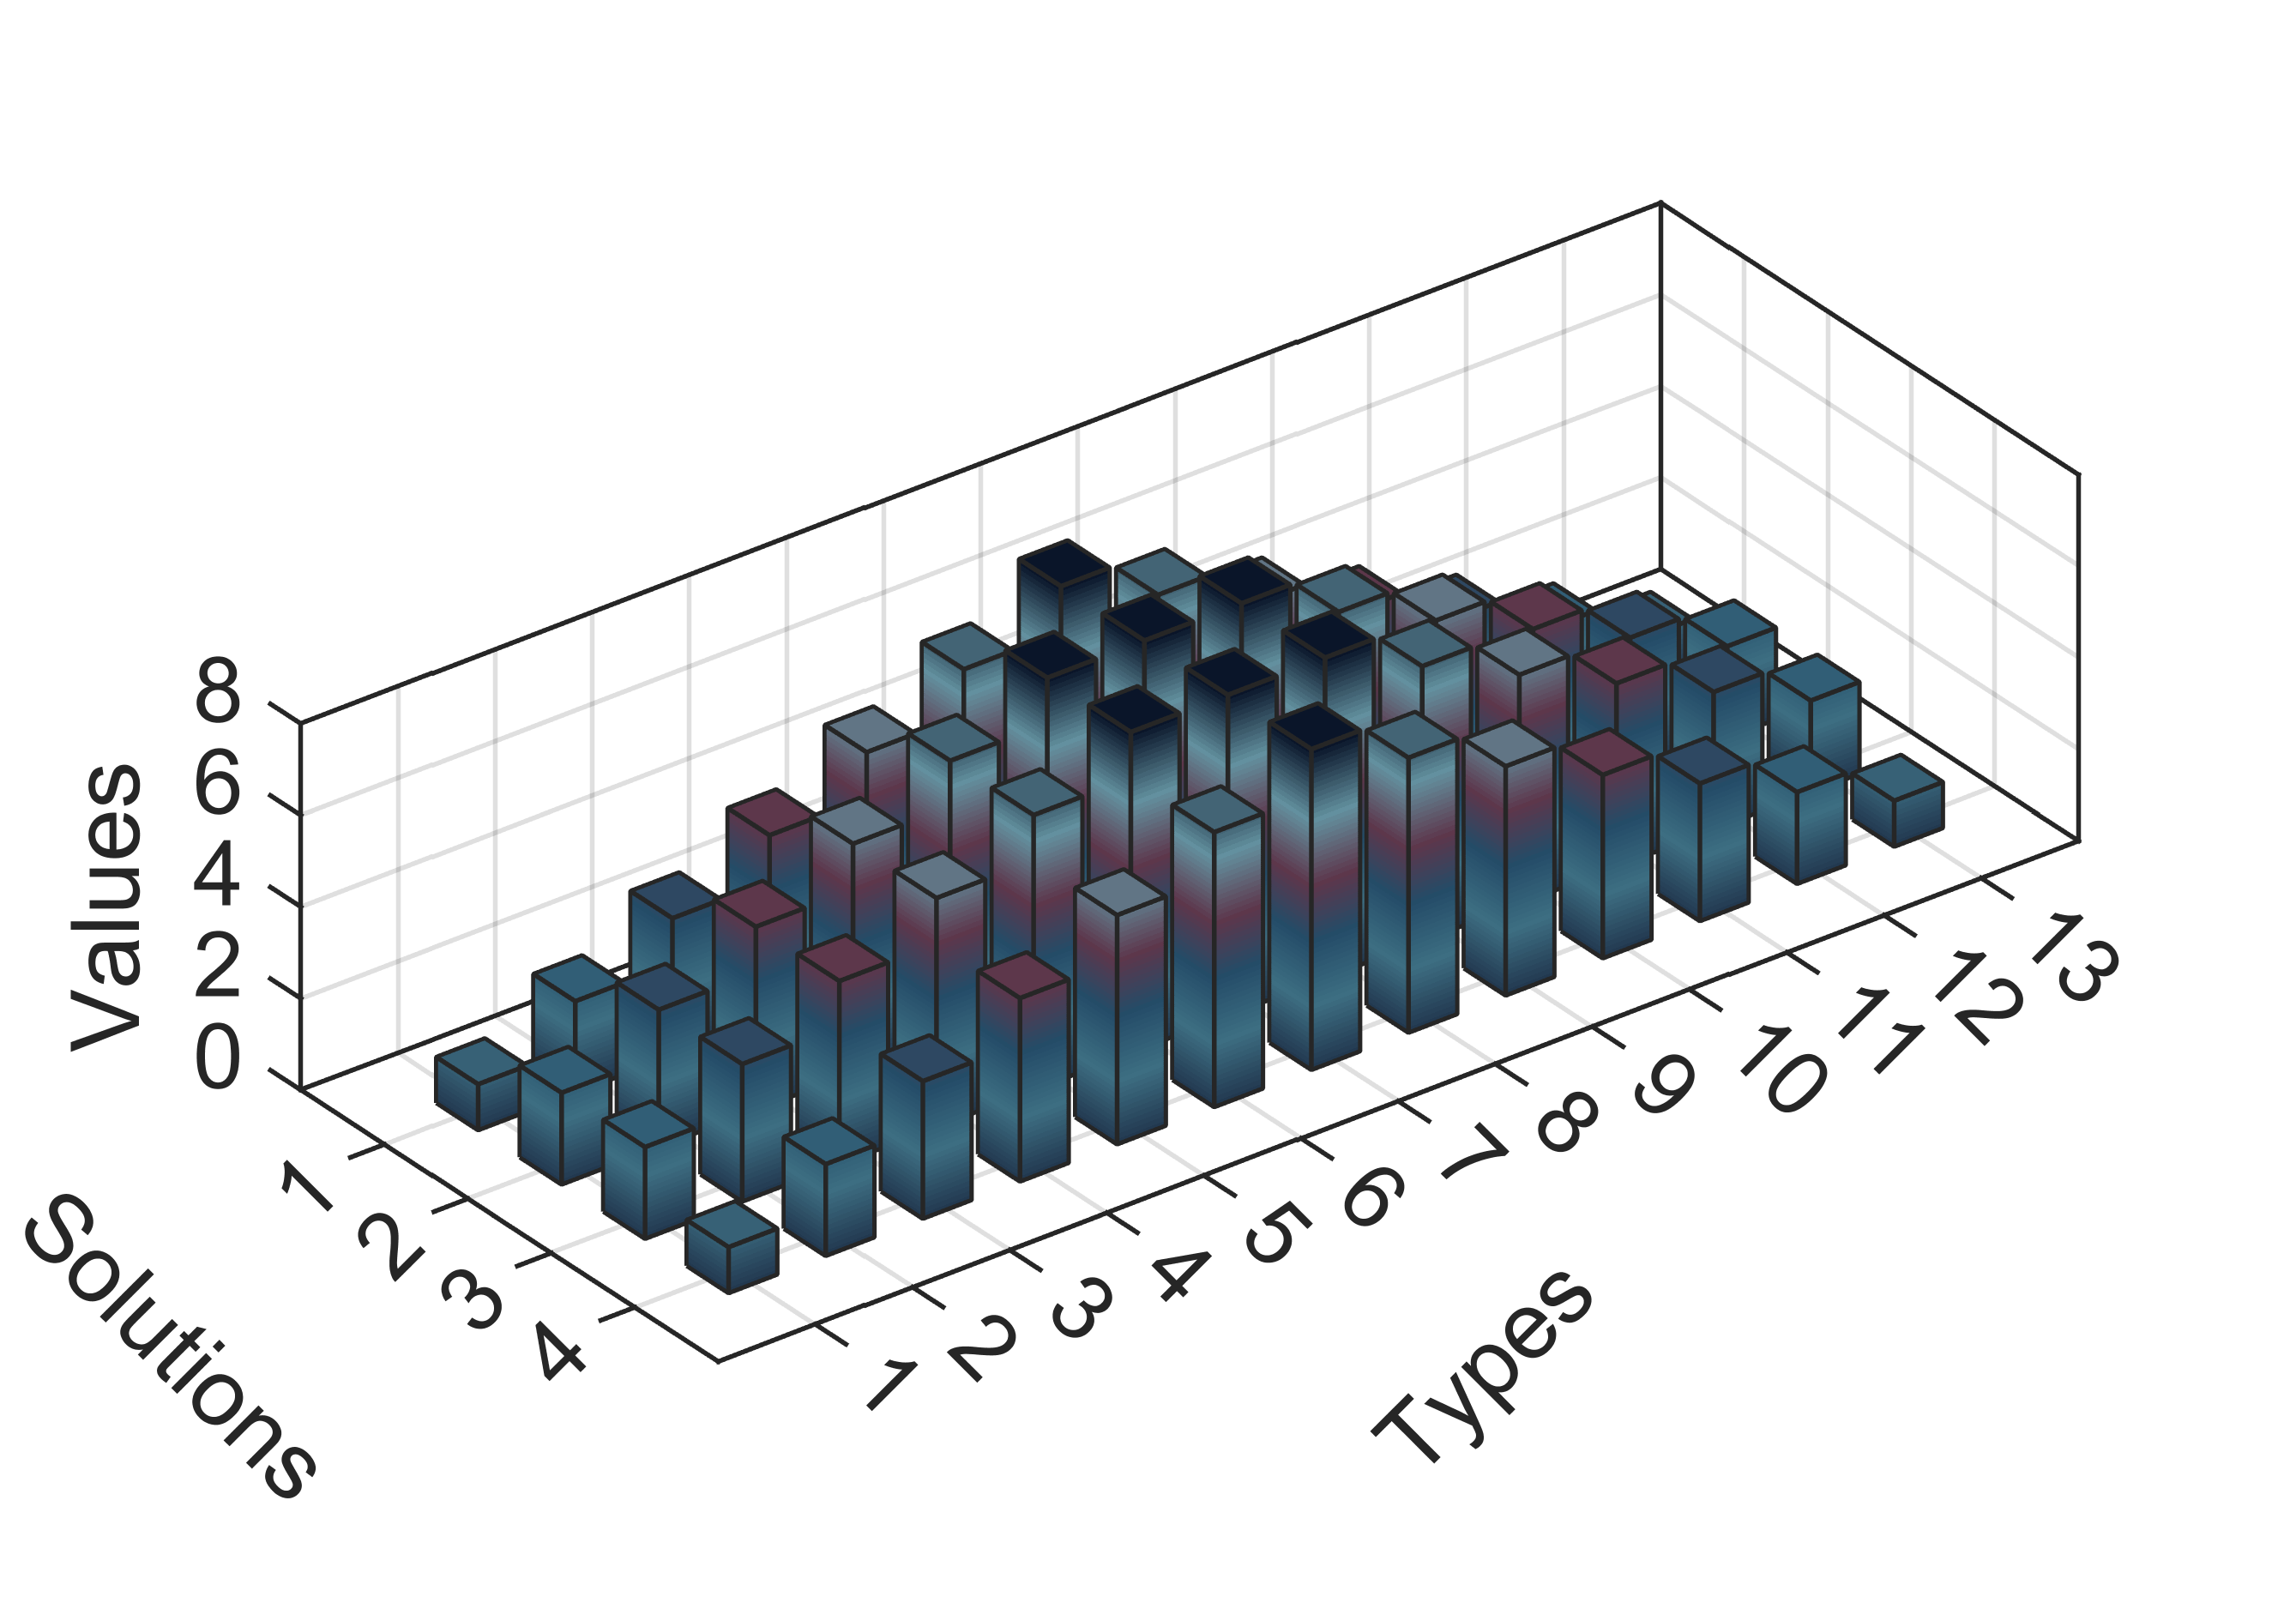
2 【MATLAB】科研绘图第二期三维柱状图
%% Made by Lwcah(公众号:Lwcah)
%% 公众号:Lwcah
%% 知乎、B站、小红书、抖音同名账号:Lwcah,感谢关注~
%% 更多MATLAB+SCI绘图教程敬请观看~

%% 三维柱状图的绘制模板
close all;clear all;clc;

%% 1行1列
%% 一幅图的时候figureWidth = 8.5;figureHeight = 8;调整这两个参数就可以
%定义整幅图出现的在电脑屏幕上的位置以及长和宽
%这里有必要解释一下为什么figureWidth要设置为8.5;
%因详细解释需要很长的篇幅,请转公众号观看2023-03-23的文章观看。
figureHandle = figure;
figureUnits = 'centimeters';
figureWidth = 8.5;
figureHeight = 6;
set(gcf, 'Units', figureUnits, 'Position', [0 0 figureWidth figureHeight]);

%% 数据准备
% 定义自变量
X = [1 2 3 4 5 6 7 8 9 10 11 12 13];%13
Y = [1 2 3 4];%4
% 定义因变量
Z1 = [1 2 3 4 5 6 7 6 5 4 3 2 1];
Z2 = [2 3 4 5 6 7 7 7 6 5 4 3 2];
Z3 = [2 3 4 5 6 7 7 7 6 5 4 3 2];
Z4 = [1 2 3 4 5 6 7 6 5 4 3 2 1];
Z=[Z1;Z2;Z3;Z4];%4x13

%% 定义字体和字号大小
%% 通常的SCI一般Arial字体和10字号通用
fontnamed='Arial';%字号名字
ssize=10;%字号大小

%% 给定绘图渐变色
load map10%更换map1到map10替换颜色
CM1 = map;

%% 定义绘图参数
b = bar3(Z,0.5);
% hTitle = title(sprintf('(a) RMSE/m (free snow)'));
hXLabel = xlabel('Types','fontsize',ssize,'FontName',fontnamed,'rotation',45);
hYLabel = ylabel('Solutions','fontsize',ssize,'FontName',fontnamed,'rotation',-45);
hZLabel = zlabel('Values','fontsize',ssize,'FontName',fontnamed);

%% 按照Z轴赋色
for k = 1:length(b)
    zdata = b(k).ZData;
    b(k).CData = zdata;
    b(k).FaceColor = 'interp';
end
colormap(CM1);%使用自定义的颜色
cb = colorbar;%添加垂直颜色栏
set(cb,'unit','centimeters','position',[9.3,2.8,0.2,2.5]);%设置垂直颜色栏的位置及大小


%% 画图的标准格式代码
% text(0.5,0.9,'(a) snow','fontsize',ssize,'FontName',fontnamed);%,'horiz','center'
% xlabel('SNR types','fontsize',ssize,'FontName',fontnamed);
% ylabel('R (with snow)','fontsize',ssize,'FontName',fontnamed);
axis([0 14 0 5 0 8]);%XYZ轴的范围
xticks([1 2 3 4 5 6 7 8 9 10 11 12 13]);%画格网的时候的小刻度
xticklabels({'1','2','3','4','5','6','7','8','9','10','11','12','13'});%加x轴刻度标注,'C3-MEO-S2I','C3-MEO-S6I'
yticks([1 2 3 4]);%画格网的时候的小刻度
yticklabels({'1','2','3','4'});%加x轴刻度标注
zticks([0 2 4 6 8]);%画格网的时候的小刻度
zticklabels({'0','2','4','6','8'});%加x轴刻度标注
set(gca,'xticklabelrotation',-45);
set(gca,'yticklabelrotation',45);
% set(gca,'linewidth',1,'fontsize',ssize,'FontName',fontnamed);
% set(gca,'yticklabel',[]);%y轴不显示
% set(gca,'xticklabel',[]);%x轴不显示
grid on;box on;hold on;

%% 背景颜色
set(gcf,'Color',[1 1 1])
%% 设置完毕后,按照所需分辨率、格式输出
figW = figureWidth;
figH = figureHeight;
set(figureHandle,'PaperUnits',figureUnits);
set(figureHandle,'PaperPosition',[0 0 figW figH]);
fileout = 'bar10';
print(figureHandle,[fileout,'.png'],'-r800','-dpng');

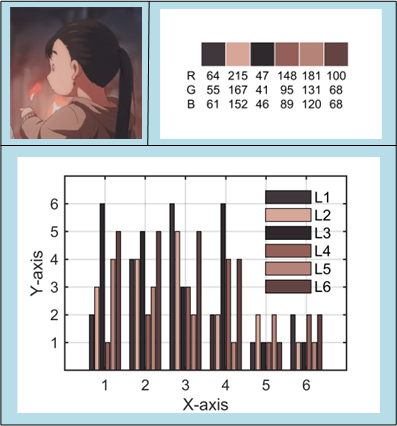
3 【MATLAB】科研绘图第三期二维柱状图
%% Made by Lwcah in 2023-03-25(公众号:Lwcah)
%% 公众号:Lwcah
%% 知乎、B站、小红书、抖音同名账号:Lwcah,感谢关注~
%% 更多MATLAB+SCI绘图教程敬请观看~

%% 二维柱状图的绘制模板
close all;clear all;clc;

%% 1行1列
%% 一幅图的时候figureWidth = 8.5;figureHeight = 8;调整这两个参数就可以
%定义整幅图出现的在电脑屏幕上的位置以及长和宽
%这里有必要解释一下为什么figureWidth要设置为8.5;
%因详细解释需要很长的篇幅,请转公众号观看2023-03-23的文章观看。
figureHandle = figure;
figureUnits = 'centimeters';
figureWidth = 8.5;
figureHeight = 6;
set(gcf, 'Units', figureUnits, 'Position', [0 0 figureWidth figureHeight]);

%% 定义字体和字号大小
%% 通常的SCI一般Arial字体和10字号通用
fontnamed='Arial';%字号名字
ssize=10;%字号大小
%% 如果是中文论文可以相应的更改字号名字如下
% '华文中宋' '华文仿宋' '华文宋体' '华文新魏' '华文楷体'
% '华文琥珀' '华文细黑' '华文行楷' '华文隶书' '宋体'
% '方正姚体' '微软雅黑' '方正舒体' '新宋体'
% '幼圆' '楷体' '等线' '隶书' '黑体'

%% 给定绘图颜色
load 61.mat
C1=Color(1,:)./256;
C2=Color(2,:)./256;
C3=Color(3,:)./256;
C4=Color(4,:)./256;
C5=Color(5,:)./256;
C6=Color(6,:)./256;

%% 数据准备
X = [1 2 3 4 5 6]';
Y1 = [2 4 6 2 1 2]';
Y2 = [3 4 5 2 2 1]';
Y3 = [6 5 3 6 1 1]';
Y4 = [1 2 3 4 1 2]';
Y5 = [4 3 2 1 2 1]';
Y6 = [5 5 5 4 1 2]';
Y=[Y1,Y2,Y3,Y4,Y5,Y6];

%% 绘图
h = bar(Y,'FaceColor','flat');hold on;
% 赋值颜色
for k = 1:size(Y,2)
    h(k).CData = Color(k,:)./256;
end

%% 画图的标准格式代码
% text(0.5,0.9,'(a) XXX','fontsize',ssize,'FontName',fontnamed);%,'horiz','center'
xlabel('X-axis','fontsize',ssize,'FontName',fontnamed);
ylabel('Y-axis','fontsize',ssize,'FontName',fontnamed);
axis([0 7 0 7]);%XY轴的范围
xticks([1 2 3 4 5 6]);%画格网的时候的小刻度
xticklabels({'1','2','3','4','5','6'});%加x轴刻度标注
yticks([1 2 3 4 5 6]);%画格网的时候的小刻度
yticklabels({'1','2','3','4','5','6'});%加y轴刻度标注
set(gca,'linewidth',1,'fontsize',ssize,'FontName',fontnamed);
% set(gca,'yticklabel',[]);%y轴不显示
% set(gca,'xticklabel',[]);%x轴不显示
grid on;box on;hold on;

%% 画legend
%方法一
kk=legend('L1','L2','L3','L4','L5','L6');
set(kk,'location','NorthOutside','Box', 'off','fontsize',ssize,'FontName',fontnamed);%'orientation','horizontal',
kk.NumColumns=length(h);   % 设置图例横向排列
kk.ItemTokenSize=[8,8];    % 设置图例方形大小

%方法二
% columnlegend(2,{'L1','L2','L3','L4','L5','L6'},'North');%表示一行放三个图例以及图例的位置
%% Matlab中有许多位置可以选择:
% 'North' inside plot box near top
% 'South' inside bottom
% 'East' inside right
% 'West' inside left
% 'NorthEast' inside top right (default for 2-D plots)
% 'NorthWest' inside top left
% 'SouthEast' inside bottom right
% 'SouthWest' inside bottom left
% 'NorthOutside' outside plot box near top
% 'SouthOutside' outside bottom
% 'EastOutside' outside right
% 'WestOutside' outside left
% 'NorthEastOutside' outside top right (default for 3-D plots)
% 'NorthWestOutside' outside top left
% 'SouthEastOutside' outside bottom right
% 'SouthWestOutside' outside bottom left
% 'Best' least conflict with data in plot 与绘图中的数据冲突最小
% 'BestOutside' least unused space outside plot

%% 背景颜色
set(gcf,'Color',[1 1 1])
%% 设置完毕后,按照所需分辨率、格式输出
figW = figureWidth;
figH = figureHeight;
set(figureHandle,'PaperUnits',figureUnits);
set(figureHandle,'PaperPosition',[0 0 figW figH]);
fileout = '63';
print(figureHandle,[fileout,'.png'],'-r600','-dpng');
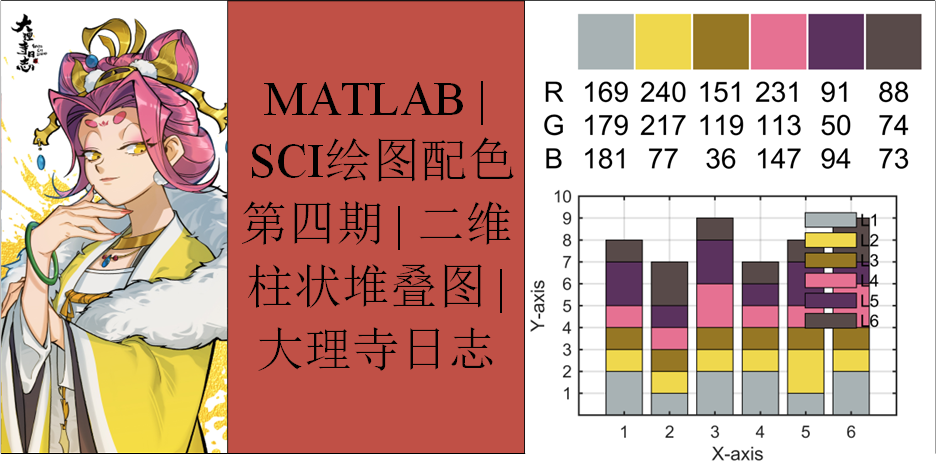
4 【MATLAB】科研绘图第四期二维堆叠柱状图
%% Made by Lwcah(公众号:Lwcah)
%% 公众号:Lwcah
%% 知乎、B站、小红书、抖音同名账号:Lwcah,感谢关注~
%% 更多MATLAB+SCI绘图教程敬请观看~

%% 二维柱状图的绘制模板
close all;clear all;clc;

%% 1行1列
%% 一幅图的时候figureWidth = 8.5;figureHeight = 8;调整这两个参数就可以
%定义整幅图出现的在电脑屏幕上的位置以及长和宽
%这里有必要解释一下为什么figureWidth要设置为8.5;
%因详细解释需要很长的篇幅,请转公众号观看2023-03-27的文章观看。
figureHandle = figure;
figureUnits = 'centimeters';
figureWidth = 8.5;
figureHeight = 6;
set(gcf, 'Units', figureUnits, 'Position', [0 0 figureWidth figureHeight]);

%% 定义字体和字号大小
%% 通常的SCI一般Arial字体和10字号通用
fontnamed='Arial';%字号名字
ssize=10;%字号大小
%% 如果是中文论文可以相应的更改字号名字如下
% '华文中宋' '华文仿宋' '华文宋体' '华文新魏' '华文楷体'
% '华文琥珀' '华文细黑' '华文行楷' '华文隶书' '宋体'
% '方正姚体' '微软雅黑' '方正舒体' '新宋体'
% '幼圆' '楷体' '等线' '隶书' '黑体'

%% 给定绘图颜色
load 11.mat
C1=Color(1,:);
C2=Color(2,:);
C3=Color(3,:);
C4=Color(4,:);
C5=Color(5,:);
C6=Color(6,:);

%% 数据准备
X = [1 2 3 4 5 6]';
Y1 = [2 1 2 2 1 2]';
Y2 = [1 1 1 1 2 1]';
Y3 = [1 1 1 1 1 1]';
Y4 = [1 1 2 1 1 2]';
Y5 = [2 1 2 1 2 1]';
Y6 = [1 2 1 1 1 2]';
Y=[Y1,Y2,Y3,Y4,Y5,Y6];

%% 绘图
h = bar(Y,'stacked','FaceColor','flat');hold on;
% 赋值颜色
for k = 1:size(Y,2)
    h(k).CData = Color(k,:)./256;
end

%% 画图的标准格式代码
% text(0.5,0.9,'(a) XXX','fontsize',ssize,'FontName',fontnamed);%,'horiz','center'
xlabel('X-axis','fontsize',ssize,'FontName',fontnamed);
ylabel('Y-axis','fontsize',ssize,'FontName',fontnamed);
axis([0 7 0 10]);%XY轴的范围
xticks([1 2 3 4 5 6]);%画格网的时候的小刻度
xticklabels({'1','2','3','4','5','6'});%加x轴刻度标注
yticks([1 2 3 4 5 6 7 8 9 10]);%画格网的时候的小刻度
yticklabels({'1','2','3','4','5','6','7','8','9','10'});%加y轴刻度标注
set(gca,'linewidth',1,'fontsize',ssize,'FontName',fontnamed);
% set(gca,'yticklabel',[]);%y轴不显示
% set(gca,'xticklabel',[]);%x轴不显示
grid on;box on;hold on;

%% 画legend
%方法一
kk=legend('L1','L2','L3','L4','L5','L6');
set(kk,'location','NorthEast','Box', 'off','fontsize',ssize,'FontName',fontnamed);%'orientation','horizontal',
%方法二
% columnlegend(2,{'L1','L2','L3','L4','L5','L6'},'North');%表示一行放三个图例以及图例的位置
%% Matlab中有许多位置可以选择:
% 'North' inside plot box near top
% 'South' inside bottom
% 'East' inside right
% 'West' inside left
% 'NorthEast' inside top right (default for 2-D plots)
% 'NorthWest' inside top left
% 'SouthEast' inside bottom right
% 'SouthWest' inside bottom left
% 'NorthOutside' outside plot box near top
% 'SouthOutside' outside bottom
% 'EastOutside' outside right
% 'WestOutside' outside left
% 'NorthEastOutside' outside top right (default for 3-D plots)
% 'NorthWestOutside' outside top left
% 'SouthEastOutside' outside bottom right
% 'SouthWestOutside' outside bottom left
% 'Best' least conflict with data in plot 与绘图中的数据冲突最小
% 'BestOutside' least unused space outside plot

%% 背景颜色
set(gcf,'Color',[1 1 1])
%% 设置完毕后,按照所需分辨率、格式输出
figW = figureWidth;
figH = figureHeight;
set(figureHandle,'PaperUnits',figureUnits);
set(figureHandle,'PaperPosition',[0 0 figW figH]);
fileout = '13';
print(figureHandle,[fileout,'.png'],'-r600','-dpng');
5 【MATLAB】科研绘图第五期二维横轴柱状图
%% Made by Lwcah(公众号:Lwcah)
%% 公众号:Lwcah
%% 知乎、B站、小红书、抖音同名账号:Lwcah,感谢关注~
%% 更多MATLAB+SCI绘图教程敬请观看~

%% 二维柱状图的绘制模板
close all;clear all;clc;

%% 1行1列
%% 一幅图的时候figureWidth = 8.5;figureHeight = 8;调整这两个参数就可以
%定义整幅图出现的在电脑屏幕上的位置以及长和宽
%这里有必要解释一下为什么figureWidth要设置为8.5;
%因详细解释需要很长的篇幅,请转公众号观看该天的文章。
figureHandle = figure;
figureUnits = 'centimeters';
figureWidth = 8.5;
figureHeight = 6;
set(gcf, 'Units', figureUnits, 'Position', [0 0 figureWidth figureHeight]);

%% 定义字体和字号大小
%% 通常的SCI一般Arial字体和10字号通用
fontnamed='Arial';%字号名字
ssize=10;%字号大小
%% 如果是中文论文可以相应的更改字号名字如下
% '华文中宋' '华文仿宋' '华文宋体' '华文新魏' '华文楷体'
% '华文琥珀' '华文细黑' '华文行楷' '华文隶书' '宋体'
% '方正姚体' '微软雅黑' '方正舒体' '新宋体'
% '幼圆' '楷体' '等线' '隶书' '黑体'

%% 给定绘图颜色
load 11.mat
C1=Color(1,:);
C2=Color(2,:);
C3=Color(3,:);
C4=Color(4,:);
C5=Color(5,:);
C6=Color(6,:);

%% 数据准备
X = [1 2 3 4 5 6]';
Y1 = [2 4 6 2 1 2]';
Y2 = [3 4 5 2 2 1]';
Y3 = [6 5 3 6 1 1]';
Y4 = [1 2 3 4 1 2]';
Y5 = [4 3 2 1 2 1]';
Y6 = [5 5 5 4 1 2]';
Y=[Y1,Y2,Y3,Y4,Y5,Y6];

%% 绘图
h = barh(Y,'FaceColor','flat');hold on;%'stacked',
% 赋值颜色
for k = 1:size(Y,2)
    h(k).CData = Color(k,:)./256;
end

%% 画图的标准格式代码
% text(0.5,0.9,'(a) XXX','fontsize',ssize,'FontName',fontnamed);%,'horiz','center'
xlabel('X-axis','fontsize',ssize,'FontName',fontnamed);
ylabel('Y-axis','fontsize',ssize,'FontName',fontnamed);
axis([0 7 0 7]);%XY轴的范围
xticks([1 2 3 4 5 6]);%画格网的时候的小刻度
xticklabels({'1','2','3','4','5','6'});%加x轴刻度标注
yticks([1 2 3 4 5 6]);%画格网的时候的小刻度
yticklabels({'1','2','3','4','5','6'});%加y轴刻度标注
set(gca,'linewidth',1,'fontsize',ssize,'FontName',fontnamed);
% set(gca,'yticklabel',[]);%y轴不显示
% set(gca,'xticklabel',[]);%x轴不显示
grid on;box on;hold on;

%% 画legend
%方法一
kk=legend('L1','L2','L3','L4','L5','L6');
set(kk,'location','NorthEast','Box', 'off','fontsize',ssize,'FontName',fontnamed);%'orientation','horizontal',
%方法二
% columnlegend(2,{'L1','L2','L3','L4','L5','L6'},'North');%表示一行放三个图例以及图例的位置
%% Matlab中有许多位置可以选择:
% 'North' inside plot box near top
% 'South' inside bottom
% 'East' inside right
% 'West' inside left
% 'NorthEast' inside top right (default for 2-D plots)
% 'NorthWest' inside top left
% 'SouthEast' inside bottom right
% 'SouthWest' inside bottom left
% 'NorthOutside' outside plot box near top
% 'SouthOutside' outside bottom
% 'EastOutside' outside right
% 'WestOutside' outside left
% 'NorthEastOutside' outside top right (default for 3-D plots)
% 'NorthWestOutside' outside top left
% 'SouthEastOutside' outside bottom right
% 'SouthWestOutside' outside bottom left
% 'Best' least conflict with data in plot 与绘图中的数据冲突最小
% 'BestOutside' least unused space outside plot

%% 背景颜色
set(gcf,'Color',[1 1 1])
%% 设置完毕后,按照所需分辨率、格式输出
figW = figureWidth;
figH = figureHeight;
set(figureHandle,'PaperUnits',figureUnits);
set(figureHandle,'PaperPosition',[0 0 figW figH]);
fileout = '13';
print(figureHandle,[fileout,'.png'],'-r600','-dpng');

6 【MATLAB】科研绘图第六期三维折线图
%% Made by Lwcah(公众号:Lwcah)
%% 公众号:Lwcah
%% 知乎、B站、小红书、抖音同名账号:Lwcah,感谢关注~
%% 更多MATLAB+SCI绘图教程敬请观看~

%% 绘制模板
close all;clear all;clc;

%% 1行1列
%% 一幅图的时候figureWidth = 8.5;figureHeight = 8;调整这两个参数就可以
%定义整幅图出现的在电脑屏幕上的位置以及长和宽
%这里有必要解释一下为什么figureWidth要设置为8.5;
%因详细解释需要很长的篇幅,请转公众号观看该天的文章。
figureHandle = figure;
figureUnits = 'centimeters';
figureWidth = 8.5;
figureHeight = 6;
set(gcf, 'Units', figureUnits, 'Position', [28 20 figureWidth figureHeight]);
% 注:28代表出图时图的左下角相对于整个电脑屏幕的左下角向左偏移28个单位,向上偏移20个单位。
% 可自行调节两个数字让图出在自己屏幕的某个位置

%% 定义字体和字号大小
%% 通常的SCI一般Arial字体和10字号通用
fontnamed='Arial';%字号名字
ssize=10;%字号大小
%% 如果是中文论文可以相应的更改字号名字如下
% '华文中宋' '华文仿宋' '华文宋体' '华文新魏' '华文楷体'
% '华文琥珀' '华文细黑' '华文行楷' '华文隶书' '宋体'
% '方正姚体' '微软雅黑' '方正舒体' '新宋体'
% '幼圆' '楷体' '等线' '隶书' '黑体'

%% 数据准备
% X定义第几行的数据,Y定义的数据要按升序排列
X = [1 1 1 1 1 1
    2 2 2 2 2 2
    3 3 3 3 3 3
    4 4 4 4 4 4
    5 5 5 5 5 5
    6 6 6 6 6 6]';
Y = [0.1 0.2 0.3 0.4 0.5 0.6
    0.1 0.2 0.3 0.4 0.5 0.6
    0.1 0.2 0.3 0.4 0.5 0.6
    0.1 0.2 0.3 0.4 0.5 0.6
    0.1 0.2 0.3 0.4 0.5 0.6
    0.1 0.2 0.3 0.4 0.5 0.6]';
Z = [100 200 100 100 100 100
    100 200 100 100 100 100
    100 100 200 100 100 100
    100 100 100 200 100 100
    100 100 100 100 200 100
    100 100 100 100 200 100]';

%% 绘图
plot3(X,Y,Z,'linewidth',1);
hTitle = title('Three-dimensional line chart');
hXLabel = xlabel('X');
hYLabel = ylabel('Y');
hZLabel = zlabel('Z');

%% 画图的标准格式代码
% text(0.5,0.9,'(a) XXX','fontsize',ssize,'FontName',fontnamed);%,'horiz','center'
xlabel('X-axis','fontsize',ssize,'FontName',fontnamed);
ylabel('Y-axis','fontsize',ssize,'FontName',fontnamed);
zlabel('Z-axis','fontsize',ssize,'FontName',fontnamed);
axis([0 7 0 0.7 50 250]);%XYZ轴的范围
xticks([1 2 3 4 5 6]);%画格网的时候的小刻度
xticklabels({'1','2','3','4','5','6'});%加x轴刻度标注
yticks([0.1 0.2 0.3 0.4 0.5 0.6]);%画格网的时候的小刻度
yticklabels({'0.1','0.2','0.3','0.4','0.5','0.6'});%加y轴刻度标注
zticks([50 100 150 200 250]);%画格网的时候的小刻度
zticklabels({'50','100','150','200','250'});%加z轴刻度标注
set(gca,'linewidth',1,'fontsize',ssize,'FontName',fontnamed);
% set(gca,'zticklabel',[]);%z轴不显示
% set(gca,'yticklabel',[]);%y轴不显示
% set(gca,'xticklabel',[]);%x轴不显示
grid on;box on;hold on;

%% 画legend
%方法一
kk=legend('L1','L2','L3','L4','L5','L6');
set(kk,'location','NorthEast','Box', 'off','fontsize',ssize,'FontName',fontnamed);%'orientation','horizontal',
%方法二
% columnlegend(2,{'L1','L2','L3','L4','L5','L6'},'North');%表示一行放三个图例以及图例的位置
%% Matlab中有许多位置可以选择:
% 'North' inside plot box near top
% 'South' inside bottom
% 'East' inside right
% 'West' inside left
% 'NorthEast' inside top right (default for 2-D plots)
% 'NorthWest' inside top left
% 'SouthEast' inside bottom right
% 'SouthWest' inside bottom left
% 'NorthOutside' outside plot box near top
% 'SouthOutside' outside bottom
% 'EastOutside' outside right
% 'WestOutside' outside left
% 'NorthEastOutside' outside top right (default for 3-D plots)
% 'NorthWestOutside' outside top left
% 'SouthEastOutside' outside bottom right
% 'SouthWestOutside' outside bottom left
% 'Best' least conflict with data in plot 与绘图中的数据冲突最小
% 'BestOutside' least unused space outside plot

%% 背景颜色
set(gcf,'Color',[1 1 1])
%% 设置完毕后,按照所需分辨率、格式输出
figW = figureWidth;
figH = figureHeight;
set(figureHandle,'PaperUnits',figureUnits);
set(figureHandle,'PaperPosition',[0 0 figW figH]);
fileout = '三维折线图';
print(figureHandle,[fileout,'.png'],'-r600','-dpng');

7 【MATLAB】科研绘图第七期二维横轴堆叠柱状图
%% Made by Lwcah(公众号:Lwcah)
%% 公众号:Lwcah
%% 知乎、B站、小红书、抖音同名账号:Lwcah,感谢关注~
%% 更多MATLAB+SCI绘图教程敬请观看~

%% 清除变量
close all;clear all;clc;

%% 1行1列
%% 一幅图的时候figureWidth = 8.5;figureHeight = 8;调整这两个参数就可以
%定义整幅图出现的在电脑屏幕上的位置以及长和宽
%这里有必要解释一下为什么figureWidth要设置为8.5;
%因详细解释需要很长的篇幅,请转公众号观看该天的文章。
figureHandle = figure;
figureUnits = 'centimeters';
figureWidth = 8.5;
figureHeight = 6;
set(gcf, 'Units', figureUnits, 'Position', [28 20 figureWidth figureHeight]);
% 注:28代表出图时图的左下角相对于整个电脑屏幕的左下角向左偏移28个单位,向上偏移20个单位。
% 可自行调节两个数字让图出在自己屏幕的某个位置

%% 定义字体和字号大小
%% 通常的SCI一般Arial字体和10字号通用
fontnamed='Arial';%字号名字
ssize=10;%字号大小
%% 如果是中文论文可以相应的更改字号名字如下
% '华文中宋' '华文仿宋' '华文宋体' '华文新魏' '华文楷体'
% '华文琥珀' '华文细黑' '华文行楷' '华文隶书' '宋体'
% '方正姚体' '微软雅黑' '方正舒体' '新宋体'
% '幼圆' '楷体' '等线' '隶书' '黑体'

%% 给定绘图颜色
load 61.mat
C1=Color(1,:);
C2=Color(2,:);
C3=Color(3,:);
C4=Color(4,:);
C5=Color(5,:);
C6=Color(6,:);

%% 数据准备
X = [1 2 3 4 5 6]';
Y1 = [2 1 2 2 1 2]';
Y2 = [1 1 1 1 2 1]';
Y3 = [1 1 1 1 1 1]';
Y4 = [1 1 2 1 1 2]';
Y5 = [2 1 2 1 2 1]';
Y6 = [1 2 1 1 1 2]';
Y=[Y1,Y2,Y3,Y4,Y5,Y6];

%% 绘图
h = barh(Y,'stacked','FaceColor','flat');hold on;%
% 赋值颜色
for k = 1:size(Y,2)
    h(k).CData = Color(k,:)./256;
end

%% 画图的标准格式代码
% text(0.5,0.9,'(a) XXX','fontsize',ssize,'FontName',fontnamed);%,'horiz','center'
xlabel('X-axis','fontsize',ssize,'FontName',fontnamed);
ylabel('Y-axis','fontsize',ssize,'FontName',fontnamed);
axis([0 10 0 7]);%XY轴的范围
xticks([1 2 3 4 5 6 7 8 9 10]);%画格网的时候的小刻度
xticklabels({'1','2','3','4','5','6','7','8','9','10'});%加x轴刻度标注
yticks([1 2 3 4 5 6]);%画格网的时候的小刻度
yticklabels({'1','2','3','4','5','6'});%加y轴刻度标注
set(gca,'linewidth',1,'fontsize',ssize,'FontName',fontnamed);
% set(gca,'yticklabel',[]);%y轴不显示
% set(gca,'xticklabel',[]);%x轴不显示
grid on;box on;hold on;

%% 画legend
%方法一
kk=legend('L1','L2','L3','L4','L5','L6');
set(kk,'location','NorthEast','Box', 'off','fontsize',ssize,'FontName',fontnamed);%'orientation','horizontal',
%方法二
% columnlegend(2,{'L1','L2','L3','L4','L5','L6'},'North');%表示一行放三个图例以及图例的位置
%% Matlab中有许多位置可以选择:
% 'North' inside plot box near top
% 'South' inside bottom
% 'East' inside right
% 'West' inside left
% 'NorthEast' inside top right (default for 2-D plots)
% 'NorthWest' inside top left
% 'SouthEast' inside bottom right
% 'SouthWest' inside bottom left
% 'NorthOutside' outside plot box near top
% 'SouthOutside' outside bottom
% 'EastOutside' outside right
% 'WestOutside' outside left
% 'NorthEastOutside' outside top right (default for 3-D plots)
% 'NorthWestOutside' outside top left
% 'SouthEastOutside' outside bottom right
% 'SouthWestOutside' outside bottom left
% 'Best' least conflict with data in plot 与绘图中的数据冲突最小
% 'BestOutside' least unused space outside plot

%% 背景颜色
set(gcf,'Color',[1 1 1])
%% 设置完毕后,按照所需分辨率、格式输出
figW = figureWidth;
figH = figureHeight;
set(figureHandle,'PaperUnits',figureUnits);
set(figureHandle,'PaperPosition',[0 0 figW figH]);
fileout = '63';
print(figureHandle,[fileout,'.png'],'-r600','-dpng');

8 【MATLAB】科研绘图第八期点线图
%% Made by Lwcah (公众号:Lwcah)
%% 公众号:Lwcah
%% 知乎、B站、小红书、抖音同名账号:Lwcah,感谢关注~
%% 更多MATLAB+SCI绘图教程敬请观看~

%% 清除变量
close all;clear all;clc;

%% 2行1列
%% 一幅图的时候figureWidth = 8.5;figureHeight = 8;调整这两个参数就可以
%定义整幅图出现的在电脑屏幕上的位置以及长和宽
%这里有必要解释一下为什么figureWidth要设置为8.5;
%因详细解释需要很长的篇幅,请转公众号观看该天的文章。
figureHandle = figure;
figureUnits = 'centimeters';
figureWidth = 8.5;
figureHeight = 8;
set(gcf, 'Units', figureUnits, 'Position', [28 20 figureWidth figureHeight]);
% 注:28代表出图时图的左下角相对于整个电脑屏幕的左下角向左偏移28个单位,向上偏移20个单位。
% 可自行调节两个数字让图出在自己屏幕的某个位置
hold on;

%% 定义2幅子图在图中的x,y以及长和宽
pos21 = zeros(2,1);
pos21(:,3) = 0.80;%长
pos21(:,4) = 0.36;%宽
pos21(1,2) = 0.53;%y
pos21(2,2) = 0.14;%y
pos21(:,1) = 0.12;%x
% subplot('position',pos21(1,:));
% subplot('position',pos21(2,:));

%% 定义字体和字号大小
%% 通常的SCI一般Arial字体和10字号通用
fontnamed='Arial';%字号名字
ssize=10;%字号大小
%% 如果是中文论文可以相应的更改字号名字如下
% '华文中宋' '华文仿宋' '华文宋体' '华文新魏' '华文楷体'
% '华文琥珀' '华文细黑' '华文行楷' '华文隶书' '宋体'
% '方正姚体' '微软雅黑' '方正舒体' '新宋体'
% '幼圆' '楷体' '等线' '隶书' '黑体'

%% 给定绘图颜色
load 61.mat
C1=Color(1,:)./256;
C2=Color(2,:)./256;
C3=Color(3,:)./256;
C4=Color(4,:)./256;
C5=Color(5,:)./256;
C6=Color(6,:)./256;

%% 画第1幅子图
subplot('position',pos21(1,:));
%% 数据准备
x=[1;2;3;4;5;6];
y1=[1;1;1;1;1;1];
y2=[2;2;2;2;2;2];
y3=[3;3;3;3;3;3];
y4=[4;4;4;4;4;4];
y5=[5;5;5;5;5;5];
y6=[6;6;6;6;6;6];

%% 绘图
h1 = line (x,y1,'LineStyle','--','Marker','o','LineWidth',1,'Color',C1, 'MarkerEdgeColor',C1,'MarkerFaceColor',C1);hold on;
h2 = line (x,y2,'LineStyle','--','Marker','o','LineWidth',1,'Color',C2, 'MarkerEdgeColor',C2,'MarkerFaceColor',C2);hold on;
h3 = line (x,y3,'LineStyle','--','Marker','o','LineWidth',1,'Color',C3, 'MarkerEdgeColor',C3,'MarkerFaceColor',C3);hold on;
h4 = line (x,y4,'LineStyle','--','Marker','o','LineWidth',1,'Color',C4, 'MarkerEdgeColor',C4,'MarkerFaceColor',C4);hold on;
h5 = line (x,y5,'LineStyle','--','Marker','o','LineWidth',1,'Color',C5, 'MarkerEdgeColor',C5,'MarkerFaceColor',C5);hold on;
h6 = line (x,y6,'LineStyle','--','Marker','o','LineWidth',1,'Color',C6, 'MarkerEdgeColor',C6,'MarkerFaceColor',C6);hold on;
%% 定义线型、标记符
% 线型: -    --      :     :.
% 表示:实线 双划线  虚线  点划线
% 标记符:  +    o     *     .     x    s    d     ^      v     >     <
% 表示:  加号 空心圆  星号 实心圆 叉号 正方形 菱形 上三角 下三角 左三角 右三角

%% 画图的标准格式代码
% text(0.5,0.9,'(a) XXX','fontsize',ssize,'FontName',fontnamed);%,'horiz','center'
% xlabel('X-axis','fontsize',ssize,'FontName',fontnamed);
ylabel('Y-axis','fontsize',ssize,'FontName',fontnamed);
axis([0 7 0 7]);%XY轴的范围
xticks([1 2 3 4 5 6 7]);%画格网的时候的小刻度
xticklabels({});%加x轴刻度标注
yticks([1 2 3 4 5 6]);%画格网的时候的小刻度
yticklabels({'1','2','3','4','5','6'});%加y轴刻度标注
set(gca,'linewidth',1,'fontsize',ssize,'FontName',fontnamed);
% set(gca,'yticklabel',[]);%y轴不显示
% set(gca,'xticklabel',[]);%x轴不显示
grid on;box on;hold on;

%% 画legend
% kk=legend('L1','L2','L3','L4','L5','L6');
%方法一
kk=legend([h1,h2,h3],'L1','L2','L3');
set(kk,'location','NorthEast','Box', 'off','fontsize',ssize,'orientation','horizontal','FontName',fontnamed);%
%方法二
% columnlegend(2,{'L1','L2','L3','L4','L5','L6'},'North');%表示一行放三个图例以及图例的位置
%% Matlab中有许多位置可以选择:
% 'North' inside plot box near top
% 'South' inside bottom
% 'East' inside right
% 'West' inside left
% 'NorthEast' inside top right (default for 2-D plots)
% 'NorthWest' inside top left
% 'SouthEast' inside bottom right
% 'SouthWest' inside bottom left
% 'NorthOutside' outside plot box near top
% 'SouthOutside' outside bottom
% 'EastOutside' outside right
% 'WestOutside' outside left
% 'NorthEastOutside' outside top right (default for 3-D plots)
% 'NorthWestOutside' outside top left
% 'SouthEastOutside' outside bottom right
% 'SouthWestOutside' outside bottom left
% 'Best' least conflict with data in plot 与绘图中的数据冲突最小
% 'BestOutside' least unused space outside plot

%% 画第2幅子图
subplot('position',pos21(2,:));
%% 数据准备
x=[1;2;3;4;5;6];
y1=[1;1;1;1;1;1];
y2=[2;2;2;2;2;2];
y3=[3;3;3;3;3;3];
y4=[4;4;4;4;4;4];
y5=[5;5;5;5;5;5];
y6=[6;6;6;6;6;6];

%% 绘图
h1 = line (x,y1,'LineStyle','--','Marker','o','LineWidth',1,'Color',C1, 'MarkerEdgeColor',C1,'MarkerFaceColor',C1);hold on;
h2 = line (x,y2,'LineStyle','--','Marker','o','LineWidth',1,'Color',C2, 'MarkerEdgeColor',C2,'MarkerFaceColor',C2);hold on;
h3 = line (x,y3,'LineStyle','--','Marker','o','LineWidth',1,'Color',C3, 'MarkerEdgeColor',C3,'MarkerFaceColor',C3);hold on;
h4 = line (x,y4,'LineStyle','--','Marker','o','LineWidth',1,'Color',C4, 'MarkerEdgeColor',C4,'MarkerFaceColor',C4);hold on;
h5 = line (x,y5,'LineStyle','--','Marker','o','LineWidth',1,'Color',C5, 'MarkerEdgeColor',C5,'MarkerFaceColor',C5);hold on;
h6 = line (x,y6,'LineStyle','--','Marker','o','LineWidth',1,'Color',C6, 'MarkerEdgeColor',C6,'MarkerFaceColor',C6);hold on;

%% 画图的标准格式代码
% text(0.5,0.9,'(a) XXX','fontsize',ssize,'FontName',fontnamed);%,'horiz','center'
xlabel('X-axis','fontsize',ssize,'FontName',fontnamed);
ylabel('Y-axis','fontsize',ssize,'FontName',fontnamed);
axis([0 7 0 7]);%XY轴的范围
xticks([1 2 3 4 5 6 7]);%画格网的时候的小刻度
xticklabels({'1','2','3','4','5','6','7'});%加x轴刻度标注
yticks([1 2 3 4 5 6]);%画格网的时候的小刻度
yticklabels({'1','2','3','4','5','6'});%加y轴刻度标注
set(gca,'linewidth',1,'fontsize',ssize,'FontName',fontnamed);
% set(gca,'yticklabel',[]);%y轴不显示
% set(gca,'xticklabel',[]);%x轴不显示
grid on;box on;hold on;

%% 画legend
kk=legend([h4,h5,h6],'L4','L5','L6');
set(kk,'location','NorthEast','Box', 'off','fontsize',ssize,'orientation','horizontal','FontName',fontnamed);%


%% 背景颜色
set(gcf,'Color',[1 1 1])
%% 设置完毕后,按照所需分辨率、格式输出
figW = figureWidth;
figH = figureHeight;
set(figureHandle,'PaperUnits',figureUnits);
set(figureHandle,'PaperPosition',[0 0 figW figH]);
fileout = '63';
print(figureHandle,[fileout,'.png'],'-r600','-dpng');

9 【MATLAB】科研绘图第九期带高斯分布的直方图
%% 带高斯分布的直方图(Histogram with Gaussian distribution)

%% Made by Lwcah(公众号:Lwcah)
%% 公众号:Lwcah
%% 知乎、B站、小红书、抖音同名账号:Lwcah,感谢关注~
%% 更多MATLAB+SCI绘图教程敬请观看~

%% 清除变量
close all;clear all;clc;

%% 1行1列
%% 一幅图的时候figureWidth = 8.5;figureHeight = 8;调整这两个参数就可以
%定义整幅图出现的在电脑屏幕上的位置以及长和宽
%这里有必要解释一下为什么figureWidth要设置为8.5;
%因详细解释需要很长的篇幅,请转公众号观看该天的文章。
figureHandle = figure;
figureUnits = 'centimeters';
figureWidth = 8.5;
figureHeight = 6;
set(gcf, 'Units', figureUnits, 'Position', [28 20 figureWidth figureHeight]);
% 注:28代表出图时图的左下角相对于整个电脑屏幕的左下角向左偏移28个单位,向上偏移20个单位。
% 可自行调节两个数字让图出在自己屏幕的某个位置

%% 定义字体和字号大小
%% 通常的SCI一般Arial字体和10字号通用
fontnamed='Arial';%字号名字
ssize=10;%字号大小
%% 如果是中文论文可以相应的更改字号名字如下
% '华文中宋' '华文仿宋' '华文宋体' '华文新魏' '华文楷体'
% '华文琥珀' '华文细黑' '华文行楷' '华文隶书' '宋体'
% '方正姚体' '微软雅黑' '方正舒体' '新宋体'
% '幼圆' '楷体' '等线' '隶书' '黑体'

%% 给定绘图颜色
C1 = chinesecolors(4);%香叶红
C2 = chinesecolors(232);%粉绿
% C3 = chinesecolors(12);%合欢红
% C4 = chinesecolors(17);%鹅冠红

%% 数据
x = 0:0.5:10;
y = gaussmf(x,[2 5]);% gaussmf(X,[Sigma,Mu]);gaussmf(X,[标准差,平均值])

%% 绘图
h1=bar(x, y, 'EdgeColor', 'none', 'BarWidth', 1,'FaceColor',C1);hold on;
h2=plot(x,y,'LineStyle','--','Marker','o','LineWidth',1,'Color',C2, 'MarkerEdgeColor',C2,'MarkerFaceColor',C2);hold on;

%% 修图的标准格式代码
% text(0.5,0.9,'(a) XXX','fontsize',ssize,'FontName',fontnamed);%,'horiz','center'
xlabel('X-axis','fontsize',ssize,'FontName',fontnamed);
ylabel('Y-axis','fontsize',ssize,'FontName',fontnamed);
% axis([0 10 0 7]);%XY轴的范围
% xticks([1 2 3 4 5 6 7 8 9 10]);%画格网的时候的小刻度
% xticklabels({'1','2','3','4','5','6','7','8','9','10'});%加x轴刻度标注
% yticks([1 2 3 4 5 6]);%画格网的时候的小刻度
% yticklabels({'1','2','3','4','5','6'});%加y轴刻度标注
set(gca,'linewidth',1,'fontsize',ssize,'FontName',fontnamed);
% set(gca,'yticklabel',[]);%y轴不显示
% set(gca,'xticklabel',[]);%x轴不显示
grid on;box on;hold on;

%% 画legend
%方法一
kk=legend('h1','h2');
set(kk,'location','NorthEast','Box', 'off','fontsize',ssize,'FontName',fontnamed);%'orientation','horizontal',
%方法二
% columnlegend(2,{'L1','L2','L3','L4','L5','L6'},'North');%表示一行放三个图例以及图例的位置

%% Matlab中有许多位置可以选择:
% 'North' inside plot box near top
% 'South' inside bottom
% 'East' inside right
% 'West' inside left
% 'NorthEast' inside top right (default for 2-D plots)
% 'NorthWest' inside top left
% 'SouthEast' inside bottom right
% 'SouthWest' inside bottom left
% 'NorthOutside' outside plot box near top
% 'SouthOutside' outside bottom
% 'EastOutside' outside right
% 'WestOutside' outside left
% 'NorthEastOutside' outside top right (default for 3-D plots)
% 'NorthWestOutside' outside top left
% 'SouthEastOutside' outside bottom right
% 'SouthWestOutside' outside bottom left
% 'Best' least conflict with data in plot 与绘图中的数据冲突最小
% 'BestOutside' least unused space outside plot

%% 背景颜色
set(gcf,'Color',[1 1 1])
%% 设置完毕后,按照所需分辨率、格式输出
figW = figureWidth;
figH = figureHeight;
set(figureHandle,'PaperUnits',figureUnits);
set(figureHandle,'PaperPosition',[0 0 figW figH]);
fileout = 'demo_histogram_gaussian';
print(figureHandle,[fileout,'.png'],'-r600','-dpng');

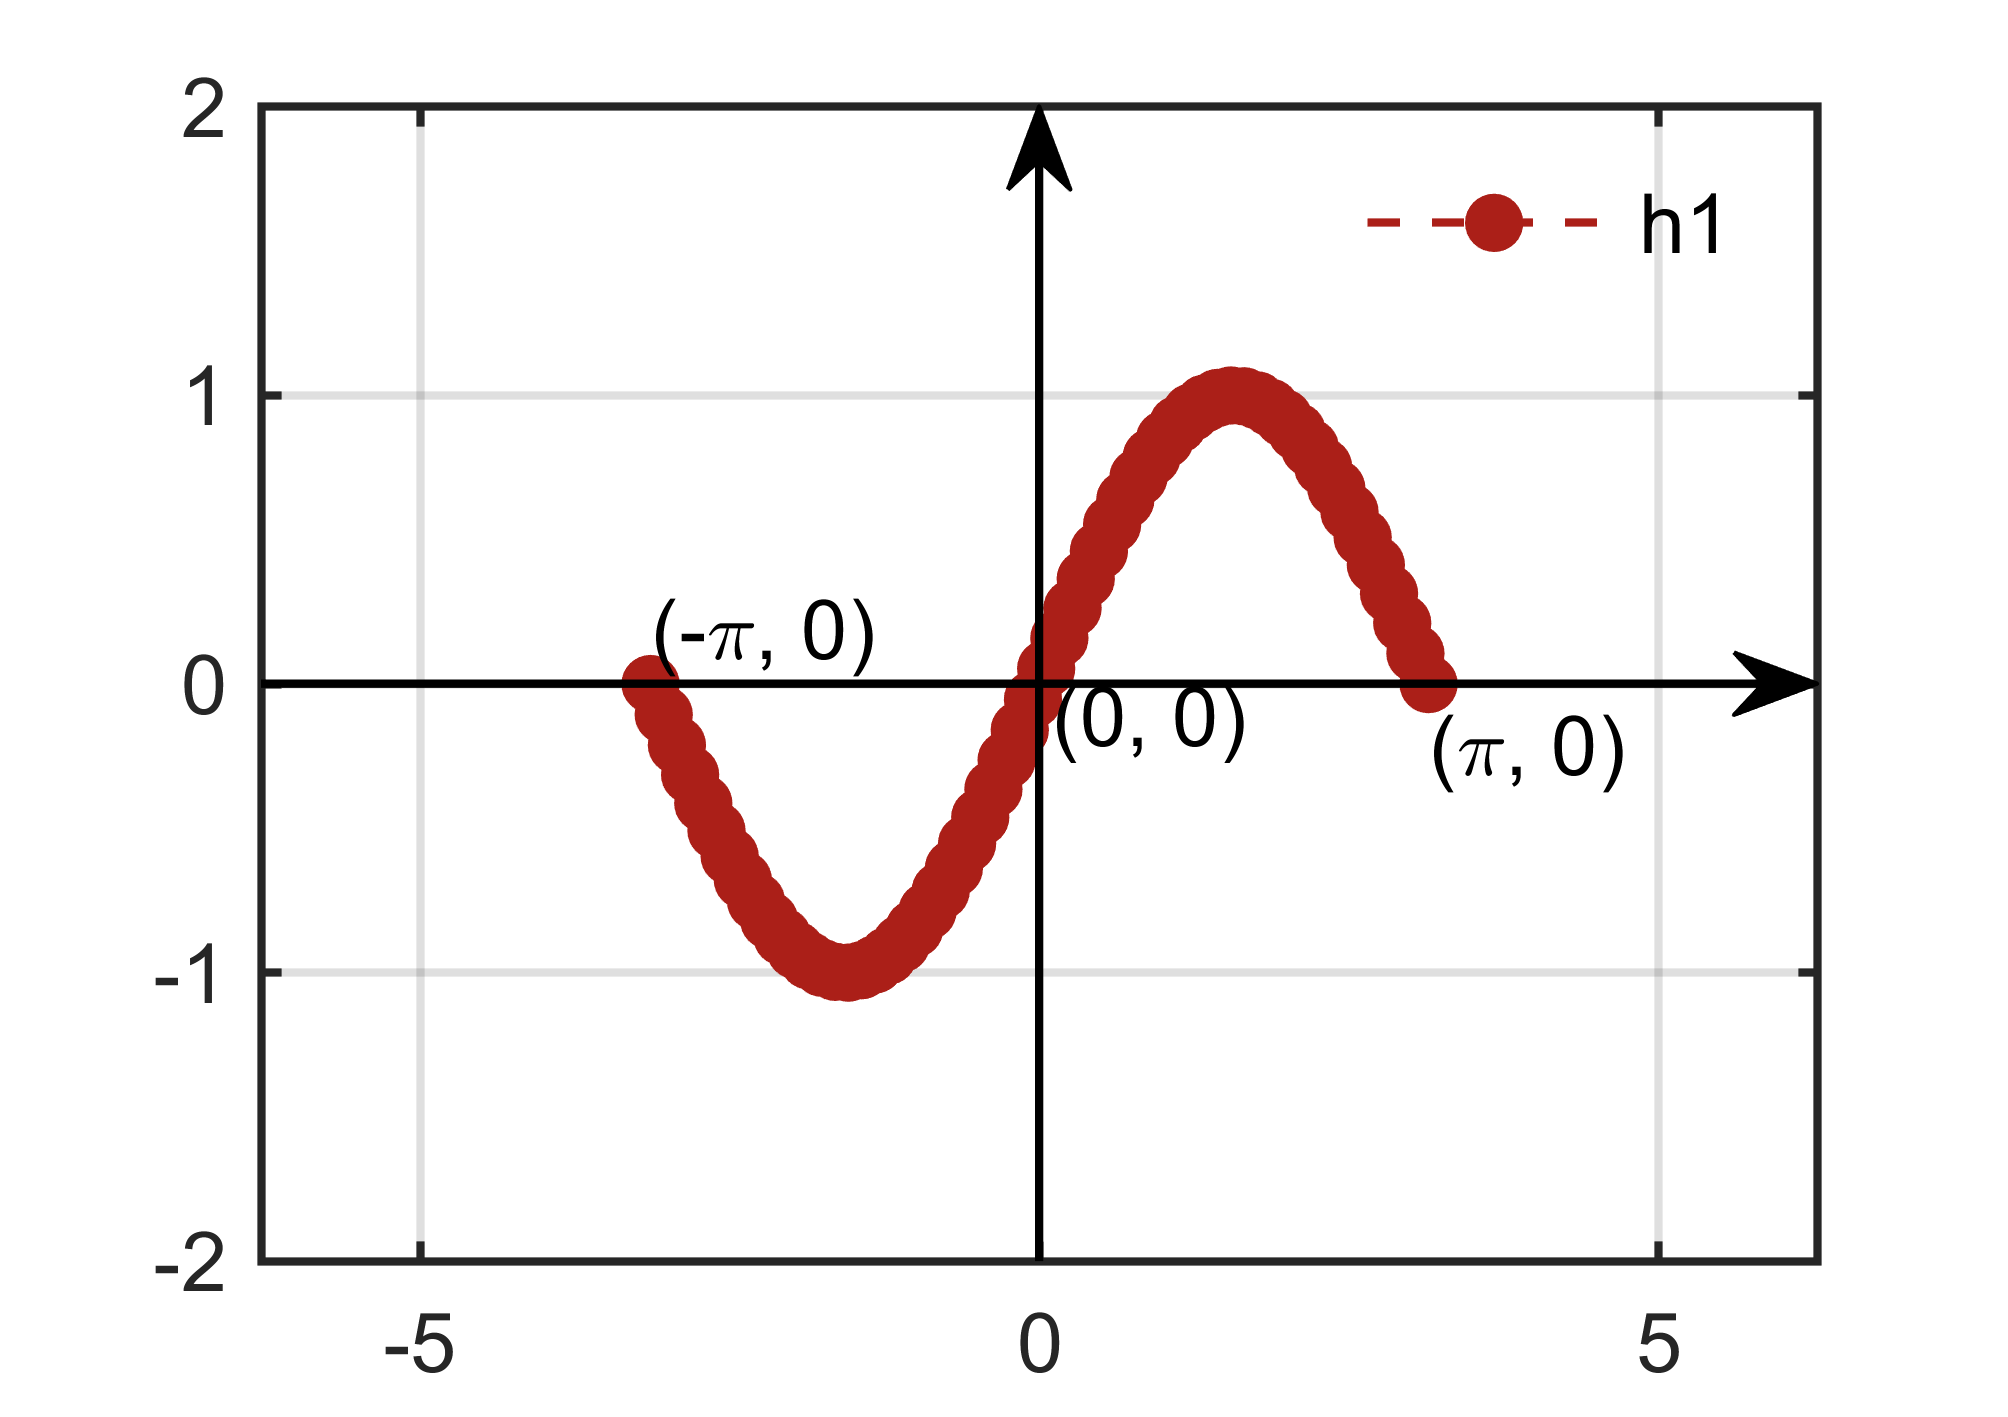
10 【MATLAB】科研绘图第十期四象限的正弦图
%% 四象限的正弦图 (Sine diagram of four quadrants)

%% Made by Lwcah(公众号:Lwcah)
%% 公众号:Lwcah
%% 知乎、B站、小红书、抖音同名账号:Lwcah,感谢关注~
%% 更多MATLAB+SCI绘图教程敬请观看~

clear;clc;close all;
%% 给定绘图颜色
C1 = chinesecolors(148);%海涛蓝
C2 = chinesecolors(516);%覆盆子红
% C3 = chinesecolors(12);%合欢红
% C4 = chinesecolors(17);%鹅冠红

%% 定义字体和字号大小
%% 通常的SCI一般Arial字体和10字号通用
fontnamed='Arial';%字号名字
ssize=10;%字号大小
%% 如果是中文论文可以相应的更改字号名字如下
% '华文中宋' '华文仿宋' '华文宋体' '华文新魏' '华文楷体'
% '华文琥珀' '华文细黑' '华文行楷' '华文隶书' '宋体'
% '方正姚体' '微软雅黑' '方正舒体' '新宋体'
% '幼圆' '楷体' '等线' '隶书' '黑体'

%% 1行1列
%% 一幅图的时候figureWidth = 8.5;figureHeight = 8;调整这两个参数就可以
%定义整幅图出现的在电脑屏幕上的位置以及长和宽
%这里有必要解释一下为什么figureWidth要设置为8.5;
%因详细解释需要很长的篇幅,请转公众号观看该天的文章。
figureHandle = figure;
figureUnits = 'centimeters';
figureWidth = 8.5;
figureHeight = 6;
set(gcf, 'Units', figureUnits, 'Position', [28 20 figureWidth figureHeight]);
% 注:28代表出图时图的左下角相对于整个电脑屏幕的左下角向左偏移28个单位,向上偏移20个单位。
% 可自行调节两个数字让图出在自己屏幕的某个位置

%% 数据
syms t
n = 60;
x = linspace(-pi,pi,n);y = sin(x);
ax = axes;

%% 绘图
h1=plot(ax,x,y,'LineStyle','--','Marker','o','LineWidth',1,'Color',C2, 'MarkerEdgeColor',C2,'MarkerFaceColor',C2);hold on% 绘制正弦曲线
PlotLineArrow(ax, [-2*pi, 2*pi], [0, 0], 'none', 'k', 1);hold on%x轴带箭头
PlotLineArrow(ax, [0, 0], [-2, 2], 'none', 'k', 1);hold on%y轴带箭头

%% 标注点
text(-pi,0.2,'(-\pi, 0)');
text(pi,-0.2,'(\pi, 0)');
text(0.1,-0.1, '(0, 0)');

%% 修图的标准格式代码
% text(0.5,0.9,'(a) XXX','fontsize',ssize,'FontName',fontnamed);%,'horiz','center'
% xlabel('X-axis','fontsize',ssize,'FontName',fontnamed);
% ylabel('Y-axis','fontsize',ssize,'FontName',fontnamed);
% axis([0 10 0 7]);%XY轴的范围
% xticks([1 2 3 4 5 6 7 8 9 10]);%画格网的时候的小刻度
% xticklabels({'1','2','3','4','5','6','7','8','9','10'});%加x轴刻度标注
% yticks([1 2 3 4 5 6]);%画格网的时候的小刻度
% yticklabels({'1','2','3','4','5','6'});%加y轴刻度标注
set(gca,'linewidth',1,'fontsize',ssize,'FontName',fontnamed);
% set(gca,'yticklabel',[]);%y轴不显示
% set(gca,'xticklabel',[]);%x轴不显示
grid on;box on;hold on;

%% 画legend
%方法一
kk=legend('h1');
set(kk,'location','NorthEast','Box', 'off','fontsize',ssize,'FontName',fontnamed);%'orientation','horizontal',
%方法二
% columnlegend(2,{'L1','L2','L3','L4','L5','L6'},'North');%表示一行放三个图例以及图例的位置

%% Matlab中有许多位置可以选择:
% 'North' inside plot box near top
% 'South' inside bottom
% 'East' inside right
% 'West' inside left
% 'NorthEast' inside top right (default for 2-D plots)
% 'NorthWest' inside top left
% 'SouthEast' inside bottom right
% 'SouthWest' inside bottom left
% 'NorthOutside' outside plot box near top
% 'SouthOutside' outside bottom
% 'EastOutside' outside right
% 'WestOutside' outside left
% 'NorthEastOutside' outside top right (default for 3-D plots)
% 'NorthWestOutside' outside top left
% 'SouthEastOutside' outside bottom right
% 'SouthWestOutside' outside bottom left
% 'Best' least conflict with data in plot 与绘图中的数据冲突最小
% 'BestOutside' least unused space outside plot

%% 背景颜色
set(gcf,'Color',[1 1 1])
%% 设置完毕后,按照所需分辨率、格式输出
figW = figureWidth;
figH = figureHeight;
set(figureHandle,'PaperUnits',figureUnits);
set(figureHandle,'PaperPosition',[0 0 figW figH]);
fileout = 'demo_XYaxis';
print(figureHandle,[fileout,'.png'],'-r600','-dpng');
11 【MATLAB】科研绘图第十一期动态趋势图
%% 动态趋势图(Dynamic trend chart)

%% Made by Lwcah (公众号:Lwcah)
%% 公众号:Lwcah
%% 知乎、B站、小红书、抖音同名账号:Lwcah,感谢关注~
%% 更多MATLAB+SCI绘图教程敬请观看~

%% 清除变量
close all;clear all;clc;

%% 1行1列
%% 一幅图的时候figureWidth = 8.5;figureHeight = 8;调整这两个参数就可以
%定义整幅图出现的在电脑屏幕上的位置以及长和宽
%这里有必要解释一下为什么figureWidth要设置为8.5;
%因详细解释需要很长的篇幅,请转公众号观看该天的文章。
figureHandle = figure;
figureUnits = 'centimeters';
figureWidth = 8.5;
figureHeight = 6;
set(gcf, 'Units', figureUnits, 'Position', [28 20 figureWidth figureHeight]);
% 注:28代表出图时图的左下角相对于整个电脑屏幕的左下角向左偏移28个单位,向上偏移20个单位。
% 可自行调节两个数字让图出在自己屏幕的某个位置

%% 定义字体和字号大小
%% 通常的SCI一般Arial字体和10字号通用
fontnamed='华文中宋';%字号名字Arial
ssize=10;%字号大小
%% 如果是中文论文可以相应的更改字号名字如下
% '华文中宋' '华文仿宋' '华文宋体' '华文新魏' '华文楷体'
% '华文琥珀' '华文细黑' '华文行楷' '华文隶书' '宋体'
% '方正姚体' '微软雅黑' '方正舒体' '新宋体'
% '幼圆' '楷体' '等线' '隶书' '黑体'

%% 给定绘图颜色
C1 = chinesecolors(343);%香水玫瑰
C2 = chinesecolors(150);%靛青
C3 = chinesecolors(523);%玫瑰灰
% C4 = chinesecolors(17);%鹅冠红

%% 数据
data_tp=xlsread('data_tp.xlsx');%excel中的五列数据分别为年、月、日、潮位数据和排序
y = data_tp(1:265,4);%选取第四列数据
len = length(y);
x = 1:len;

%% 背景颜色
set(gcf,'Color',[1 1 1]);
%% 修图的标准格式代码
% text(0.5,0.9,'(a) XXX','fontsize',ssize,'FontName',fontnamed);%,'horiz','center'
xlabel('X-axis','fontsize',ssize,'FontName',fontnamed);
ylabel('Y-axis','fontsize',ssize,'FontName',fontnamed);
% axis([0 10 0 7]);%XY轴的范围
% xticks([1 2 3 4 5 6 7 8 9 10]);%画格网的时候的小刻度
% xticklabels({'1','2','3','4','5','6','7','8','9','10'});%加x轴刻度标注
% yticks([1 2 3 4 5 6]);%画格网的时候的小刻度
% yticklabels({'1','2','3','4','5','6'});%加y轴刻度标注
set(gca,'linewidth',1,'fontsize',ssize,'FontName',fontnamed);
% set(gca,'yticklabel',[]);%y轴不显示
% set(gca,'xticklabel',[]);%x轴不显示
grid on;box on;hold on;

%% 绘图
%% 第一个点为标记点
plot(x(1), y(1), 'o', 'Color', C1, 'MarkerSize', 10, 'MarkerFaceColor', C1);hold on;
MakeGif('demo_dynamic_trend.Gif',1);hold on;%保存gif动态图
%% 循环画图
for i = 2:len
    plot(x(i-1:i), y(i-1:i), 'Color', C2, 'LineWidth', 1);hold on;% 画两个点
    axis([0 365 182.7 183.5]);%XY轴的范围
    delete(findobj('Type','text'));% 删掉文本
    delete(findobj('Marker','o'));% 删掉标记
    plot(x(i),y(i),'o','Color',C3,'MarkerSize',5,'MarkerFaceColor',C3);hold on;% 画标记点
    text(x(i),y(i),['  潮位:', num2str(y(i))], 'Color',C3); % 添加标注
    title('潮位数据');
    MakeGif('demo_dynamic_trend.Gif',i);hold on;%保存gif动态图
    pause(0.01);% 暂停 0.01s
end

%% 画legend
%方法一
kk=legend('h1');
set(kk,'location','NorthEast','Box', 'off','fontsize',ssize,'FontName',fontnamed);%'orientation','horizontal',
%方法二
% columnlegend(2,{'L1','L2','L3','L4','L5','L6'},'North');%表示一行放三个图例以及图例的位置

%% Matlab中有许多位置可以选择:
% 'North' inside plot box near top
% 'South' inside bottom
% 'East' inside right
% 'West' inside left
% 'NorthEast' inside top right (default for 2-D plots)
% 'NorthWest' inside top left
% 'SouthEast' inside bottom right
% 'SouthWest' inside bottom left
% 'NorthOutside' outside plot box near top
% 'SouthOutside' outside bottom
% 'EastOutside' outside right
% 'WestOutside' outside left
% 'NorthEastOutside' outside top right (default for 3-D plots)
% 'NorthWestOutside' outside top left
% 'SouthEastOutside' outside bottom right
% 'SouthWestOutside' outside bottom left
% 'Best' least conflict with data in plot 与绘图中的数据冲突最小
% 'BestOutside' least unused space outside plot

%% 设置完毕后,按照所需分辨率、格式输出
figW = figureWidth;
figH = figureHeight;
set(figureHandle,'PaperUnits',figureUnits);
set(figureHandle,'PaperPosition',[0 0 figW figH]);
fileout = 'demo_dynamic_trend';
print(figureHandle,[fileout,'.png'],'-r600','-dpng');


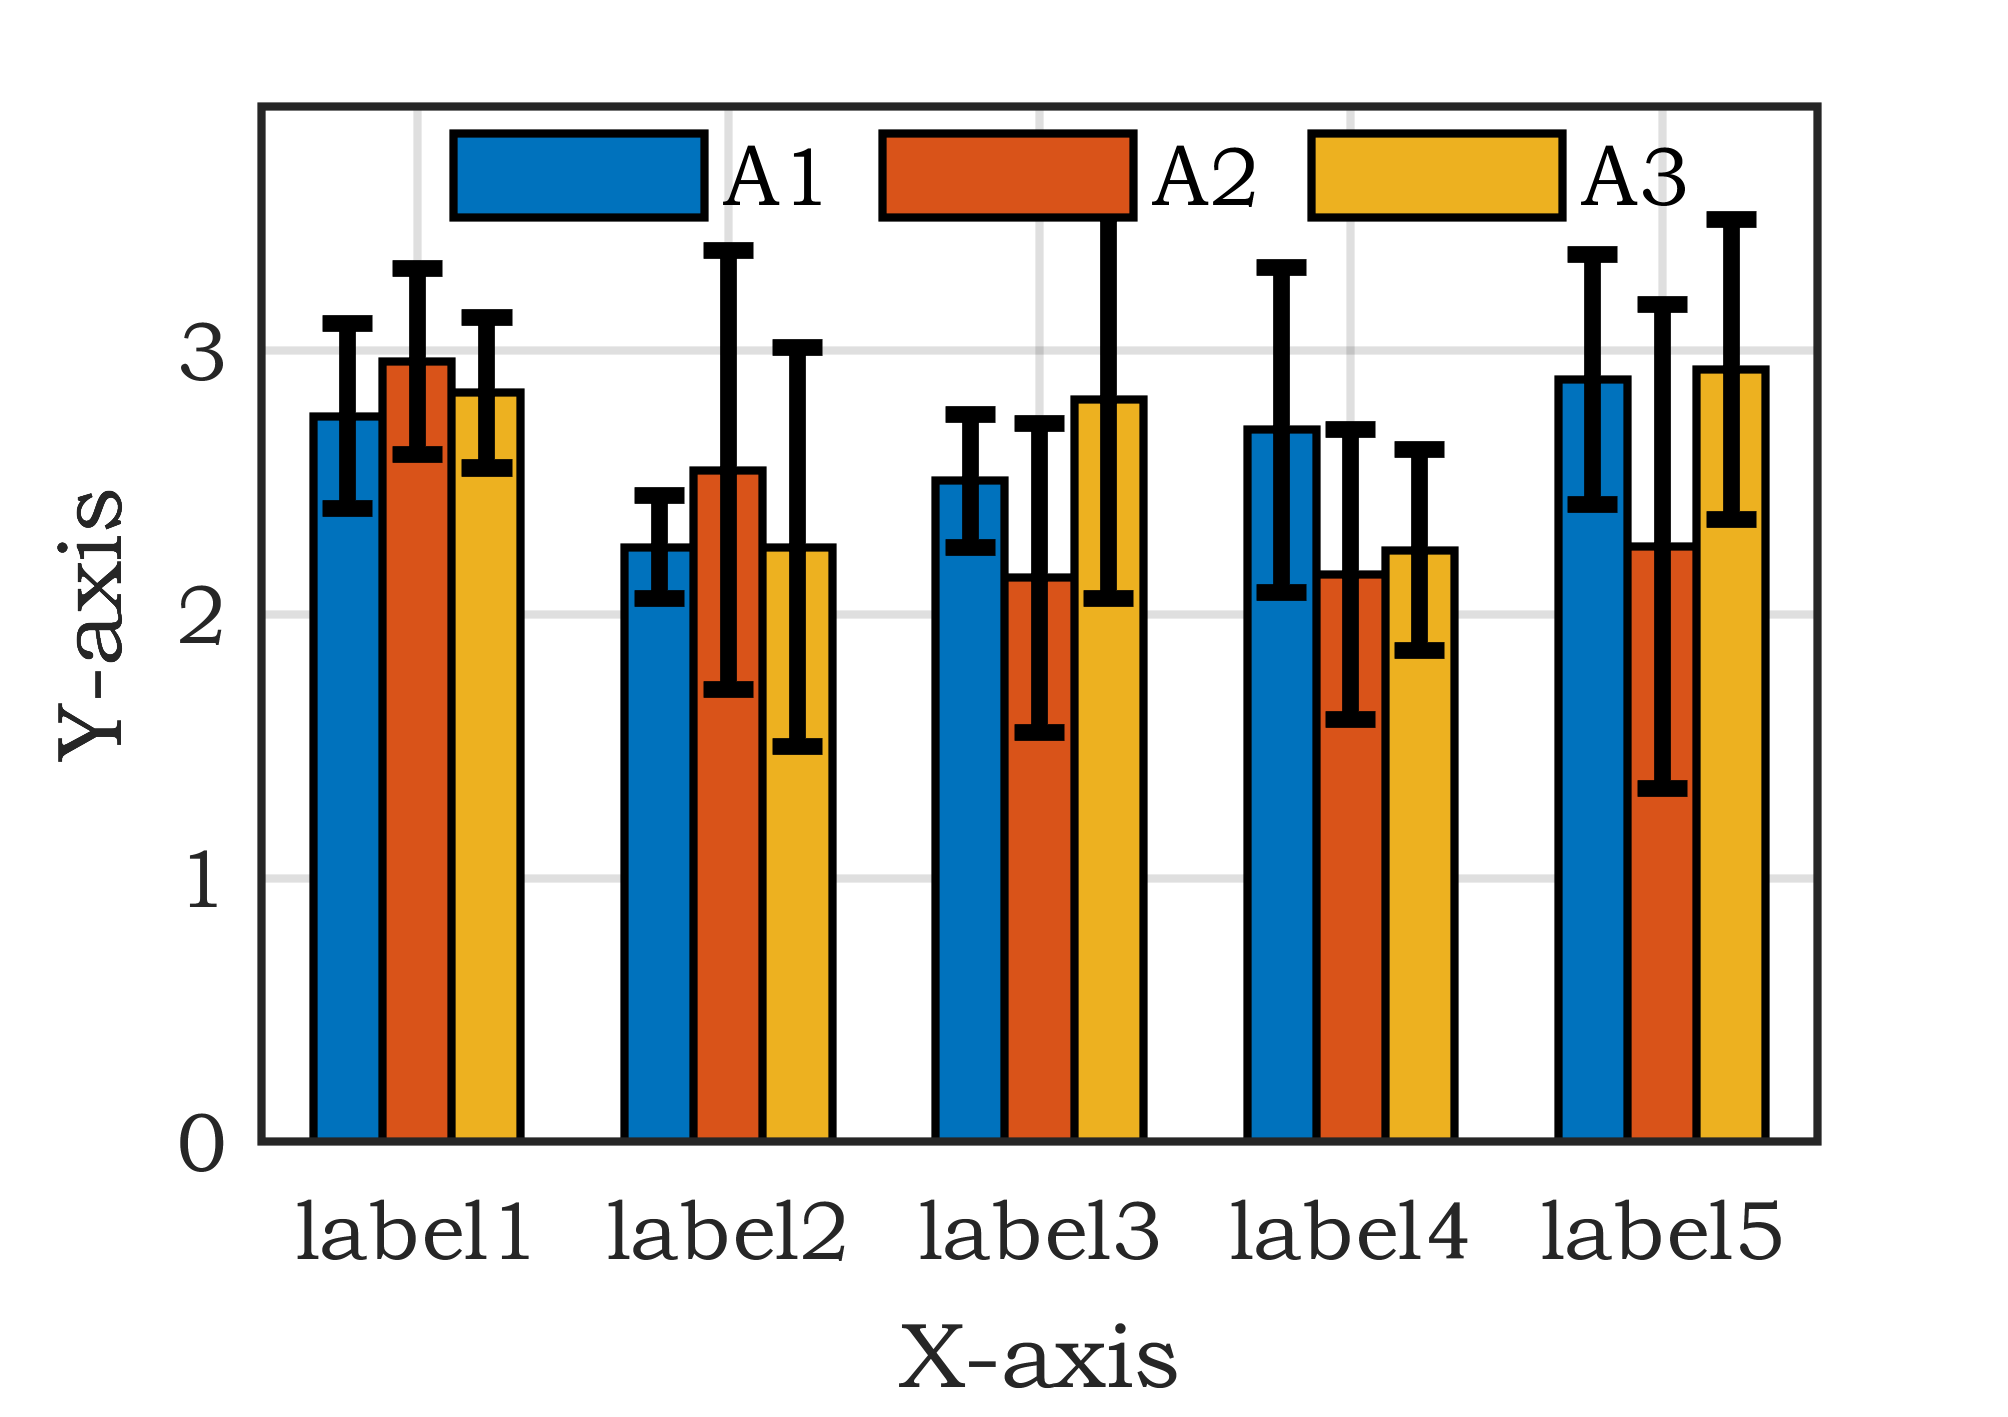
12 【MATLAB】科研绘图第十二期带误差棒的柱状图
%% 带误差棒的柱状图

%% Made by Lwcah(公众号:Lwcah)
%% 公众号:Lwcah
%% 知乎、B站、小红书、抖音同名账号:Lwcah,感谢关注~
%% 更多MATLAB+SCI绘图教程敬请观看~

%% 清除变量
close all;clear all;clc;

%% 1行1列
%% 一幅图的时候figureWidth = 8.5;figureHeight = 8;调整这两个参数就可以
%定义整幅图出现的在电脑屏幕上的位置以及长和宽
%这里有必要解释一下为什么figureWidth要设置为8.5;
%因详细解释需要很长的篇幅,请转公众号观看该天的文章。
figureHandle = figure;
figureUnits = 'centimeters';
figureWidth = 8.5;
figureHeight = 6;
set(gcf, 'Units', figureUnits, 'Position', [28 20 figureWidth figureHeight]);
% 注:28代表出图时图的左下角相对于整个电脑屏幕的左下角向左偏移28个单位,向上偏移20个单位。
% 可自行调节两个数字让图出在自己屏幕的某个位置

%% 定义字体和字号大小
%% 通常的SCI一般Arial字体和10字号通用
fontnamed='华文中宋';%字号名字Arial
ssize=10;%字号大小
%% 如果是中文论文可以相应的更改字号名字如下
% '华文中宋' '华文仿宋' '华文宋体' '华文新魏' '华文楷体'
% '华文琥珀' '华文细黑' '华文行楷' '华文隶书' '宋体'
% '方正姚体' '微软雅黑' '方正舒体' '新宋体'
% '幼圆' '楷体' '等线' '隶书' '黑体'

%% 给定绘图颜色
C1 = chinesecolors(343);%香水玫瑰
C2 = chinesecolors(150);%靛青
C3 = chinesecolors(523);%玫瑰灰
% C4 = chinesecolors(17);%鹅冠红

%% 数据
m = 5;
n = 3;
x = 1:m;
y = rand(m, n) + 2;

%% 绘制误差棒图barweb
neg = rand(m, n);% 误差限
barweb(y, neg, 1, {'label1', 'label2', 'label3', 'label4', 'label5'});

%% 背景颜色
set(gcf,'Color',[1 1 1]);
%% 修图的标准格式代码
% text(0.5,0.9,'(a) XXX','fontsize',ssize,'FontName',fontnamed);%,'horiz','center'
xlabel('X-axis','fontsize',ssize,'FontName',fontnamed);
ylabel('Y-axis','fontsize',ssize,'FontName',fontnamed);
% axis([0 10 0 7]);%XY轴的范围
% xticks([1 2 3 4 5 6 7 8 9 10]);%画格网的时候的小刻度
% xticklabels({'1','2','3','4','5','6','7','8','9','10'});%加x轴刻度标注
% yticks([1 2 3 4 5 6]);%画格网的时候的小刻度
% yticklabels({'1','2','3','4','5','6'});%加y轴刻度标注
set(gca,'linewidth',1,'fontsize',ssize,'FontName',fontnamed);
% set(gca,'yticklabel',[]);%y轴不显示
% set(gca,'xticklabel',[]);%x轴不显示
grid on;box on;hold on;

%% 画legend
hLegend1=legend('A1', 'A2', 'A3','Location', 'northeast','Box', 'off','Orientation','horizontal','fontsize',ssize,'FontName',fontnamed);
%方法一
% kk=legend('h1');
% set(kk,'location','NorthEast','Box', 'off','fontsize',ssize,'FontName',fontnamed);%'orientation','horizontal',
%方法二
% columnlegend(2,{'L1','L2','L3','L4','L5','L6'},'North');%表示一行放三个图例以及图例的位置

%% Matlab中有许多位置可以选择:
% 'North' inside plot box near top
% 'South' inside bottom
% 'East' inside right
% 'West' inside left
% 'NorthEast' inside top right (default for 2-D plots)
% 'NorthWest' inside top left
% 'SouthEast' inside bottom right
% 'SouthWest' inside bottom left
% 'NorthOutside' outside plot box near top
% 'SouthOutside' outside bottom
% 'EastOutside' outside right
% 'WestOutside' outside left
% 'NorthEastOutside' outside top right (default for 3-D plots)
% 'NorthWestOutside' outside top left
% 'SouthEastOutside' outside bottom right
% 'SouthWestOutside' outside bottom left
% 'Best' least conflict with data in plot 与绘图中的数据冲突最小
% 'BestOutside' least unused space outside plot

%% 设置完毕后,按照所需分辨率、格式输出
figW = figureWidth;
figH = figureHeight;
set(figureHandle,'PaperUnits',figureUnits);
set(figureHandle,'PaperPosition',[0 0 figW figH]);
fileout = 'demo_errorbar';
print(figureHandle,[fileout,'.png'],'-r600','-dpng');
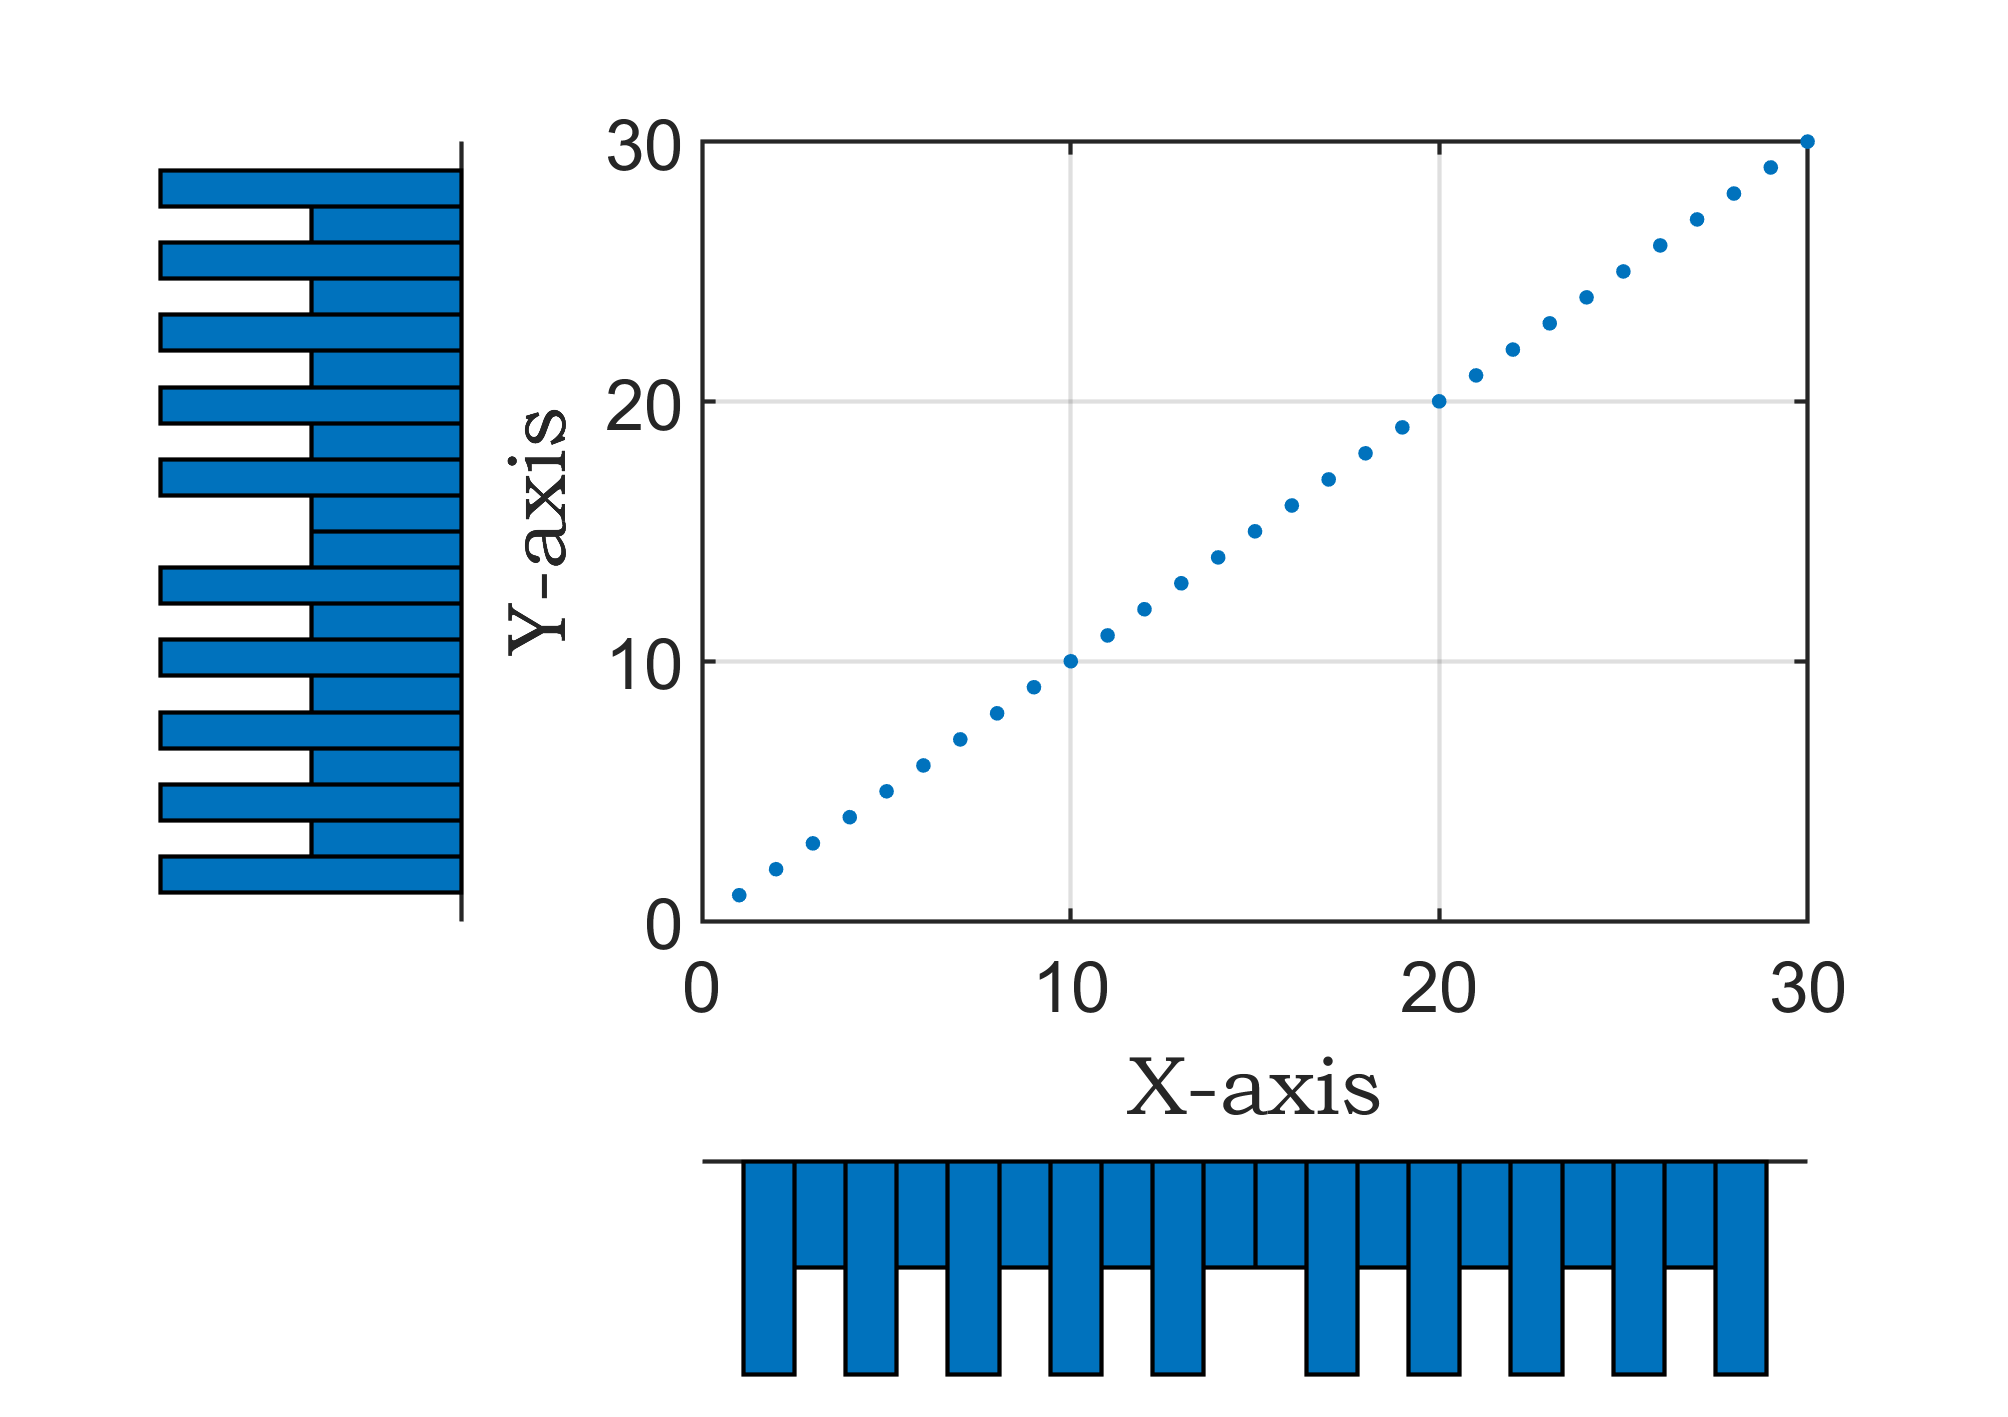
13 【MATLAB】科研绘图第十三期表示散点分布的双柱状统计图
%% 表示散点分布的双柱状统计图

%% Made by Lwcah(公众号:Lwcah)
%% 公众号:Lwcah
%% 知乎、B站、小红书、抖音同名账号:Lwcah,感谢关注~
%% 更多MATLAB+SCI绘图教程敬请观看~

%% 清除变量
close all;clear all;clc;

%% 1行1列
%% 一幅图的时候figureWidth = 8.5;figureHeight = 8;调整这两个参数就可以
%定义整幅图出现的在电脑屏幕上的位置以及长和宽
%这里有必要解释一下为什么figureWidth要设置为8.5;
%因详细解释需要很长的篇幅,请转公众号观看该天的文章。
figureHandle = figure;
figureUnits = 'centimeters';
figureWidth = 8.5;
figureHeight = 6;
set(gcf, 'Units', figureUnits, 'Position', [28 20 figureWidth figureHeight]);
% 注:28代表出图时图的左下角相对于整个电脑屏幕的左下角向左偏移28个单位,向上偏移20个单位。
% 可自行调节两个数字让图出在自己屏幕的某个位置

%% 定义字体和字号大小
%% 通常的SCI一般Arial字体和10字号通用
fontnamed='华文中宋';%字号名字Arial
ssize=10;%字号大小
%% 如果是中文论文可以相应的更改字号名字如下
% '华文中宋' '华文仿宋' '华文宋体' '华文新魏' '华文楷体'
% '华文琥珀' '华文细黑' '华文行楷' '华文隶书' '宋体'
% '方正姚体' '微软雅黑' '方正舒体' '新宋体'
% '幼圆' '楷体' '等线' '隶书' '黑体'

%% 给定绘图颜色
C1 = chinesecolors(343);%香水玫瑰
C2 = chinesecolors(150);%靛青
C3 = chinesecolors(523);%玫瑰灰
% C4 = chinesecolors(17);%鹅冠红

%% 数据
x = 1:30;
y = x+rand(1,30)*0.01;

%% 表示散点分布的双柱状统计图绘图
[n1,ctr1] = hist(x,20);
[n2,ctr2] = hist(y,20);

subplot(2,2,2);
plot(x,y,'.');
axis on; h1 = gca;hold on;box on;grid on;
xlabel('X-axis','fontsize',ssize,'FontName',fontnamed);
ylabel('Y-axis','fontsize',ssize,'FontName',fontnamed);

subplot(2,2,4);
bar(ctr1,-n1,1);axis off; h2 = gca;

subplot(2,2,1);
barh(ctr2,-n2,1);axis off; h3 = gca;

h1.Position = [0.35 0.35 0.55 0.55];
h2.Position = [.35 .03 .55 .15];
h3.Position = [.08 .35 .15 .55];


%% 修图的标准格式代码
% text(0.5,0.9,'(a) XXX','fontsize',ssize,'FontName',fontnamed);%,'horiz','center'
% title('1000');
% xlabel('X-axis','fontsize',ssize,'FontName',fontnamed);
% ylabel('Y-axis','fontsize',ssize,'FontName',fontnamed);
% axis([0 10 0 7]);%XY轴的范围
% xticks([1 2 3 4 5 6 7 8 9 10]);%画格网的时候的小刻度
% xticklabels({'1','2','3','4','5','6','7','8','9','10'});%加x轴刻度标注
% yticks([1 2 3 4 5 6]);%画格网的时候的小刻度
% yticklabels({'1','2','3','4','5','6'});%加y轴刻度标注
set(gca,'linewidth',1,'fontsize',ssize,'FontName',fontnamed);
% set(gca,'yticklabel',[]);%y轴不显示
% set(gca,'xticklabel',[]);%x轴不显示
grid on;box on;hold on;

%% 画legend
% hLegend1=legend('A1', 'A2', 'A3','Location', 'northeast','Box', 'off','Orientation','horizontal','fontsize',ssize,'FontName',fontnamed);
%方法一
% kk=legend('h1');
% set(kk,'location','NorthEast','Box', 'off','fontsize',ssize,'FontName',fontnamed);%'orientation','horizontal',
%方法二
% columnlegend(2,{'L1','L2','L3','L4','L5','L6'},'North');%表示一行放三个图例以及图例的位置

%% Matlab中有许多位置可以选择:
% 'North' inside plot box near top
% 'South' inside bottom
% 'East' inside right
% 'West' inside left
% 'NorthEast' inside top right (default for 2-D plots)
% 'NorthWest' inside top left
% 'SouthEast' inside bottom right
% 'SouthWest' inside bottom left
% 'NorthOutside' outside plot box near top
% 'SouthOutside' outside bottom
% 'EastOutside' outside right
% 'WestOutside' outside left
% 'NorthEastOutside' outside top right (default for 3-D plots)
% 'NorthWestOutside' outside top left
% 'SouthEastOutside' outside bottom right
% 'SouthWestOutside' outside bottom left
% 'Best' least conflict with data in plot 与绘图中的数据冲突最小
% 'BestOutside' least unused space outside plot


%% 背景颜色
set(gcf,'Color',[1 1 1]);
%% 设置完毕后,按照所需分辨率、格式输出
figW = figureWidth;
figH = figureHeight;
set(figureHandle,'PaperUnits',figureUnits);
set(figureHandle,'PaperPosition',[0 0 figW figH]);
fileout = 'demo_scartter_double_bar';
print(figureHandle,[fileout,'.png'],'-r600','-dpng');