今天带来一下MATHWORKS官方举办的迷你黑客大赛第三期(MATLAB Flipbook Mini Hack)的最新进展!!目前比赛已经进行了两周非常荣幸能够成为第一周的阶段性获奖者:

本来并不打算每周进行一次赛况讲解,但是由于字符限制改成了2000,大家的创造力仿佛上了一个台阶,一周内又是超级多优秀的作品被给出,
本次比赛要求提交名为drawframe(f)的函数代码,生成长达2s,48帧的动态图,动图生成是依靠如下代码来做到的:
function contestAnimator()
    animFilename = 'animation.gif'; % Output file name
    firstFrame = true;
    framesPerSecond = 24;
    delayTime = 1/framesPerSecond;
    % Create the gif
    for frame = 1:48
        drawframe(frame)
        fig = gcf();
        fig.Units = 'pixels';
        fig.Position(3:4) = [300,300];
        im = getframe(fig);
        [A,map] = rgb2ind(im.cdata,256);
        if firstFrame
            firstFrame = false;
            imwrite(A,map,animFilename, LoopCount=Inf, DelayTime=delayTime);
        else
            imwrite(A,map,animFilename, WriteMode="append", DelayTime=delayTime);
        end
    end
end
闲话少叙,一起看作品!!
作品概览
Tim大佬继续大展身手:
Tim / Lanterns
https://ww2.mathworks.cn/matlabcentral/communitycontests/contests/6/entries/14082

function drawframe(f)
tic
persistent frms     % Once again, doing all the primary plotting at f==1 and just
                    % Storing the frame data
rng default
if f==1
NL=200;                                     % Number of lanterns
xyzL=rand(3,NL).*[6;6;3]*10+[0;0;2]*1;      % Locations
% Create lanterns & interiors and store handles
for n = 1:NL
    [xc,yc,zc,cmp]=lantern(.6+.4*rand(1),(rand(1)-.5)*.1);
    r=sqrt(xc(1).^2+yc(1).^2);
    [xl,yl,zl]=ll(r,zc(1));
    S{n}=warp(xc+xyzL(1,n),yc+xyzL(2,n),zc+xyzL(3,n),cmp);
    hold on;
    S2{n}=warp(xl+xyzL(1,n),yl+xyzL(2,n),zl+xyzL(3,n),cmp(1:10,1,:).^.5);
    C1{n}=S{n}.CData;
    C2{n}=S2{n}.CData;
end
% Twinkler
lgt=exp(-linspace(-1,1,49).^2*200)'*ones(1,NL);
for n=1:NL
    lgt(:,n)=1-circshift(lgt(:,n),randi(48,1))*rand(1)*.7;
end
% This lantern will be the focus of the scene
sl=[5,5,3];
[xc,yc,zc,cmp]=lantern(.6+.4*rand(1),(rand(1)-.5)*.1);
r=sqrt(xc(1).^2+yc(1).^2);
[xl,yl,zl]=ll(r,zc(1));
warp(xc+sl(1),yc+sl(2),zc+sl(3),cmp);
warp(xl+sl(1),yl+sl(2),zl+sl(3),cmp(1:10,1,:).^.6);
% Create motion vector for each lantern
rand(6,NL);                     % Jogging the random stream to a position I like
xm=randn(3,NL).*[1;.5;1]/40;
% Make figure big to reduce aliasing
S{1}.Parent.Parent.Position(3:4)=[1120,840];
% Pretty
axis equal off
set(gcf,'color',[.2,.1,.15]);
camproj p
camva(40);
camtarget(sl);
% Loop poses
for n = 1:48
    % Update lantern positions & twinkle
    for m = 1:NL
        S{m}.XData=S{m}.XData+xm(1,m);
        S2{m}.XData=S2{m}.XData+xm(1,m);
        S{m}.YData=S{m}.YData+xm(2,m);
        S2{m}.YData=S2{m}.YData+xm(2,m);
        S{m}.ZData=S{m}.ZData+xm(3,m);
        S2{m}.ZData=S2{m}.ZData+xm(3,m);
        S{m}.CData=C1{m}.*lgt(n,m);
        S2{m}.CData=C2{m}.*lgt(n,m);
    end
    % Update camera position
    campos([n/(17),n/100,n/80]);

    % Get frame, apply anti-alias filter and decimate
    R=getframe(gcf);
    R=imgaussfilt(double(R.cdata)/255,2);
    frms{n}=R(1:2:end,1:2:end,:);
end
close
end
% Load frame
IG=frms{f};
% Apply glow
for n = 1:2
IG=max(IG,imgaussfilt(IG,21));
end
% Final frame:
image(IG);
axis equal off
camva(5)
toc
end
% Lantern interior: a lit hemisphere
function [x,y,z]=ll(r,zo)
[x,y,z]=sphere(20);
x=x(11:end,:)*r;
y=y(11:end,:)*r;
z=z(11:end,:)+zo;
end
% Lantern exterior
% f (randomized when called) controls shape
% s (randomized when called) controls hue
function [x,y,z,cmp]=lantern(f,s)
wn=tukeywin(30,f);
[xc,yc,zc]=cylinder(wn,20);
xc=xc(9:end,:);
yc=yc(9:end,:);
zc=zc(9:end,:);
zc=zc-.5;
x=xc.*(rescale(zc)+2)/3;
y=yc.*(rescale(zc)+2)/3;
z=erf(zc*4)*1.5;
z=z*max((min(1-f,.3)/.3),.5);
% Special colormap for lanterns
y1=[245,241,130]/255;
y2=[255,142,76]/255;
y3=[203,121,71]/255;
cmp=interp1([1,80,256]',[y1;y2;y3*.5],(1:256)','spline');
% Rotate hue of colormap
g=rgb2hsv(min(cmp,1));
g(:,1)=g(:,1)+s;
g(g<0)=1+g(g<0);
cmp=hsv2rgb(g);
cmp=permute(cmp,[1,3,2]);
%S.D.G.
end
Tim / Morning ascent
https://ww2.mathworks.cn/matlabcentral/communitycontests/contests/6/entries/13820

function drawframe(f)
% Trying to meet last years character limits!
if f == 1
rng(1,'v4')
x=(-1:.005:1).^2;
g=30*abs(ifft2(exp(6*i*rand(401))./(x'+x+1e-5)));
s=@(x,y)surf(x,'EdgeC','none','FaceC',y);
s(g,'k');
hold
s(conv2(g+1,ones(20)/400),'w');
axis equal off
camproj p;
camva(40);
end
campos([20 20+f 45+f/2]);
set(gcf,'color',[0,.1,.3]+f/69);
light('color',[2,1,1]/4);
en
Tim / Ruby
https://ww2.mathworks.cn/matlabcentral/communitycontests/contests/6/entries/13952

function drawframe(f)
% Red version / bigger scales.
persistent frms     % All we will be keeping is the cell array of frames because
                    % the whole loop will run on the first function call.
                    % The reason for this is that some spatially variant
                    % blurring will be applied to the RGB data on each
                    % loop.
tic
if f == 1

% Base texture scale
x=linspace(-4, 4, 400);
% Shape of scale - ovalish but extended on one side
m=1-(erf(50*(3*x'.^2+x.^2-.5)+max(24*x.^5,-20))+1)/2;   % Basic scale shape & mask
m=max(m,circshift(m,[0,5]));                            % Needs to be a bit longer
% Scales are slightly curved
s=m.*cos(2*x');
s=s-x.*m/3;         % Needs change in height so that it overlaps well
k=m.*rescale(1./(abs(x') + 0.01))*0.1.*(min(0,x-0.3).^2);           % Add keel
s=s+k+conv2(m.*randn(size(k))/100, ones(1,11)/11, 'same');          % Some textury-noise
% Now the tiling...
so=s;
SS=40;
for n = 1:9
    so = max(so, circshift(s, n*SS));
end
so = max(so, circshift(so, [SS/2, 40]));
for n = 1:4;
    so = max(so, circshift(so, [0, 80*n]));
end
so(so<0.7)=0.7;
% Turn into radial distance
so=so*0.4;
so=so'+10;
so=flipud(so);
% More tiling
so=[so,so];
so=[so;so];
% Apply to snake body. Snakes are not cylindrical, they have a prominent
% spine and flat underside (sort of / lots of variation here)
a=linspace(0,2*pi,size(so, 2))-pi;
sob=so;
so = so + (exp(-(a).^2*50) - exp(-(a+pi).^2*2)*2)- exp(-(a-pi).^2*2)*2;
x=sin(a).*so;
y=cos(a).*so;
z=linspace(-1,1,size(x,1))'.*ones(1,length(a))*8*3;
% Woops, that was too high resolution. Cut off the backside so it renders
x=x(:, (1:325)+375);
y=y(:, (1:325)+375);
z=z(:, (1:325)+375);
sob=sob(:, (1:325)+375);
% Still too high resolution. Decimate...
% x=x(1:2:end, 1:2:end);
% y=y(1:2:end, 1:2:end);
% z=z(1:2:end, 1:2:end);
% sob=sob(1:2:end, 1:2:end);
% Plot
S=surf(x,z,y,rescale(sob).*cat(3,1,.2,0), 'SpecularStrength', 0.5, 'DiffuseStrength', 1, 'AmbientStrength', 0);
shading flat
% Too pixelated. Make larger
S.Parent.Parent.Position(3:4)=[1120,840];
% Camera setup etc.
axis equal off
set(gcf, 'color', 'k');
light('position', [0, 0, 1]);
view([90, 10]);
camtarget([0,-4,5]);
campos([265, 0.05*n*4, 48]);
camproj p
camva(5);
% Rotate snake through image in 48 frames
for n = 1:48
    S.YData = z -.05*n*4;
    S.ZData = y - .004*(S.YData+4).^2;
    drawnow;
    frms{n}=getframe(gcf);
end
% Close because we are actually going to work with the rgb data
close
end
% Now lens blur simulation -> weight w/cosine tapering
wn=min((1-cos(linspace(0, 2*pi, size(frms{f}.cdata(:,:,1),2))))/1.9, 1);
IG=flt(frms{f}.cdata,wn,2);
% Decimate
IG=IG(1:2:end, 1:2:end, :);
image(IG);
axis equal off
camva(6)
toc
end
% Local smoother
function in=flt(in,wgt,nits)
if nargin == 1
    wgt = zeros(size(in(:,:,1)));
    nits=1;
end
in = double(in)/255;
% Blur kernel
krn = [1, 2, 3, 4, 5, 4, 3, 2, 1]';
krn = krn*krn';
krn = krn/sum(krn(:));
% Apply to each color channel
for m = 1:3
    for mm = 1:nits
        in(:, :,m) = wgt.*in(:,:,m) + (1-wgt).*conv2(in(:,:,m), krn, 'same');
    end
end
% S.D.G.
end
Tim / Fracture
https://ww2.mathworks.cn/matlabcentral/communitycontests/contests/6/entries/14377

function drawframe(f)
% Done with my kids! Explosion using voronoi cells.
persistent V T T2 Vg Xo R C L L2
rng default
N=150;                      % Number of voronoi domains
v=@(x)vecnorm(x);           % This is used a lot...
    if f==1

        % Distribute points in the unit sphere, biased toward the center
        Xo=randn(3,N);
        Xo=Xo./v(Xo).*rand(1, N);
        % Bounding layer of points that will create our outer surface. Need
        % lots of them...
        NA=100;
        ps=randn(3,NA);
        ps=1.3*ps./v(ps);
        % Concatenate
        X=[Xo,ps]';
        % Voronoi diagram
        [V,R]=voronoin(X);
        mnR=cellfun(@min, R)~=1;                              % Which cells have inf's
        ginds=unique(cell2mat(R(~mnR)'));                     % Get bordering nodes
        Iinds=setdiff(1:size(V,1), ginds);                    % Get interior nodes
        mxr=max(v(V(Iinds,:)'));
        ginds(1)=[];                                          % Get rid of inf

        % Make non-inf outer-nodes have unit radius * some small scale factor
        V(ginds,:)=1.3*V(ginds,:)./v(V(ginds,:)')';

        % Glow
        Vg=ones(size(V,1),1);
        Vg(ginds)=0;

        TS=@(k,x,y,z,C)trisurf(k,x,y,z,'FaceC',C,'EdgeC','none');
        cnt = 1;
        for n = 1:length(mnR)
            if mnR(n) == 1
                xt=V(R{n},1);
                yt=V(R{n},2);
                zt=V(R{n},3);
                C=[1,1,1];
                k = convhull(xt,yt,zt);
                T{n}=TS(k,xt,yt,zt,C/2);
                hold on;
                material(T{n},[0,1,0,3]);
                s=1.1;
                T2{n}=TS(k,xt*s,yt*s,zt*s,C);
                material(T2{n},[1,0,0,3]);
                set(T2{n},'FaceAlpha','interp','FaceVertexAlphaData',.1*Vg(R{n}),'AlphaDataMapping','None');

                if cnt == 1
                    set(gca, 'color', 'k');
                    axis equal off
                    axis([-1,1,-1,1,-1,1]*6);
                    cnt = cnt + 1;
                    camproj p
                    camva(70);
                    campos([-55-5 -71 52]/30);
                    set(gcf,'color','k');
                    L2=light;
                    L{1}=light('position',[0,0,0],'style','local');
                    L{2}=light('position',[0.1,0,0], 'style','local');
                end
            end
        end
    elseif f<10
        for n=1:N
            T2{n}.FaceVertexAlphaData = .1*Vg(R{n})*f;
        end
    L2.Color = C/f;
    elseif f >= 10

        % Loop over fragments and expand
        for n = 1:N
            T2{n}.Vertices=1.3*V(R{n},:)*4000/f.^3;
            T2{n}.FaceVertexAlphaData=T2{n}.FaceVertexAlphaData*.95;
            T{n}.Vertices=T{n}.Vertices+2.5*Xo(:,n)'/f;
        end
        if f > 20
        for n=1:2
            L{n}.Color=L{n}.Color*.96;
        end
        L2.Color = C*f/48;
        end
    end
end
Jr大佬的一系列字符够成的画:
Jr / the rise of Matzilla!
https://ww2.mathworks.cn/matlabcentral/communitycontests/contests/6/entries/14292

%Hello all!!
%I started this code with one of my 2021 mini hack images:
%https://www.mathworks.com/matlabcentral/communitycontests/contests/4/entries/3626
%The result is just some layers of ocean made with two sines each, a good
%"capture" of them, and an emoji of our cute monster up and down.
%Aah, and some triangles to make him not so cute.
%First, we make layers of blue waves, then we make MATzilla and finally, we finish adding more waves.
function drawframe(f)
    c=1200;
    d=700;
    n=800;
    m=.37;
    hold on;

%Let's make the ocean (1st part): we have some layers here [18-9] (behind Matzilla).
for i=18:-1:9
    y=i/11*d;
    a=10*m^(i-1);
    u=c*(1-(i-1)/8);
    x=linspace(0,c,n);
    p=y/d*4*pi;
    t=x*2*pi/u;
    q=sin(f/4+.3*t)+sin(f/8+.2*t); %if you'll remix another ocean,
    %you can change the frequency of them, or the amplitude... I used a frequency
    %division whose result is an integer to make the waves move 1 period within 2
    %seconds.
    r=y+q*120*.8^(i-1);+3^(i-1);
    v=[
    x' r';
    c 0;
    0 0];
    %making the ocean blue;
    fill(v(:,1),v(:,2),i/18*[.1 .7 1],'EdgeColor','n');
end
%Now we can use emojis to make Matzilla: Dino + triangles.
%Move them with the variable "f" forward and backward.
if 24>=f
    ht=text(380+f,670+f,'🦖','color','black','FontSize',60);
    ht.Rotation = -55
    it=text(850+f,609+f,'▲','color','black','FontSize',20);
    it.Rotation = -55
    jt=text(975+f,579+f,'▲','color','black','FontSize',30);
    jt.Rotation = -65
    kt=text(1040+f,525+f,'▲','color','black','FontSize',30);
    kt.Rotation = -65
else
    ht=text(405+(25-f),695+(25-f),'🦖','color','black','FontSize',60);
    ht.Rotation = -55
    it=text(875+(25-f),634+(25-f),'▲','color','black','FontSize',20);
    it.Rotation = -55
    jt=text(1000+(25-f),604+(25-f),'▲','color','black','FontSize',30);
    jt.Rotation = -65
    kt=text(1065+(25-f),550+(25-f),'▲','color','black','FontSize',30);
    kt.Rotation = -65
end
%Ocean (2 part): we have more layers here [9-7] (in front of Matzilla).
for i=9:-1:7
    y=i/11*d;
    a=10*m^(i-1);
    u=c*(1-(i-1)/8);
    x=linspace(0,c,n);
    p=y/d*4*pi;
    t=x*2*pi/u;
    q=sin(f/4+.3*t)+sin(f/8+.2*t);
    r=y+q*120*.8^(i-1);+3^(i-1);
    v=[
    x' r';
    c 0;
    0 0];
    fill(v(:,1),v(:,2),i/18*[.1 .7 1],'EdgeColor','n');
end
%final adjustments for plotting. Hope you like it. ;)
axis off;
ylim([250,n])
end
Jr大佬的一系列字符够成的画:
Jr / NOOO!!! Matzilla hit us!!
https://ww2.mathworks.cn/matlabcentral/communitycontests/contests/6/entries/14302
%well, I made this just by changing (again) my previous code. The
%process is the same:
%   1. We make layers of the blue sky;
%   2. We add emojis up and down (it's funny to control the movement of them)
%   3. We make layers of green mountains;
function drawframe(f)
    c=1200;
    d=700;
    n=800;
    m=.37;
    hold on;
%Making the sky:
for i=15:-1:13
    y=i/11*d;
    a=20*m^(i-1);
    u=c*(1-(i-1)/8);
    x=linspace(0,c,n);
    p=y/d*4*pi;
    t=x*2*pi/u;
    q=sin(f/4+.3*t)+sin(f/8+.2*t);
    r=y+q+cumsum(sqrt(a)*randn(1,n));+3.2^(i-1);
    v=[
    x' r';
    c 0;
    0 0];
    fill(v(:,1),v(:,2),i/18*[.7 .7 .7],'EdgeColor','n');
end
%Using emojis and moving them with our parameter "f" as well:
ht=text(380-(f*5),670-(f*5),'🛩','color','black','FontSize',40);
if f>=38
    ht=text(50,500,'🔥','color','r','FontSize',80);
end
hc=text(10+f*2,660,'☁','color','w','FontSize',20);
ic=text(450+f*4,780,'☁','color','w','FontSize',30);
kc=text(850+f*3.5,610,'☁','color','w','FontSize',50);
%Making the mountains
for i=9:-1:4
    y=i/11*d;
    a=170*m^(i-1);
    u=c*(1-(i-1)/8);
    x=linspace(0,c,n);
    p=y/d*4*pi;
    t=x*2*pi/u;
    q=sin(f/2+.3*t)+sin(f/8+.2*t);
    r=y+q+cumsum(sqrt(a)*randn(1,n));+3.2^(i-1); %unlike the previous code,
    %here there is a random/noisy component to make it look like grass/earth
    v=[
    x' r';
    c 0;
    0 0];
    fill(v(:,1),v(:,2),i/18*[216 171 100]/255,'EdgeColor','n');
end
%final adjustments for plotting.
axis off;
ylim([200,n])
end
以下就直接放代码不咋说明啦:
Adam Danz / Rainy window
https://ww2.mathworks.cn/matlabcentral/communitycontests/contests/6/entries/14367

function drawframe(f)
persistent T dropSzFcn dropFcn
if f==1 || isempty(T)
    rng(359,'twister')      % set the random number generator for reproducibility
    nc=50;                  % number of colors in colormap
    cmap=gray(nc);          % used to set the background color
    axes(Position=[0 0 1 1]) % example axes to full size of figure
    colormap(cmap(1:ceil(0.4*nc),:)) % cut out the upper (lighter) part of the colormap
    hold on
    % background image
    bx=1:50;              % set size of the square image
    by=exp(-(((bx-6).^2)/(2*8.^2))); % gaussian
    I=imagesc([0,1],[0,1],by'+0*bx);
    axis tight equal off
    % add distant lights
    ncl=99;               % number of colors for the lights
    LC=hot(ncl);          % light colors
    nl=30;                % number of lights
    r=@()rand(nl,1);      % generate nlx1 random numbers 0:1
    b=bubblechart(r(),r(),r(),LC(randi(ncl,nl,1),:),MarkerEdgeColor='n'); % street lights
    figSz=get(gcf,'Pos');
    bubblesize([3,0.1*max(figSz(3:4))]) % Scale light size to figure size
    % blur the image
    % the background and lights are flattened into a single image and
    % blurred.
    f=getframe;
    b.delete
    I.CData=imfilter(flipud(f.cdata),ones(10)/100);
    % Add rain drops
    nd=99;                % number of drops
    T=table();            % use a table to store some variables
    T.obj=gobjects(nd,1); % droplet surf objects
    T.dropSz=nan(nd,1);   % scale factor for drop size
    dropSzFcn=@()max(min(randg(1),6),.8)/150;  % Drop size, truncated gamma distribution
    [x,y,z]=sphere(20);   % use a larger number for smoother raindrop surfaces, but slower.
    dropFcn=@(sz)surf(sz*x+rand,2*sz*y+rand*1.1,sz*max(z,0),... % function to create raindrops
        FaceCo='w',FaceAl=.2,EdgeCo='n',...
        SpecularSt=1,SpecularExp=2, ...
        DiffuseSt=1,AmbientSt=.1);
    for i=1:nd % Create the rain drops
        T.dropSz(i)=dropSzFcn();
        T.obj(i)=dropFcn(T.dropSz(i));
    end
    light(Po=[0.5 -1 0.1]); % rain drops should be dark on top and light on bottom
    xlim([0,1])
    ylim([0,1])
    set(gcf,Color='k')
end
% Add new drops
n=5;                     % number of rain drops to add
T2=table();              % create a temporary table to store variables
T2.obj=gobjects(n,1);    % droplet surf objects
T2.dropSz=nan(n,1);      % scale factor for drop size
for k=1:n                % add more raindrops
    T2.dropSz(k)=dropSzFcn();
    T2.obj(k)=dropFcn(T2.dropSz(k));
end
T=[T;T2];
% Determine which rain drops are falling by drop size (larger ones fall)
% figure(); histogram(T.dropSz)  % for decision making
T.isFalling=T.dropSz > 0.01; % Reduce threshold to increase the number of falling rain drops
% The amount of downward displacement is determined by drop size
for j=find(T.isFalling')
    T.obj(j).YData=T.obj(j).YData-T.dropSz(j); % shift downward
end
% Determine if any drops overlap
% Reduce the computational expense by assuming drops are rectangular and
% useing MATLAB's rectint, though it contains 1 extra step that isn't needed
% (computing area of overlap) but it's still fast and clean.
[mmy(:,1),mmy(:,2)]=arrayfun(@(h)bounds(h.YData,'all'),T.obj); % [min,max] for ydata
[mmx(:,1),mmx(:,2)]=arrayfun(@(h)bounds(h.XData,'all'),T.obj); % [min,max] for xdata
% Covert the drop's x and y data to rectangular vectors [x,y,width,height]
T.xywh=[mmx(:,1),mmy(:,1),diff(mmx,1,2),diff(mmy,1,2)];
% If a water drop is off the figure, remove it
T.isoff=mmy(:,2) < 0;
T.obj(T.isoff).delete;
T(T.isoff,:)=[];
% Compare all pairs of drops without duplicate comparisons
objPairs=nchoosek(1:height(T),2);
overlap=false(height(objPairs),1);
for q=1:height(objPairs)
    % Because we're treating the raindrops as rectangles, there will be
    % falsely labeled overlaps in the corner of the rectangles. To reduce
    % the number of false positives, we'll require the overlap to be at least
    % 21.5% of the smallest raindrop since a circle consumes 78.5% of its
    % bounding box.
    minArea=min(prod(T.xywh(objPairs(q,:),[3,4]),2))*(1-.785);
    overlap(q)=rectint(T.xywh(objPairs(q,1),:),T.xywh(objPairs(q,2),:)) > minArea;
    if overlap(q) && all(isvalid(T.obj(objPairs(q,:))))
        % highlight the overlapping raindrops, for troubleshooting
        % set(T.obj(objPairs(q,:)),'facecolor','m','AmbientStrength',1 )
        % Which drop has the smallest width?
        [~,minidx]=min(T.xywh(objPairs(q,:),3));
        % The smaller drop is absorbed (removed)
        T.obj(objPairs(q,minidx),:).delete;
        % Elongate the surviving droplet
        maxidx=abs(3*(minidx-1)-2);  % converts 2 to 1 or 1 to 2;
        yd=T.obj(objPairs(q,maxidx)).YData;
        ydmu=mean(yd,'all');
        ef=1.05;  % elongation factor
        T.obj(objPairs(q,maxidx)).YData=(ef*(yd-ydmu))+ydmu;
        % Update dropSz
        T.dropSz(objPairs(q,maxidx))=ef*T.dropSz(objPairs(q,maxidx));
        % Make the elongaged drops narrower
        xd=T.obj(objPairs(q,maxidx)).XData;
        xdmu=mean(xd,'all');
        T.obj(objPairs(q,maxidx)).XData=(1/ef*(xd-xdmu))+xdmu;
    end
end
% Remove rows of the table that belong to deleted rain drops
T(:,3:end)=[];  % Remove the columns that will be recomputed on next iteration
T(~isvalid(T.obj),:)=[];
end
Eric Ludlam / Lonely Lighthouse
https://ww2.mathworks.cn/matlabcentral/communitycontests/contests/6/entries/14022

function drawframe(f)
    % shortenners
    r=@rand;
    ls=@linspace;
    % Make all our circles the same
    nv=300;
    th=ls(0,2,nv);
    X=cospi(th);
    Y=sinpi(th);
    Z=ones(1,nv);
    % Stuff in front needs to be pushed ahead of the backdrop images
    FZ=2;

    if f==1
        set(gca,'position',[0 0 1 1],'clipping','off');
        hold on
        imagesc([-1 1],[1.5 0],(1:256)');
        colormap(abyss.^2) % square to get more black, but it made the blue niftier too

        %% Starry sky
        % do first due to newplot
        N=120;
        si=r(1,N); % Size and Color are related, so use same random #s
        scatter(r(1,N)*2-1,r(1,N)*1.3+.1,(si+.2)*40,(si*.5+.5)'.*[1 1 1],'Marker','.');
        %% Lighthouse
        lh_r=[.16 .1 .15 .15 .05 .05 .14 0]'*.5;
        lh_y=[.1 .78 .78 .82 .82 .89 .89 1]';
        lh_c=[.5 .5 .3 .3 1 1 .3 .3]'; % shade of gray means I only need 1 # per profile ring
        HC=ones(1,nv,3).*lh_c; % convert lh_c to RGB color
        surface(X.*lh_r,Z.*lh_y,Y.*lh_r+FZ,HC,'FaceC','f','EdgeC','n');
        % Make the light part brighter by setting FaceLighting to none
        lhlr=[.1 .1]'*.5;
        surface(X.*lhlr,Z.*[.8 .9]',Y.*lhlr+FZ,'FaceC','w','EdgeC','n','FaceL','n');

        %% The lighthouse sits on a rock
        N=120;
        RN=12;
        % This computes random points on a half sphere.
        r_th=r(1,N)*2;
        u=r(1,N)*2-1;
        rth=ls(0,2,RN+1);
        rth(end)=[];
        pts=[0 cospi(r_th).*sqrt(1-u.^2) cospi(rth)
             0 sinpi(r_th).*sqrt(1-u.^2) sinpi(rth)
             0 abs(u) zeros(1,RN)]';
        % Form the patch around the random pts using convex hull
        lf=convhulln(pts);
        % Move pts in/out to make it bumpy and scale into our world.
        % You have to make it bumpy after convex hull b/c that ignores pts 'inside' the hull.
        D=(.9+r(1,N+RN+1)*.3)';
        lv=pts.*D.*[.5 .11 .3];
        % Adjust colors to be darker in depths.
        I=[.55 .41 .36];% brown
        C=hsv2rgb(rgb2hsv(I).*[1 1 .5]);
        q=I-C;

        patch('Faces',lf,'Vertices',lv(:,[1 3 2])+[0 0 FZ],'FaceC','i', ...
              'EdgeC','none','FaceVertexCData',rescale(D)*q+C,'FaceL','g');
        %% The light beam (fill in later)
        patch('tag','LB','vertices',[],'faces',[],...
              'edgec','n','facec','w','facea','i','facel','n')
        %% Reflection off the ocean (fill in later)
        image([-1 1],[-.5 .02],rand(200),'tag','O');

        %% Nicify axes
        material([.6 .6 .8 2 .8])
        axis([-1 1 -.5 1.5],'off');
        daspect([1 1 1])
        light('pos',[0 0 0],'color',[.5 .5 .6 ],'tag','LBO');
    end
    % Find all our objects from initial creation
    LB=findobj('tag','LB');
    LBO=findobj('tag','LBO');
    O=findobj('tag','O');
    %% Create the light-beam eminating from the lighthouse
    A=interp1([1 49],[0 2],f); % Angle to point light beam for this frame
    % Create a mask (pts) to project through.
    % Mask is a circle in cylindrical coords with a wavy radius (defined by wf)
    wf=cospi(th*50)*.003;
    os=X*.15+A;
    mx=cospi(os).*(.08+wf);
    my=Y*.03+.85;
    mz=sinpi(os).*(.07+wf);
    pts=[mx
         my
         mz]';
    % Light posn for projection
    L=[0 .85 0];

    % Set posn of our actual light so the tower/rock is illuminated by
    % the light bean reflecting off the air / virtual fog
    set(LBO,'Pos', [ cospi(A) L(2) sinpi(A) ]);

    %% Extrude a cone of light through the mask
    % Compute normalized vectors away from light through each vertex
    vv=(pts-L)./vecnorm(pts-L,2,2);
    % Compute length and alpha based on angle to camera.
    % The idea is that the more 'volume' of light you see through the more particles
    % in the air it reflects off.  Whe light points at you, simulate by less transparency.
    % when pointing at the side, more transparency.

    % To do it right, we'd use dot product, but we can estimate in less
    % characters using sin instead since we're pointing flat out in Z
    %ctr=[mx(2) my(2) mz(2)]; % center
    %cp=[0 .5 10];
    S=sinpi(A); %dot(ctr,dn(mean(pts,1),cp),2);
    ce=vv*(max(S,0)^2*2+1);
    % Extrude
    ed=mod((0:(nv-1))'+[0 1],nv)+1;
    R=1:nv;%size(ed,1)
    c1=[ed(R,[2 1 2])+[0 0 nv];% edges connecting top/bottom
        ed(R,[1 1 2])+[0 nv nv]];
    f=[c1
       c1+nv
       c1+nv*2];
    v=[pts
       pts+ce*.3
       pts+ce*.5
       pts+ce];
    av=[S .9 .7 0];
    M=@(a)repmat(a,nv,1);
    a=[ M(av(1))
        M(av(2))
        M(av(3))
        M(av(4)) ] * ...
        rescale(S,.2,.8,'inputmax',1,'inputmin',-.8)^2;
    set(LB,'vertices',v+[0 0 FZ],'faces',f,'facevertexalphadata',a);
    %% Reflect the upper half into the ocean
    f=getframe(gca);
    % Darken it by passing through hsv and lowering V
    % Use guass filter to blur slightly so it doesn't look so computery
    O.CData=hsv2rgb(rgb2hsv(imgaussfilt(f.cdata(1:end-110,:,:),1)).*reshape([1 1 .7],1,1,3));
end
Dhimas Mahardika Sanggung Utara / A 2D Candle Equation
https://ww2.mathworks.cn/matlabcentral/communitycontests/contests/6/entries/14272

function drawframe(f)
h = linspace(0,100*pi,48);
syms x y
eqn = ((2*x^2)- (((sin(3*y^0.5))^2)/15) - 0.12*x*sin(3*y+h(f)) + y^200 +0.007)*(abs(5*x+y+1.6)+abs(5*x-y-1.6)-3)*(abs(15*x+0.75*(y-0.033))+abs(15*x-0.75*(y-0.033))-0.2)   == 0;
fimplicit(eqn,[-1,1,-3.3,1.2], MeshDensity=500,LineStyle="-");
axis equal
end
hiahiahia我写的一个超简单的小人
Zhaoxu Liu / slandarer / Math-Matchstick Man
https://ww2.mathworks.cn/matlabcentral/communitycontests/contests/6/entries/14012

function drawframe(n)
persistent txtHdl armHdl
if n==1
ax=gca;
ax.DataAspectRatio=[1,1,1];
ax.XLim=[-5,5];
ax.YLim=[-5,5];
ax.XColor='none';
ax.YColor='none';
hold on
txtHdl = text(0,3.5,'y = x','FontSize',20,'FontName','Times New Roman','FontWeight','bold',...
    'HorizontalAlignment','center','Color',[0,.25,.45]);
armHdl = plot([-pi,pi],[-pi,pi],'Color',[.8,0,0],'LineWidth',3);
t=linspace(0,2*pi,200);
fill(cos(t),sin(t)+1,[1,1,1],'EdgeColor',[.4,.4,1],'LineWidth',3)
plot(cos(t(101:200)).*.5,sin(t(101:200)).*.5+1,'Color',[.4,.4,1],'LineWidth',3)
fill(cos(t).*.8,sin(t).*1.4-1.4,[1,1,1],'EdgeColor',[.4,.4,1],'LineWidth',3)
plot([-0.38,-0.97,-1.81],[-2.64,-4.50,-4.76],'Color',[.4,.4,1],'LineWidth',3)
plot([ 0.38, 0.97, 1.81],[-2.64,-4.50,-4.76],'Color',[.4,.4,1],'LineWidth',3)
plot([-0.15,-0.42],[ 1.98, 2.15],'Color',[.4,.4,1],'LineWidth',3)
scatter([-0.2,0.2],[1.2,1.2],25,[.4,.4,1],'filled','o')
end
switch true
    case n>=7  && n<=12
        armHdl.XData  = [-pi,0, pi];
        armHdl.YData  = [ pi,0, pi];
        txtHdl.String = 'y = |x|';
    case n>=13 && n<=18
        armHdl.XData  = [-pi,0, pi];
        armHdl.YData  = [-pi,0,-pi];
        txtHdl.String = 'y = - |x|';
    case n>=19 && n<=24
        armHdl.XData  =  -2:.02:2;
        armHdl.YData  = (-2:.02:2).^2;
        txtHdl.String = 'y = x^2';
    case n>=25 && n<=30
        armHdl.XData  =  -2:.02:2;
        armHdl.YData  = (-2:.02:2).^3;
        txtHdl.String = 'y = x^3';
    case n>=31 && n<=36
        armHdl.XData  =  -pi:.01:pi;
        armHdl.YData  = sin(-pi:.01:pi);
        txtHdl.String = 'y = sin(x)';
    case n>=37 && n<=42
        armHdl.XData  =  -2.5:.02:2.5;
        armHdl.YData  =  2.^(-2.5:.02:2.5)-1;
        txtHdl.String = 'y = 2^x - 1';
    case n>=43 && n<=48
        t=linspace(0,2*pi,200);
        armHdl.XData  =  cos(t).*2;
        armHdl.YData  =  sin(t).*2+2;
        txtHdl.String = 'x^2 + (y-2)^2 = 4';
end
end
Eric Ludlam / Snake Toy
https://ww2.mathworks.cn/matlabcentral/communitycontests/contests/6/entries/14042

function drawframe(f)
    %% Core Matrices
    numblock=24;
    v = [ -1 -1 -1 ; 1 -1 -1 ; -1  1 -1 ; -1  1  1 ; -1 -1  1 ; 1 -1  1 ];
    pf = [ 1 2 3 nan; 5 6 4 nan; 1 2 6 5; 1 5 4 3; 3 4 6 2 ];
    clr = hsv(numblock);

    % Left in a few options for anyone interested in remixing other shapes
    % and colors
    %n = pi/2;
    shapes = [ 1 0 0 0 0 0 1 0 0 0 0 1 0 0 0 0 0 0 1 0 0 0 0 1 % box
               %0 0 .5 -.5 .5 0 1 0 -.5 .5 -.5 0 1 0 .5 -.5 .5 0 1 0 -.5 .5 -.5 0 % fluer
               %0 0 1 1 0 .5 -.5 1 .5 .5 -.5 -.5 1 .5 .5 -.5 -.5 1 .5 .5 -.5 -.5 1 .5 % bowl
               %0 1 0 0 0 1 1 0 1 0 0 1 0 1 1 0 0 0 1 0 1 1 0 1 % dog
               %0 1 0 0 0 0 0 1 1 0 .5 0 1 1 0 1 1 0 -.5 0 1 1 0 0 % chicken
               %0 1 0 0 0 1 1 0 0 0 0 1 0 0 1 0 0 0 0 1 1 0 0 0 % filled box
               %0 1 -n 0 0 0 1 n n 0 1 0 0 0 n 0 1 1 0 1 1 0 n 0 % cobra
               0 .5 -.5 -.5 .5 -.5 .5 .5 -.5 .5 -.5 -.5 .5 -.5 .5 .5 -.5 .5 -.5 -.5 .5 -.5 .5 .5]; % ball
    % Helper for making transform matrices.
    xform=@(R)makehgtform('axisrotate',[0 1 0],R,'zrotate',pi/2,'yrotate',pi,'translate',[2 0 0]);
    if f==1
        %% Create a neon type snake toy on a black background
        set(gcf,'color','black');
        axes('position',[0 0 1 1],'visible','off')
        P=hgtransform('Parent',gca,'Matrix',makehgtform('xrotate',pi*.5,'zrotate',pi*-.8));
        for i = 1:numblock
            P = hgtransform('Parent',P,'Matrix',xform(shapes(end,i)*pi));
            patch('Parent',P, 'Vertices', v, 'Faces', pf, 'FaceColor',clr(i,:),'EdgeColor','none');
            patch('Parent',P, 'Vertices', v*.75, 'Faces', pf(end,:), 'FaceColor','none',...
                  'EdgeColor','w','LineWidth',2);
        end
        %% Axes setup
        daspect([1 1 1]);
        view([10 60]);
        axis tight vis3d off
        camlight
    end
    % Get our stack of transforms.  These will magically be in the right order.
    h=findobj('type','hgtransform')';
    h=h(2:end); % Skip the first one
    % Orbit once around
    view([-f*360/48 20]);
    % Script Steps (transform there and back again)
    if f<=5
        return
    elseif f<=41
        steps=35;
        r=shapes(end,:)*pi; % Start at the Ball shape
        sh=shapes(1,:)*pi; % Go to the box shape
        s=f-6;
        % Transform to next step
        df = (sh-r)/steps;
        arrayfun(@(tx)set(h(tx),'Matrix',xform(r(tx)+df(tx)*s)),1:numblock);
    end
end
Eric Ludlam / Open The Box
https://ww2.mathworks.cn/matlabcentral/communitycontests/contests/6/entries/14167

function drawframe(f)
    % Hack to make a good 1st pic for the gallery
    f = mod(f-2,48)+1;
    %% Polyhedra Data so we can vectorize
    % The following polyhedra data can be downloaded from:
    % https://netlib.org/polyhedra/1
    % And was pre-processed into these compressed arrays.
    %
    % For Positive Integers:
    % Convert to char, and offset into the printable character range by
    % Adding something like '0' to it.
    % 0 is convenient as you know what the first 10 #s are by sight.
    %
    % Decoder
    D=@(v,c)reshape(v-'0',numel(v)/c,c);
    % Faces Array
    F=D('56249<45138;8947;=9:58<>',4);
    % Compress Doubles:
    % Identify # of unique values.  If that # is small, create reference
    % array with the unique values.  Then compress the indices into the
    % array of unique values to recreate the original array
    % If unique values can be represented as colonop easily, do that.
    %
    % Vertex Array
    V=-1.5:0.5:2.5;
    V=V(D('113333555577993513571357353544444444444444',3));
    % Origin of faces so we can offset/fold
    O=-0.5:0.5:1;
    O=O(D('231134233112222222',3));
    % Rotation Axis
    R=-1:1;
    R=R(D('212322221233222222',3));
    % Angle of rotation for the solid
    A=[0
       1.5708];
    A=A(D('122222',1));
    % Children indices for each face to create the graph
    C=D('300060400000500000200000',4);


    %% Fold factor
    % 0 is wide open, 1 is fully solid
    ff=1-(mod(f-1,24)+1)/24; % Fold factor for this segment
    sc=(1-ff)*.8+.2;  % size of the cube inside the unfolding cube.
    %% Build child graph using
    persistent TX1 TX2 R1 R2
    if f==48
        axes('pos',[0 0 1 1],'clipping','off','Proj','p');
        TX = gobjects(0);
        %% Create the object tree using recursive fcn
        R1=hgtransform;
        coi=0;
        rP(1,R1,O(1,:));
        arrayfun(@(fi)xform(TX,ff,fi),1:size(F,1));
        TX1=TX;
        R2=hgtransform;
        coi=size(F,1);
        rP(1,R2,O(1,:));
        arrayfun(@(fi)xform(TX,1,fi),1:size(F,1));
        TX2=TX;

        %% Make axes nice
        set(gcf,'color','w');
        daspect([1 1 1]);
        axis([-1.5 2.5 -1.5 2.5 -1 2],'off')
        view(3)
        camzoom(1.5)
    end
    if f<=24
        % Mode 1
        ff1=ff;
        ff2=1;
        sc1=1;
        sc2=sc;
    else
        % Mode 2
        ff1=1;
        ff2=ff;
        sc1=sc;
        sc2=1;
    end
    % Configure the 2 cubes based on the mode
    arrayfun(@(fi)xform(TX1,ff1,fi),1:size(F,1));
    arrayfun(@(fi)xform(TX2,ff2,fi),1:size(F,1));
    set(findobj(TX1,'type','patch'),'FaceA',ff1^.5);
    set(findobj(TX2,'type','patch'),'FaceA',ff2^.5);
    rt1=(1-sc1)*pi*2;
    rt2=(1-sc2)*pi*2;
    set(R1,'Matrix',makehgtform('scale',sc1,'translate',[0 0 (1-sc1)*3],...
                                'zrotate',rt1,'xrotate',rt1));
    set(R2,'Matrix',makehgtform('scale',sc2,'translate',[0 0 (1-sc2)*3],...
                                'zrotate',pi/2-rt2,'yrotate',rt2));
    %% Helper Fcns
    function xform(tx,ff,fi)
        if A(fi)
            set(tx(fi),'Matrix',makehgtform('axisrotate',R(fi,:), ff*(A(fi)-pi)));
        end
    end

    function rP(fidx, parent, po)
        % Recursive function for creating the tree of gfx objects
        TXT=hgtransform(parent,'Matrix',makehgtform('translate',O(fidx,:)));
        TX(fidx)=hgtransform(TXT);
        % Total offset for vertices is local offset plus parent accum offset
        to=O(fidx,:)+po;
        % Colors to use
        co=orderedcolors('gem12');

        patch(TX(fidx),'Vertices',V(F(fidx,:),:)-to,'Faces',1:size(F,2),...
              'FaceC',co(fidx+coi,:),'EdgeC','w','LineW',2);
        % Create child nodes
        for i=1:size(C,2)
            if C(fidx,i)>0
                rP(C(fidx,i),TX(fidx),to);
            end
        end
    end
end
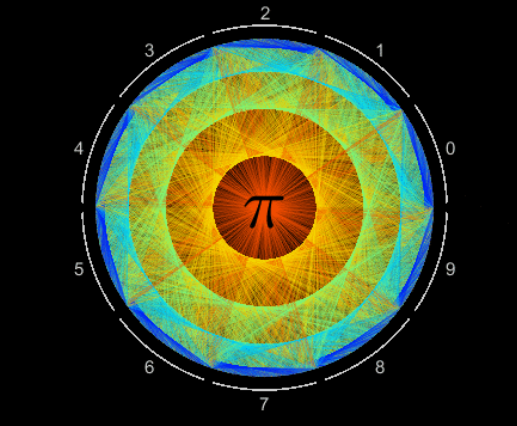
Adam Danz / Pi to 10080 decimal places (polar pi patch)
https://ww2.mathworks.cn/matlabcentral/communitycontests/contests/6/entries/13962
function drawframe(f)
persistent x y d pitxt
nDecimalPlaces = 10080;
if f==1 || isempty(x)
    digits(nDecimalPlaces+2);
    piStr = char(vpa(pi));
    pDigits = piStr(3:end-1)-'0';
    % Assign each digit an angular coordinate based on its value 0:9
    theta = ((0:36:324)+linspace(0,36,nDecimalPlaces+1)')*pi/180;
    ang = theta(sub2ind(size(theta),1:nDecimalPlaces,pDigits+1));
    % Compute the length of each line segment; used to set color
    [x,y] = pol2cart(ang,1);
    [~,~,d] = uniquetol(hypot(diff(x),diff(y)));
    d = [d;d(end)];
    % Plot line segements using the edge property of a Patch object
    % Plot segments using patch so we can control transparency within one
    % graphics object.
    set(gcf, 'Color','k');
    axes(Position = [0 0 1 1]);
    pitxt = plotpitxt(text());
    hold on
    axis equal padded off
    % Labels
    gap = 3; % gap between segments in degrees
    startpt = ((0:36:324) + gap/2)*pi/180; % starting point of each segment, radians
    segAng = (0:0.02:1)'.*((36-gap)*pi/180) + startpt; % angular coordinates for segments
    radius = 1.08;
    [segx,segy] = pol2cart(segAng,radius);
    plot(segx,segy,'-w',LineWidth=1,Color=[.8 .8 .8])
    % add bounds labels
    midAng = ((0:36:324)+18) * pi/180;
    tradius = radius + .08;
    [tx,ty] = pol2cart(midAng,tradius);
    text(tx, ty, string(0:9), ...,
        FontUnits='normalized',...
        FontSize=0.05, ...
        Color=[.8 .8 .8], ...
        HorizontalAlignment='center',...
        VerticalAlignment='middle');
end
nFrames = 48;
frameIdx = [1,find(mod(1:nDecimalPlaces,nDecimalPlaces/nFrames)==0)];
plotalpha = @(parent,x,y,color,alpha) patch(parent,'XData',[x(:);nan],'YData',[y(:);nan],'EdgeColor',color,'EdgeAlpha',alpha);
cmap = jet(10);
for i = frameIdx(f) : frameIdx(f+1)
    if i==nDecimalPlaces
        continue
    end
    plotalpha(gca,x(i:i+1),y(i:i+1),cmap(d(i),:),0.1)
end
pitxt = plotpitxt(pitxt);  % faster than uistack
    function pitxt = plotpitxt(h)
        h.delete
        pitxt = text(0,0.05,'\pi', ...
            HorizontalAlignment='Center', ...
            FontUnits='normalized', ...
            FontSize = 0.2, ...
            Color = 'k');
    end
end
Ned Gulley / Blender
https://ww2.mathworks.cn/matlabcentral/communitycontests/contests/6/entries/13847

function drawframe(f)
    c=(sqrt(5)+1)/2;
    d=2*pi/c;
    alpha = interp1([0 48],[0 48*2*pi/12],f);
    theta = (1:600)*d;
    r = sqrt(theta);

    theta = theta + alpha;

    x = r.*cos(theta);
    y = r.*sin(theta);

    sz = 30*(1-(1:numel(x))/numel(x)) + 1;
    clr = sz;
    scatter(x,y,sz,clr,"filled")
    axis equal off
    axis(45*[-1 1 -1 1])
    set(gcf,Color=0.3*[1 1 1])

end
Eric Ludlam / Foggy Forest
https://ww2.mathworks.cn/matlabcentral/communitycontests/contests/6/entries/14422
function drawframe(f)
E=5; % Size of one forest environment segment
% FogColor Vibe
%FC=[0 0 0];
FC=[1 1 1];
% Abbreviations
J=@rand;
if f==1
set(gcf,'color',FC);
% Random placement of trees. Clump neare middle
n=40;
v1=[rescale(randn(n,1)) J(n,1) rescale(J(n,1),.3,.5)]*E-[E/2 0 0];
% Place a navigable path around zero
M=v1(:,1)<=.1;
v1(M,1)=v1(M,1)-.2;
v1(:,3)=v1(:,3)*.2+.2;
% Duplicate so we are in a repeating donut
vx=[v1;v1+[0 E 0]];
%B=validatecolor(["#A52A2A"
% "#DAA06D"
% "#6E260E"
% "#954535"
% "#7B3F00"
% "#80471c"
% "#814141"
% "#966919"],...
% 'multiple');
%G=validatecolor(["#097969"
% "#228b22"
% "#50C878"
% "#4F7942"
% "#008000"
% "#355E3B"
% "#2AAA8A"
% "#32CD32"],...
% 'multiple');
% How to compress some colors:
%
% % Turn into flints
% U=floor(CLRS*256);
% % Turn that into chars, offset forward by SPACE
% CH=char(U+' ');
%
% % Turn this into decode code
% A="'"+CH+"'";
% disp("([" + join(A,";") + "-' '])/256;");
%
% Compressed version of above:
B=(['ÆJJ';'ûÁ';'ŽF.';'¶eU';'›_ ';'¡g<';'¢aa';'·‰9'-' '])/256;
G=([')™‰';'B¬B';'pé˜';'o™b';' ¡ ';'U~[';'JË«';'RîR']-' ')/256;
for i=1:size(vx,1)
%% Tree Trunks
N=30;
Q=.1; % variation in distance from center
RN=12; % n pts in bounding rings
rv=[.05 .02]; % Radius values
rh=[0 1]; % Radius heights
% Random pts on cylinder
rt=linspace(0,2*pi,RN+1);
rt(end)=[];
T=[J(1,N)*pi*2 rt rt];
h=[rescale(randn(1,N)) ones(1,RN)*rh(1) ones(1,RN)*rh(2)];
% Adjust the radius based on height
R=interp1(rh,rv,h);
pts=[cos(T).*R
sin(T).*R
h]';
% triangulate the perfect cylinder
tf=convhulln(pts);
% Push points in/out with variance of Q
D=(1-Q+J(1,size(pts,1))*(Q*2))';
tv=pts.*(D.*[1 1 0]+[0 0 1]);
mkP(tf,(tv+vx(i,:).*[1 1 0]).*[1 1 vx(i,3)+.1],i,B,D);
%% Tree tops
N=150;
% Alg for random distribution of pts on a sphere.
T=J(1,N)*pi*2;
u=J(1,N)*2-1;
pts=[0 cos(T).*sqrt(1-u.^2)
0 sin(T).*sqrt(1-u.^2)
0 u ]';
% triangulate the perfect sphere
lf=convhulln(pts);
% Push points around to make foliage frumphy
Q=.15;
D=(1-Q+J(1,size(pts,1))*(Q*2))';
lvr=pts.*D;
% Scale down into our world and push up into treetops
ss=vx(i,3)*.15;
llv=lvr.*[.12+ss .12+ss .08+ss]+[0 0 .1];
mkP(lf,llv+vx(i,:),i,G,D);
%% Lumpy Ground!
N=200;
Q=.2;
% coordinates
T=J(1,N)*2;
R=J(1,N)+.05;
x=cospi(T).*R*E;
y=sinpi(T).*R*E*2+E;
% Triangulate the flat disc so we can draw it
pv=[x' y'];
pf=delaunay(pv);
% Variation
D=(J(1,size(pv,1))*Q)';
mkP(pf,[pv+.5 D],4,G,D);
%% Decorate!
set(gca,'position',[0 0 1 1],'vis','off','proj','p');
view(3);
daspect([1 1 1]);
end
end
%% Navigate!
yp=f/48*E;
cp=[0 yp .3];
campos(cp);
camtarget(cp+[0 10 0]);
camva(90);
O=findobj('type','patch');
for i=1:numel(O)
addFog(cp,O(i));
end
%% Shorten patch creation
function mkP(f,v,i,C,D)
% f - faces
% v - vertices
% i - thing index
% C - Array of colors to pick from
% D - distance array
% Create our colors based on D
bC=C(mod(i,size(C,1))+1,:);
C2=hsv2rgb(rgb2hsv(bC).*[.1 1 .3]);
q=bC-C2;
fvc=rescale(D)*q+C2;
% Create patch and stash colors
setappdata(patch('Faces',f,'vertices',v,'EdgeC','n','FaceC','i',...
'FaceVertexCData',fvc),...
'fvc',fvc);
end
function addFog(cp,p)
v1=p.Vertices-cp; % Center around camera position.
clr=getappdata(p,'fvc');
% Compute depth from camera, and rescale as 0-1
B=rescale(hypot(hypot(v1(:,1),v1(:,2)),v1(:,3)),'InputMin',0,'InputMax',5).^.25;
% Treat fog as a semi-transparent white on top of the patch.
% The depth implies the volume of fog you need to see through to get to the vertex.
set(p,'FaceVertexCData',FC.*B+clr.*(1-B))
end
end
完
比赛还有12天才结束,感兴趣的快去参加:
https://ww2.mathworks.cn/matlabcentral/communitycontests/contests/6/entries