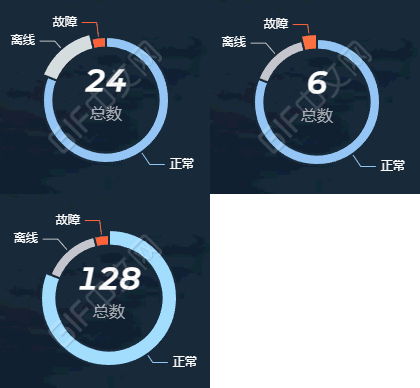
createEcharts() {
  let chartDom = this.$refs.echarts
  this.Echarts = echarts.init(chartDom)

  let option = {
    title: {
      text: '128', //主标题文本
      subtext: '总数', //副标题文本
      left: 'center',
      top: '32%',
      textStyle: {
        fontFamily: 'Montserrat-MediumItalic',
        fontSize: 30,
        color: '#fff',
        align: 'center',
      },
      subtextStyle: {
        fontFamily: 'Source Han Sans CN',
        fontSize: 16,
        color: '#AEAEB2',
      },
    },
    series: [
      {
        type: 'pie',
        center: ['50%', '50%'],
        radius: ['50%', '60%'],
        label: {
          color: '#fff',
        },
        itemStyle: {
          borderColor: '#1b2b3c',
          borderWidth: 2,
        },
        data: [
          { value: 128, name: '正常', itemStyle: { color: '#92c7f7' } },
          { value: 24, name: '离线', itemStyle: { color: '#c0c5c9' } },
          { value: 6, name: '故障', itemStyle: { color: '#ff673b' } },
        ],
      },
    ],
  }

  this.Echarts.on('mouseover', (params) => {
    // 获取高亮的数据项的值
    let highlightedValue = params.data.value

    // 更新饼图标题
    this.Echarts.setOption({
      title: {
        text: highlightedValue,
      },
    })
  })

  option && this.Echarts.setOption(option)
},
