一、介绍
我们将使用轮廓分数和一些距离度量来执行时间序列聚类实验,同时利用直观的可视化,让我们看看下面的时间序列:
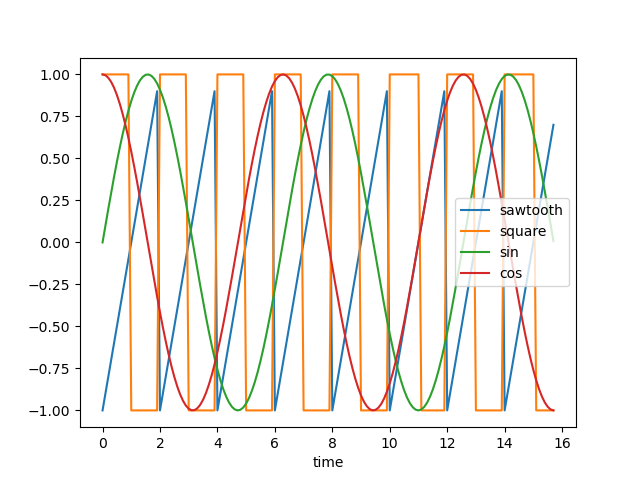
这些可以被视为具有正弦、余弦、方波和锯齿波的四种不同的周期性时间序列
如果我们添加随机噪声和距原点的距离来沿 y 轴移动序列并将它们随机化以使它们几乎难以辨别,则如下所示 - 现在很难将时间序列列分组为簇:

上面的图表是使用以下脚本创建的:
# Import necessary libraries
import os
import pandas as pd
import numpy as np

# Import random module with an alias 'rand'
import random as rand
from scipy import signal

# Import the matplotlib library for plotting
import matplotlib.pyplot as plt

# Generate an array 'x' ranging from 0 to 5*pi with a step of 0.1
x = np.arange(0, 5*np.pi, 0.1)

# Generate square, sawtooth, sin, and cos waves based on 'x'
y_square = signal.square(np.pi * x)
y_sawtooth = signal.sawtooth(np.pi * x)
y_sin = np.sin(x)
y_cos = np.cos(x)

# Create a DataFrame 'df_waves' to store the waveforms
df_waves = pd.DataFrame([x, y_sawtooth, y_square, y_sin, y_cos]).transpose()

# Rename the columns of the DataFrame for clarity
df_waves = df_waves.rename(columns={0: 'time',
                                    1: 'sawtooth',
                                    2: 'square',
                                    3: 'sin',
                                    4: 'cos'})

# Plot the original waveforms against time
df_waves.plot(x='time', legend=False)
plt.show()

# Add noise to the waveforms and plot them again
for col in df_waves.columns:
    if col != 'time':
        for i in range(1, 10):
            # Add noise to each waveform based on 'i' and a random value
            df_waves['{}_{}'.format(col, i)] = df_waves[col].apply(lambda x: x + i + rand.random() * 0.25 * i)

# Plot the waveforms with added noise against time
df_waves.plot(x='time', legend=False)
plt.show()
二、问题陈述
现在我们需要决定聚类的基础。可能有两种方法:
- 我们希望将更接近一组的波形分组——欧氏距离较低的波形将被组合在一起。
- 我们想要对看起来相似的波形进行分组 - 它们具有相似的形状,但欧氏距离可能不低
2.1 距离度量
一般来说,我们希望根据形状 (2) 对时间序列进行分组,对于这样的聚类,我们可能希望使用距离度量,例如相关性,它们或多或少独立于波形的线性移位。
让我们检查一下具有上述定义的噪声的波形对之间的欧氏距离和相关性的热图:
使用欧几里德距离对波形进行分组很困难,因为我们可以看到任何波形对组中的模式都保持相似,例如平方和余弦之间的相关形状与平方和平方非常相似,除了对角线元素之外
我们可以看到,使用相关热图可以轻松地将所有形状组合在一起 - 因为相似的波形具有非常高的相关性(sin-sin 对),而 sin 和 cos 等对的相关性几乎为零。
2.2 剪影分数
分析上面显示的热图并根据高相关性分配组看起来是一个好主意,但是我们如何定义相关性阈值,高于该阈值我们应该对时间序列进行分组。看起来像是一个迭代过程,容易出现错误并且需要大量的手动工作。
在这种情况下,我们可以利用 Silhouette Score 为执行的聚类分配一个分数。我们的目标是最大化剪影得分。Silhouette 分数是如何工作的——尽管这可能需要单独讨论——让我们回顾一下高级定义
- 轮廓得分计算:单个数据点的轮廓得分是通过将其与其自身簇中的点的相似度(称为“a”的度量)与其与该点不属于的最近簇中的点的相似度进行比较来计算的(称为“b”的措施)。该点的轮廓得分由 (b — a) / max(a, b) 给出。
- a(内聚性):衡量该点与其自身簇中其他点的相似程度。较高的“a”表示该点在其簇内的位置很好。
- b(分离):测量点与最近邻簇中的点的不同程度。较低的“b”表示该点远离最近簇中的点。
- 轮廓分数的范围从 -1 到 1,其中高值(接近 1)表示该点聚类良好,低值(接近 -1)表示该点可能位于错误的聚类中。
2.解读剪影分数:
- 所有点的平均轮廓得分较高(接近 1)表明聚类定义明确且不同。
- 较低或负的平均轮廓分数(接近 -1)表明重叠或形成不良的簇。
- 0 左右的分数表示该点位于两个簇之间的边界上。
2.3 聚类
现在让我们利用上面计算的两个版本的距离度量,并尝试在利用 Silhouette 分数的同时对时间序列进行分组。测试结果更容易,因为我们已经知道存在四种不同的波形,因此理想情况下应该有四个簇。
欧氏距离
############ reduing components on eucl distance metrics for visualisation #######
pca = decomposition.PCA(n_components=2)
pca.fit(df_man_dist_euc)
df_fc_cleaned_reduced_euc = pd.DataFrame(pca.transform(df_man_dist_euc).transpose(),
                                              index = ['PC_1','PC_2'],
                                              columns = df_man_dist_euc.transpose().columns)

index = 0
range_n_clusters = [2, 3, 4, 5, 6, 7, 8]

# Iterate over different cluster numbers
for n_clusters in range_n_clusters:
    # Create a subplot with silhouette plot and cluster visualization
    fig, (ax1, ax2) = plt.subplots(1, 2)
    fig.set_size_inches(15, 7)

    # Set the x and y axis limits for the silhouette plot
    ax1.set_xlim([-0.1, 1])
    ax1.set_ylim([0, len(df_man_dist_euc) + (n_clusters + 1) * 10])

    # Initialize the KMeans clusterer with n_clusters and random seed
    clusterer = KMeans(n_clusters=n_clusters, n_init="auto", random_state=10)
    cluster_labels = clusterer.fit_predict(df_man_dist_euc)

    # Calculate silhouette score for the current cluster configuration
    silhouette_avg = silhouette_score(df_man_dist_euc, cluster_labels)
    print("For n_clusters =", n_clusters, "The average silhouette_score is :", silhouette_avg)
    sil_score_results.loc[index, ['number_of_clusters', 'Euclidean']] = [n_clusters, silhouette_avg]
    index += 1

    # Calculate silhouette values for each sample
    sample_silhouette_values = silhouette_samples(df_man_dist_euc, cluster_labels)

    y_lower = 10

    # Plot the silhouette plot
    for i in range(n_clusters):
        # Aggregate silhouette scores for samples in the cluster and sort them
        ith_cluster_silhouette_values = sample_silhouette_values[cluster_labels == i]
        ith_cluster_silhouette_values.sort()

        # Set the y_upper value for the silhouette plot
        size_cluster_i = ith_cluster_silhouette_values.shape[0]
        y_upper = y_lower + size_cluster_i

        color = cm.nipy_spectral(float(i) / n_clusters)

        # Fill silhouette plot for the current cluster
        ax1.fill_betweenx(np.arange(y_lower, y_upper), 0, ith_cluster_silhouette_values, facecolor=color, edgecolor=color, alpha=0.7)

        # Label the silhouette plot with cluster numbers
        ax1.text(-0.05, y_lower + 0.5 * size_cluster_i, str(i))
        y_lower = y_upper + 10  # Update y_lower for the next plot

    # Set labels and title for the silhouette plot
    ax1.set_title("The silhouette plot for the various clusters.")
    ax1.set_xlabel("The silhouette coefficient values")
    ax1.set_ylabel("Cluster label")

    # Add vertical line for the average silhouette score
    ax1.axvline(x=silhouette_avg, color="red", linestyle="--")
    ax1.set_yticks([])  # Clear the yaxis labels / ticks
    ax1.set_xticks([-0.1, 0, 0.2, 0.4, 0.6, 0.8, 1])

    # Plot the actual clusters
    colors = cm.nipy_spectral(cluster_labels.astype(float) / n_clusters)
    ax2.scatter(df_fc_cleaned_reduced_euc.transpose().iloc[:, 0], df_fc_cleaned_reduced_euc.transpose().iloc[:, 1],
                marker=".", s=30, lw=0, alpha=0.7, c=colors, edgecolor="k")

    # Label the clusters and cluster centers
    centers = clusterer.cluster_centers_
    ax2.scatter(centers[:, 0], centers[:, 1], marker="o", c="white", alpha=1, s=200, edgecolor="k")

    for i, c in enumerate(centers):
        ax2.scatter(c[0], c[1], marker="$%d$" % i, alpha=1, s=50, edgecolor="k")

    # Set labels and title for the cluster visualization
    ax2.set_title("The visualization of the clustered data.")
    ax2.set_xlabel("Feature space for the 1st feature")
    ax2.set_ylabel("Feature space for the 2nd feature")

    # Set the super title for the whole plot
    plt.suptitle("Silhouette analysis for KMeans clustering on sample data with n_clusters = %d" % n_clusters,
                 fontsize=14, fontweight="bold")

plt.savefig('sil_score_eucl.png')
plt.show()


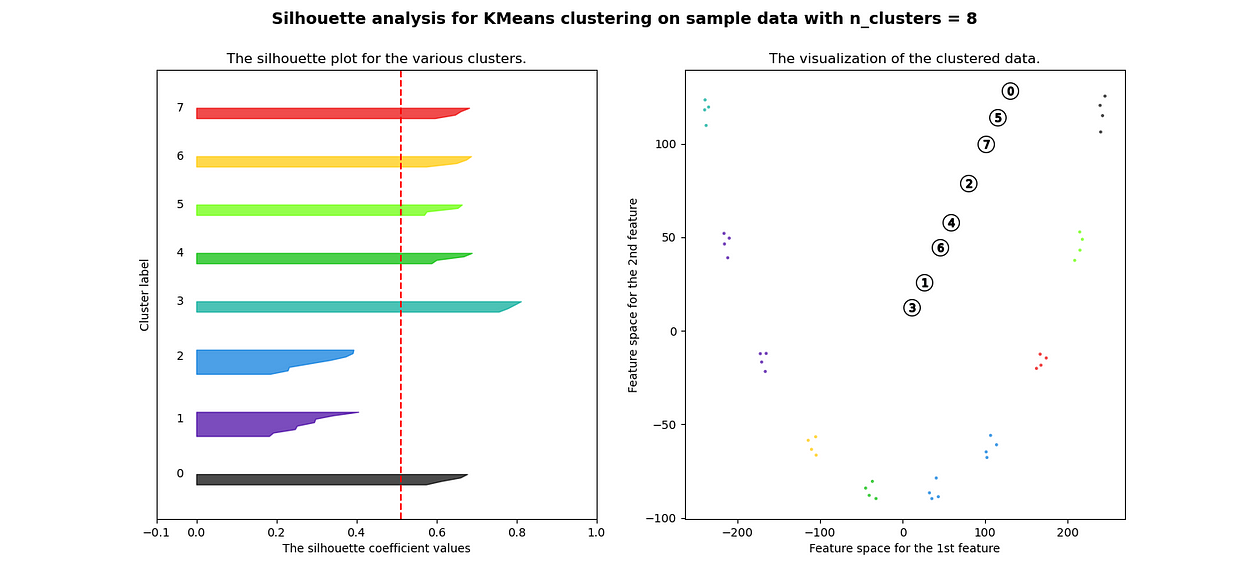
很明显,簇都是混合在一起的,并且不能为任何数量的簇提供良好的轮廓分数。这符合我们基于欧几里得距离热图的初步评估的预期
三、相关性
############ reduing components on eucl distance metrics for visualisation #######
pca = decomposition.PCA(n_components=2)
pca.fit(df_man_dist_corr)
df_fc_cleaned_reduced_corr = pd.DataFrame(pca.transform(df_man_dist_corr).transpose(),
                                              index = ['PC_1','PC_2'],
                                              columns = df_man_dist_corr.transpose().columns)

index=0
range_n_clusters = [2,3,4,5,6,7,8]
for n_clusters in range_n_clusters:
    # Create a subplot with 1 row and 2 columns
    fig, (ax1, ax2) = plt.subplots(1, 2)
    fig.set_size_inches(15, 7)

    # The 1st subplot is the silhouette plot
    # The silhouette coefficient can range from -1, 1 but in this example all
    # lie within [-0.1, 1]
    ax1.set_xlim([-0.1, 1])
    # The (n_clusters+1)*10 is for inserting blank space between silhouette
    # plots of individual clusters, to demarcate them clearly.
    ax1.set_ylim([0, len(df_man_dist_corr) + (n_clusters + 1) * 10])

    # Initialize the clusterer with n_clusters value and a random generator
    # seed of 10 for reproducibility.
    clusterer = KMeans(n_clusters=n_clusters, n_init="auto", random_state=10)
    cluster_labels = clusterer.fit_predict(df_man_dist_corr)

    # The silhouette_score gives the average value for all the samples.
    # This gives a perspective into the density and separation of the formed
    # clusters
    silhouette_avg = silhouette_score(df_man_dist_corr, cluster_labels)
    print(
        "For n_clusters =",
        n_clusters,
        "The average silhouette_score is :",
        silhouette_avg,
    )
    sil_score_results.loc[index,['number_of_clusters','corrlidean']] = [n_clusters,silhouette_avg]
    index=index+1

    sample_silhouette_values = silhouette_samples(df_man_dist_corr, cluster_labels)

    y_lower = 10
    for i in range(n_clusters):
        # Aggregate the silhouette scores for samples belonging to
        # cluster i, and sort them
        ith_cluster_silhouette_values = sample_silhouette_values[cluster_labels == i]

        ith_cluster_silhouette_values.sort()

        size_cluster_i = ith_cluster_silhouette_values.shape[0]
        y_upper = y_lower + size_cluster_i

        color = cm.nipy_spectral(float(i) / n_clusters)
        ax1.fill_betweenx(
            np.arange(y_lower, y_upper),
            0,
            ith_cluster_silhouette_values,
            facecolor=color,
            edgecolor=color,
            alpha=0.7,
        )

        # Label the silhouette plots with their cluster numbers at the middle
        ax1.text(-0.05, y_lower + 0.5 * size_cluster_i, str(i))

        # Compute the new y_lower for next plot
        y_lower = y_upper + 10  # 10 for the 0 samples

    ax1.set_title("The silhouette plot for the various clusters.")
    ax1.set_xlabel("The silhouette coefficient values")
    ax1.set_ylabel("Cluster label")

    # The vertical line for average silhouette score of all the values
    ax1.axvline(x=silhouette_avg, color="red", linestyle="--")

    ax1.set_yticks([])  # Clear the yaxis labels / ticks
    ax1.set_xticks([-0.1, 0, 0.2, 0.4, 0.6, 0.8, 1])

    # 2nd Plot showing the actual clusters formed
    colors = cm.nipy_spectral(cluster_labels.astype(float) / n_clusters)

    ax2.scatter(
        df_fc_cleaned_reduced_corr.transpose().iloc[:, 0],
        df_fc_cleaned_reduced_corr.transpose().iloc[:, 1], marker=".", s=30, lw=0, alpha=0.7, c=colors, edgecolor="k"
    )

#     for i in range(len(df_fc_cleaned_cleaned_reduced.transpose().iloc[:, 0])):
#                         ax2.annotate(list(df_fc_cleaned_cleaned_reduced.transpose().index)[i],
#                                      (df_fc_cleaned_cleaned_reduced.transpose().iloc[:, 0][i],
#                                       df_fc_cleaned_cleaned_reduced.transpose().iloc[:, 1][i] + 0.2))

    # Labeling the clusters
    centers = clusterer.cluster_centers_
    # Draw white circles at cluster centers
    ax2.scatter(
        centers[:, 0],
        centers[:, 1],
        marker="o",
        c="white",
        alpha=1,
        s=200,
        edgecolor="k",
    )

    for i, c in enumerate(centers):
        ax2.scatter(c[0], c[1], marker="$%d$" % i, alpha=1, s=50, edgecolor="k")

    ax2.set_title("The visualization of the clustered data.")
    ax2.set_xlabel("Feature space for the 1st feature")
    ax2.set_ylabel("Feature space for the 2nd feature")

    plt.suptitle(
        "Silhouette analysis for KMeans clustering on sample data with n_clusters = %d"
        % n_clusters,
        fontsize=14,
        fontweight="bold",
    )

plt.show()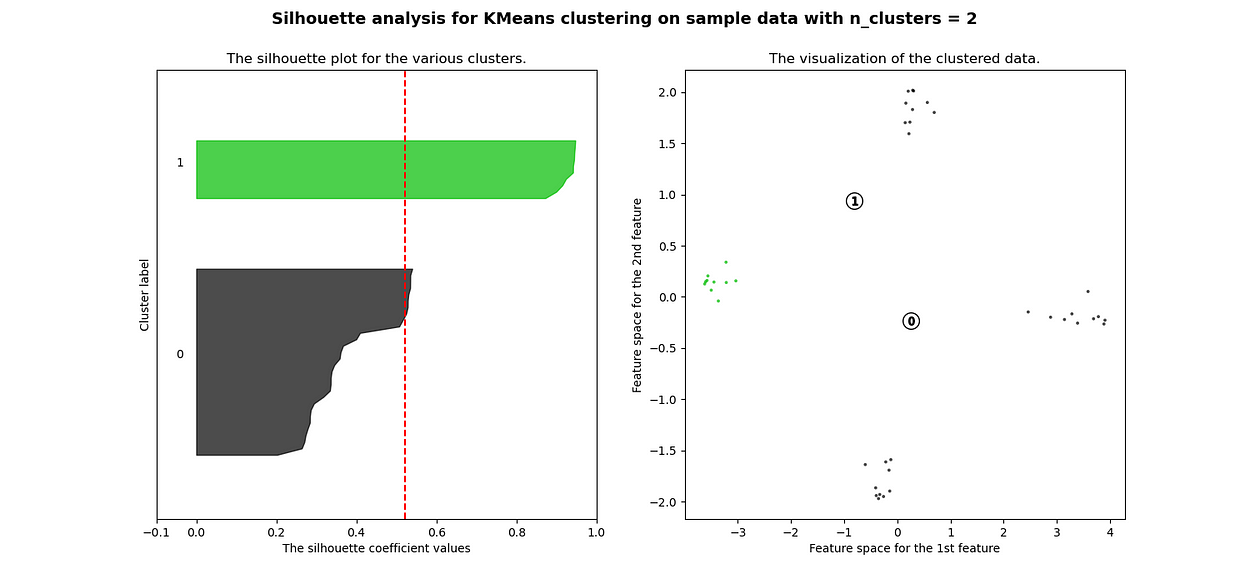

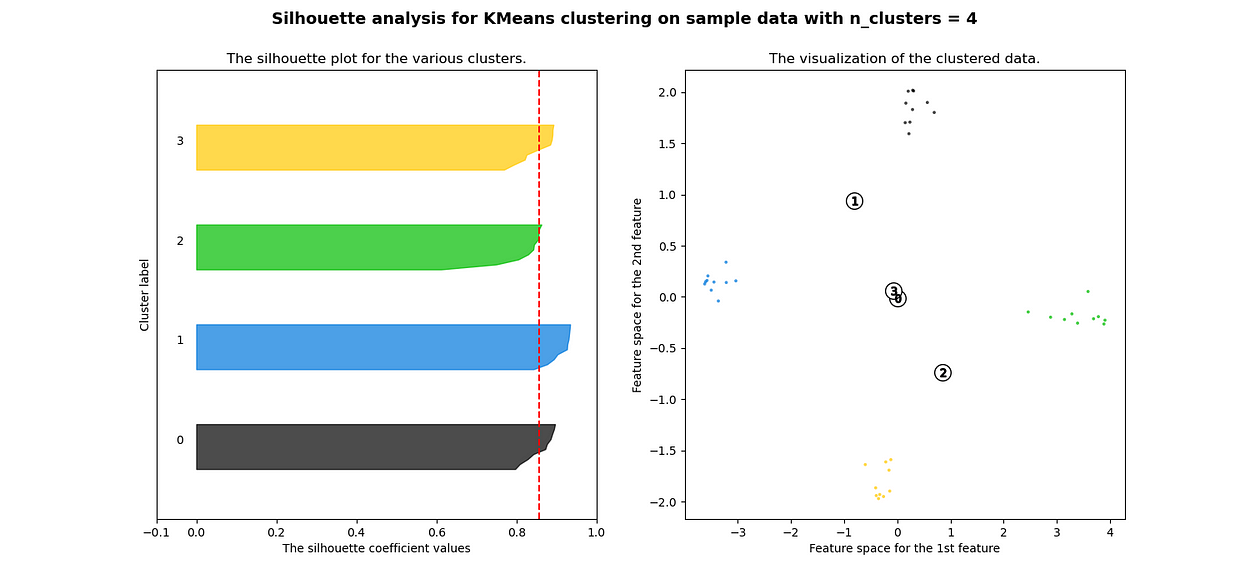


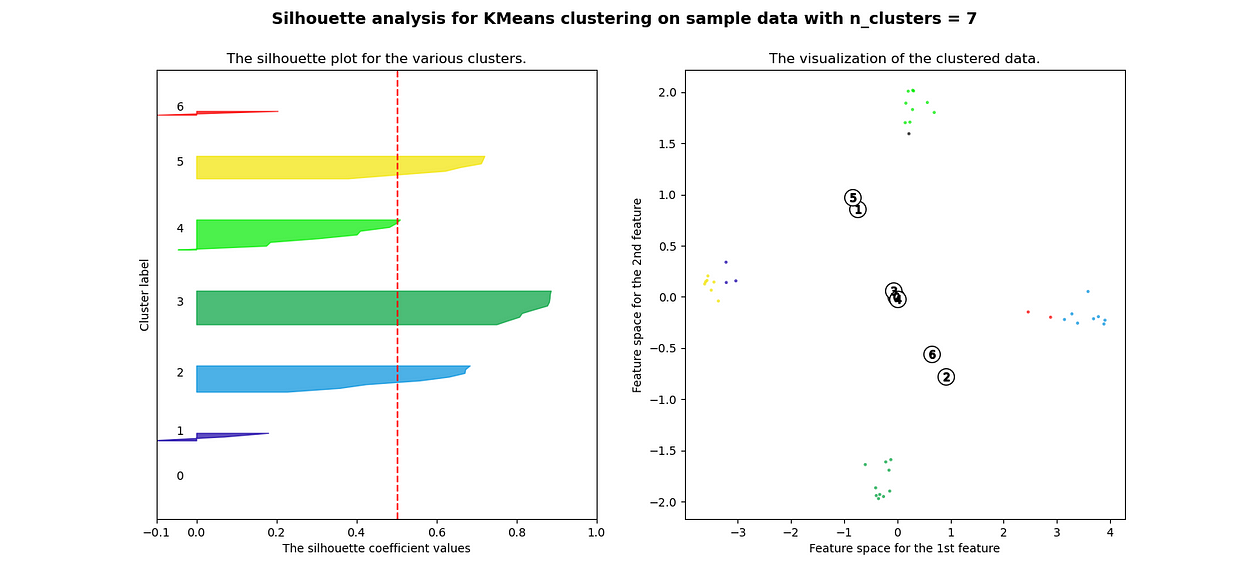

当选择的簇数为 4 时,我们可以看到清晰分离的簇,并且结果通常比欧几里德距离好得多。
欧氏距离和相关轮廓分数之间的比较
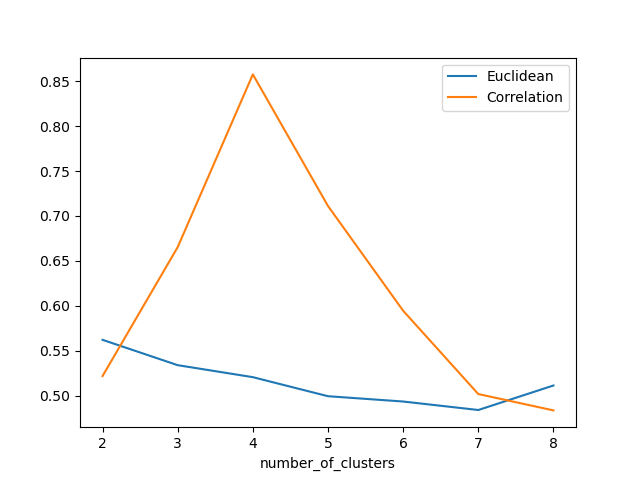
Silhouette 分数表示,当簇数为 4 时,基于相关性的距离矩阵提供最佳结果,而在欧几里德距离的情况下,其效果并不那么清晰
四、结论
在本文中,我们研究了如何使用欧几里德距离和相关性度量来执行时间序列聚类,并且我们还观察了这两种情况下结果的变化。如果我们在评估聚类时结合 Silhouette,我们可以使聚类步骤更加客观,因为它提供了一种很好的直观方法来查看聚类的分离程度。
参考
- https://scikit-learn.org [KMeans 和 Silhouette 分数]
- Plotly: Low-Code Data App Development [可视化库]
- https://scipy.org [用于创建信号数据]
-
吉里什·戴夫·库马尔·乔拉西亚·
如果您觉得我的讲解对您有帮助,请关注我以获取更多内容!如果您有任何问题或建议,请随时发表评论。

