文章目录
- 一、语法
- 二、参数
- 三、返回值
- 四、实例
- 4.1 普通ff甘特图
- 4.2 将任务组合在一起
- 4.3 按数值变量着色
- 4.4 create_gantt
- 4.5具有数字条目的按列索引
- 4.6 具有字符串条目的按列索引
- 4.7 使用颜色字典
- 4.8
一、语法
已弃用,请用plotly.express.timeline()代替。
plotly.figure_factory.create_gantt(df,
                                   colors=None,
                                   index_col=None,
                                   show_colorbar=False,
                                   reverse_colors=False,
                                   title='Gantt Chart',
                                   bar_width=0.2,
                                   showgrid_x=False,
                                   showgrid_y=False,
                                   height=600,
                                   width=None,
                                   tasks=None,
                                   task_names=None,
                                   data=None,
                                   group_tasks=False,
                                   show_hover_fill=True)
二、参数
df ( ( array|list ) ) – 甘特图的输入数据。必须是数据框或列表。如果是数据框,列必须包括“任务”、“开始”和“完成”。可以包含其他列并将其用于索引。如果是列表,则其元素必须是具有相同所需列标题的字典:“任务”、“开始”和“完成”。
color( ( str|list|dict|tuple ) ) – 一个绘图比例名称、一个 rgb 或十六进制颜色、一个颜色元组或一个颜色列表。rgb 颜色的形式为 ‘rgb(x, y, z)’,其中 x, y, z 属于区间 [0, 255],颜色元组是 (a, b, c) 形式的元组,其中a、b 和 c 属于 [0, 1]。如果颜色是一个列表,它必须包含前面提到的有效颜色类型作为其成员。如果是字典,则索引列的所有值都必须是颜色的键。
index_col ( ( str|float ) ) – 将用作索引列的列标题(如果 df 是数据框)。如果 df 是一个列表,则 index_col 必须是 df 的所有项中的键之一。
show_colorbar ( ( bool ) ) – 确定颜色条是否可见。仅当索引列中的值为数字时才适用。
show_hover_fill ( ( bool ) ) – 启用/禁用图表填充区域的悬停文本。
reverse_colors ( ( bool ) ) – 反转所选颜色的顺序
title ( ( str ) ) – 图表的标题
bar_width ( ( float ) ) – 图中水平条的宽度
showgrid_x ( ( bool ) ) – 显示/隐藏 x 轴网格
showgrid_y ( ( bool ) ) – 显示/隐藏 y 轴网格
height ( ( float ) ) – 图表的高度
width ( ( float ) ) – 图表的宽度
df ((array|list)) – input data for gantt chart. Must be either a a dataframe or a list. If dataframe, the columns must include ‘Task’, ‘Start’ and ‘Finish’. Other columns can be included and used for indexing. If a list, its elements must be dictionaries with the same required column headers: ‘Task’, ‘Start’ and ‘Finish’.
colors ((str|list|dict|tuple)) – either a plotly scale name, an rgb or hex color, a color tuple or a list of colors. An rgb color is of the form ‘rgb(x, y, z)’ where x, y, z belong to the interval [0, 255] and a color tuple is a tuple of the form (a, b, c) where a, b and c belong to [0, 1]. If colors is a list, it must contain the valid color types aforementioned as its members. If a dictionary, all values of the indexing column must be keys in colors.
index_col ((str|float)) – the column header (if df is a data frame) that will function as the indexing column. If df is a list, index_col must be one of the keys in all the items of df.
show_colorbar ((bool)) – determines if colorbar will be visible. Only applies if values in the index column are numeric.
show_hover_fill ((bool)) – enables/disables the hovertext for the filled area of the chart.
reverse_colors ((bool)) – reverses the order of selected colors
title ((str)) – the title of the chart
bar_width ((float)) – the width of the horizontal bars in the plot
showgrid_x ((bool)) – show/hide the x-axis grid
showgrid_y ((bool)) – show/hide the y-axis grid
height ((float)) – the height of the chart
width ((float)) – the width of the chart
三、返回值
Returns figure for a gantt chart
四、实例
在 4.9 版本引入之前plotly.express.timeline(),推荐的制作甘特图的方法是使用figure factory现已弃用的create_gantt() ,如下:
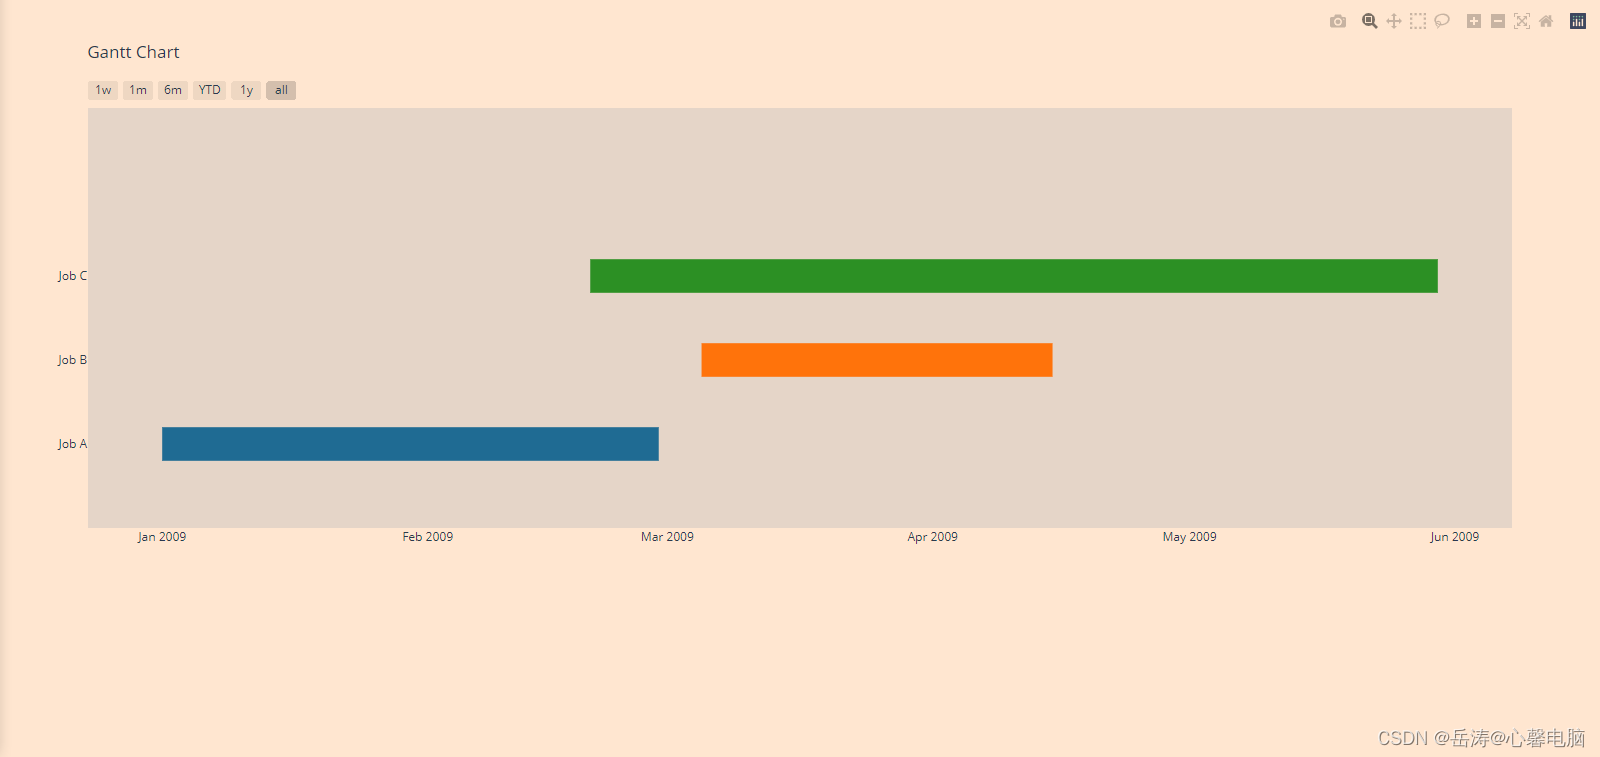
4.1 普通ff甘特图
import plotly.figure_factory as ff

df = [dict(Task="Job A", Start='2009-01-01', Finish='2009-02-28'),
      dict(Task="Job B", Start='2009-03-05', Finish='2009-04-15'),
      dict(Task="Job C", Start='2009-02-20', Finish='2009-05-30')]

fig = ff.create_gantt(df)
fig.show()
4.2 将任务组合在一起
以下示例显示如何使用现已弃用的create_gantt() 图形工厂通过数值变量为任务着色。
import plotly.figure_factory as ff

df = [dict(Task="Job-1", Start='2017-01-01', Finish='2017-02-02', Resource='Complete'),
      dict(Task="Job-1", Start='2017-02-15', Finish='2017-03-15', Resource='Incomplete'),
      dict(Task="Job-2", Start='2017-01-17', Finish='2017-02-17', Resource='Not Started'),
      dict(Task="Job-2", Start='2017-01-17', Finish='2017-02-17', Resource='Complete'),
      dict(Task="Job-3", Start='2017-03-10', Finish='2017-03-20', Resource='Not Started'),
      dict(Task="Job-3", Start='2017-04-01', Finish='2017-04-20', Resource='Not Started'),
      dict(Task="Job-3", Start='2017-05-18', Finish='2017-06-18', Resource='Not Started'),
      dict(Task="Job-4", Start='2017-01-14', Finish='2017-03-14', Resource='Complete')]

colors = {'Not Started': 'rgb(220, 0, 0)',
          'Incomplete': (1, 0.9, 0.16),
          'Complete': 'rgb(0, 255, 100)'}

fig = ff.create_gantt(df, colors=colors, index_col='Resource', show_colorbar=True,
                      group_tasks=True)
fig.show()

4.3 按数值变量着色
以下示例显示如何使用现已弃用的create_gantt() 图形工厂通过数值变量为任务着色。
import plotly.figure_factory as ff

df = [dict(Task="Job A", Start='2009-01-01', Finish='2009-02-28', Complete=10),
      dict(Task="Job B", Start='2008-12-05', Finish='2009-04-15', Complete=60),
      dict(Task="Job C", Start='2009-02-20', Finish='2009-05-30', Complete=95)]

fig = ff.create_gantt(df, colors='Viridis', index_col='Complete', show_colorbar=True)
fig.show()

4.4 create_gantt
from plotly.figure_factory import create_gantt

# Make data for chart
df = [dict(Task="Job A", Start='2009-01-10', Finish='2009-02-25'),
      dict(Task="Job B", Start='2009-03-05', Finish='2009-04-15'),
      dict(Task="Job C", Start='2009-02-20', Finish='2009-05-30')]

print(df)
'''
[{'Task': 'Job A', 'Start': '2009-01-10', 'Finish': '2009-02-25'},
{'Task': 'Job B', 'Start': '2009-03-05', 'Finish': '2009-04-15'},
{'Task': 'Job C', 'Start': '2009-02-20', 'Finish': '2009-05-30'}]
'''
# Create a figure
fig = create_gantt(df)
fig.show()
在这里插入代码片

4.5具有数字条目的按列索引
from plotly.figure_factory import create_gantt

# Make data for chart
df = [dict(Task="Job A", Start='2009-01-01',
           Finish='2009-02-25', Complete=10),
      dict(Task="Job B", Start='2009-03-05',
           Finish='2009-04-15', Complete=60),
      dict(Task="Job C", Start='2009-02-20',
           Finish='2009-05-30', Complete=95)]

print(df)
'''
[{'Task': 'Job A', 'Start': '2009-01-01', 'Finish': '2009-02-25', 'Complete': 10},
{'Task': 'Job B', 'Start': '2009-03-05', 'Finish': '2009-04-15', 'Complete': 60},
{'Task': 'Job C', 'Start': '2009-02-20', 'Finish': '2009-05-30', 'Complete': 95}]
'''
# 使用Plotly colorscale创建图形
fig = create_gantt(df, colors='Blues', index_col='Complete',
                   show_colorbar=True, bar_width=0.5,
                   showgrid_x=True, showgrid_y=True)

fig.show()

4.6 具有字符串条目的按列索引
from plotly.figure_factory import create_gantt

# Make data for chart
df = [dict(Task="Job A", Start='2009-01-01',
           Finish='2009-02-25', Resource='Apple'),
      dict(Task="Job B", Start='2009-03-05',
           Finish='2009-04-15', Resource='Grape'),
      dict(Task="Job C", Start='2009-02-20',
           Finish='2009-05-30', Resource='Banana')]

print(df)
'''
[{'Task': 'Job A', 'Start': '2009-01-01', 'Finish': '2009-02-25', 'Resource': 'Apple'},
{'Task': 'Job B', 'Start': '2009-03-05', 'Finish': '2009-04-15', 'Resource': 'Grape'},
{'Task': 'Job C', 'Start': '2009-02-20', 'Finish': '2009-05-30', 'Resource': 'Banana'}]
'''
# 使用Plotly colorscale创建图形
fig = create_gantt(df, colors=['rgb(200, 50, 25)', (1, 0, 1), '#6c4774'],
                   index_col='Resource', reverse_colors=True,
                   show_colorbar=True)

fig.show()

4.7 使用颜色字典
from plotly.figure_factory import create_gantt

# Make data for chart
df = [dict(Task="Job A", Start='2009-01-01',
           Finish='2009-02-25', Resource='Apple'),
      dict(Task="Job B", Start='2009-03-05',
           Finish='2009-04-15', Resource='Grape'),
      dict(Task="Job C", Start='2009-02-20',
           Finish='2009-05-30', Resource='Banana')]

print(df)
'''
[{'Task': 'Job A', 'Start': '2009-01-01', 'Finish': '2009-02-25', 'Resource': 'Apple'},
{'Task': 'Job B', 'Start': '2009-03-05', 'Finish': '2009-04-15', 'Resource': 'Grape'},
{'Task': 'Job C', 'Start': '2009-02-20', 'Finish': '2009-05-30', 'Resource': 'Banana'}]
'''
# 创建颜色词典
colors = {'Apple': 'rgb(255, 0, 0)',
          'Grape': 'rgb(170, 14, 200)',
          'Banana': (1, 1, 0.2)}

# 使用Plotly colorscale创建图形
fig = create_gantt(df, colors=colors, index_col='Resource',
                   show_colorbar=True)

fig.show()

4.8
from plotly.figure_factory import create_gantt
import pandas as pd

# Make data for chart
df = pd.DataFrame([['Run', '2010-01-01', '2011-02-02', 10],
                   ['Fast', '2011-01-01', '2012-06-05', 55],
                   ['Eat', '2012-01-05', '2013-07-05', 94]],
                  columns=['Task', 'Start', 'Finish', 'Complete'])

print(df)
'''
   Task       Start      Finish  Complete
0   Run  2010-01-01  2011-02-02        10
1  Fast  2011-01-01  2012-06-05        55
2   Eat  2012-01-05  2013-07-05        94
'''

# 使用Plotly colorscale创建图形
fig = create_gantt(df, colors='Blues', index_col='Complete',
                   show_colorbar=True, bar_width=0.5,
                   showgrid_x=True, showgrid_y=True)

fig.show()









![[普及练习场]失踪的7](https://img-blog.csdnimg.cn/c725ff95ac704efd868df586f3cff1a0.png)


