在飞浆平台上成功运行出pandas-profiling啦~
首先一键安装
pip install ydata_profiling
然后演示,可以生成一个网页对数据有一个比较好的理解
import numpy as np
import pandas as pd
from ydata_profiling import ProfileReport

train_power = pd.read_csv('/home/aistudio/work/data/train/power.csv')
profile = ProfileReport(train_power, title="Profiling Report")
profile.to_file('report.html')
出来啦

试试调参效果
算了算了还是不调了效果真不行
试试利用上下值填充缺失值
#利用上下值填充缺失值
train_data.fillna(method='bfill',inplace = True)
test_data.fillna(method='bfill',inplace = True)
去掉f3
#去掉f3
train_df.drop('f3',axis = 1,inplace = True)
test_df.drop('f3',axis = 1,inplace = True)
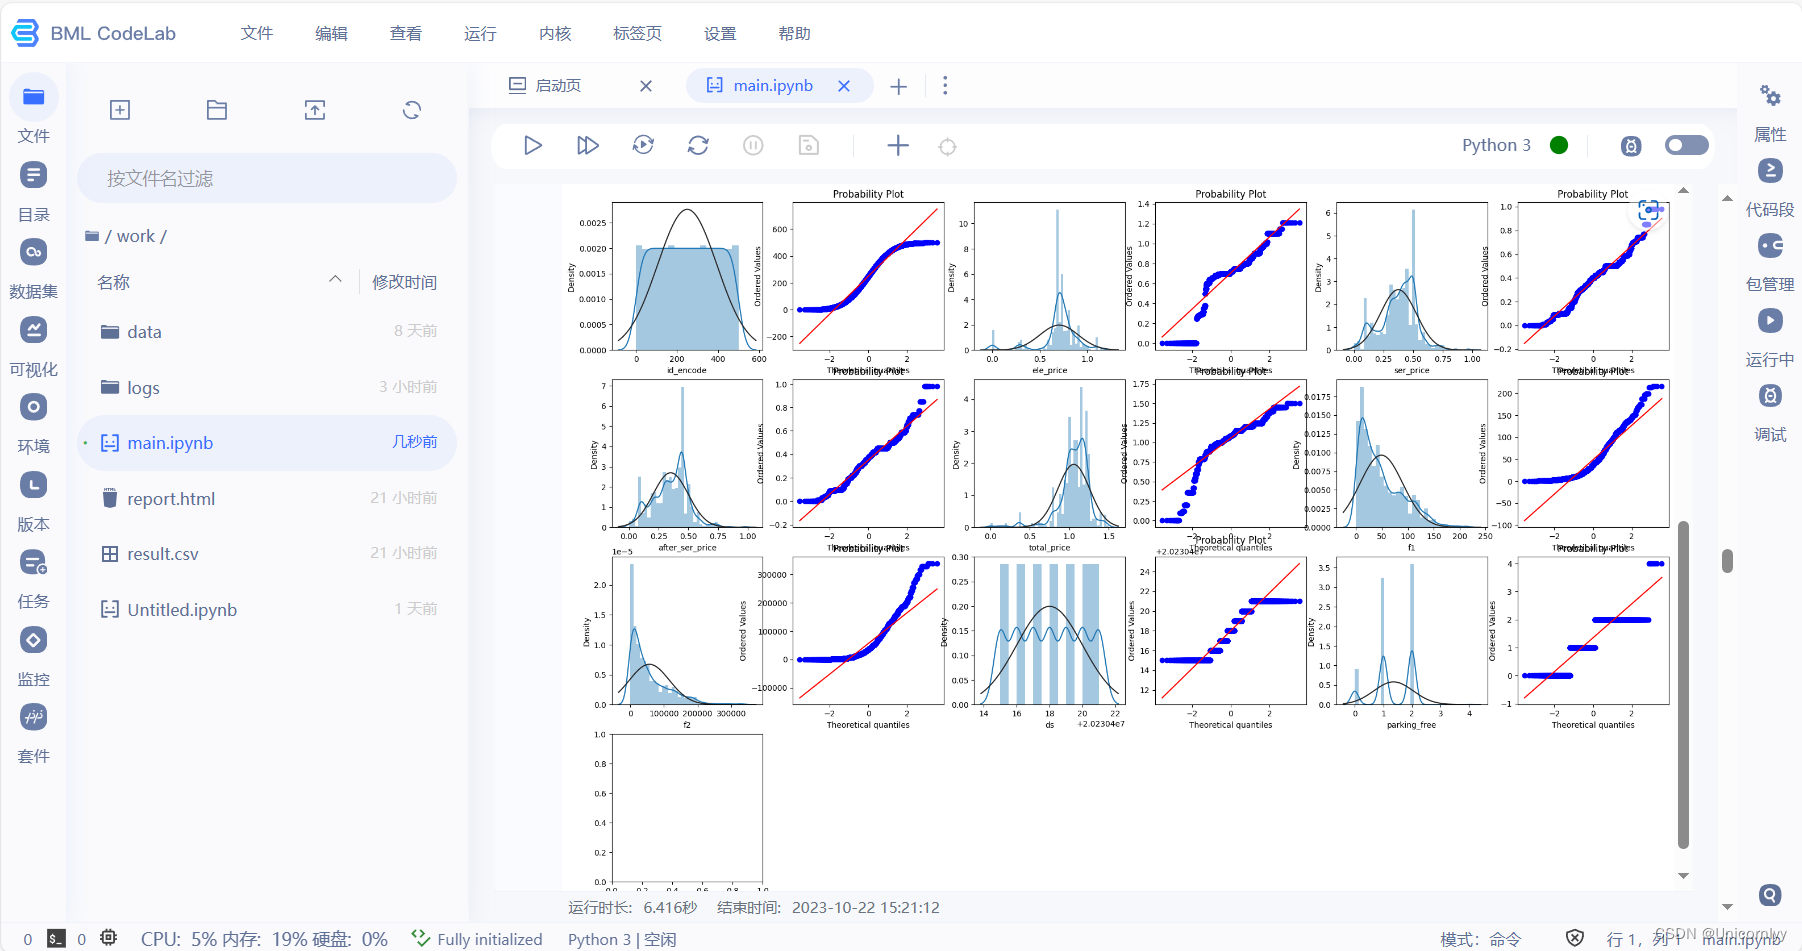
#绘制直方图和Q-Q图,查看训练集数据正态分布情况
train_cols =6
train_rows =len(train_df.columns)
plt.figure(figsize=(4*train_cols,4*train_rows))

i=0
for col in train_df.columns:
    i+=1
    ax=plt.subplot(train_rows,train_cols,i)
    sns.distplot(train_df[col],fit=stats.norm)

    i+=1
    ax = plt.subplot(train_rows,train_cols,i)
    res = stats.probplot(train_df[col],plot=plt)
plt.tight_layout()
plt.show()

同样,查看测试集的情况
#绘制直方图和Q-Q图,查看测试集数据正态分布情况
test_cols =6
test_rows =len(test_df.columns)
plt.figure(figsize=(4*test_cols,4*test_rows))

i=0
for col in test_df.columns:
    i+=1
    ax=plt.subplot(test_rows,test_cols,i)
    sns.distplot(test_df[col],fit=stats.norm)

    i+=1
    ax = plt.subplot(test_rows,test_cols,i)
    res = stats.probplot(test_df[col],plot=plt)
plt.tight_layout()
plt.show()
了解到一个自动调参工具openbox,但是我还不会用只下载成功了它的包


