import numpy as np
import matplotlib.pyplot as plt
from sklearn.metrics import confusion_matrix

# 示例的真实标签和预测标签
true_labels = ['cat', 'dog', 'bird', 'cat', 'dog', 'bird', 'cat', 'bird', 'bird']
predicted_labels = ['cat', 'bird', 'dog', 'cat', 'bird', 'dog', 'cat', 'cat', 'bird']

# 确定所有类别的唯一值
unique_labels = np.unique(true_labels)

# 计算混淆矩阵
cm = confusion_matrix(true_labels, predicted_labels)
print(cm)
# 绘制混淆矩阵的可视化
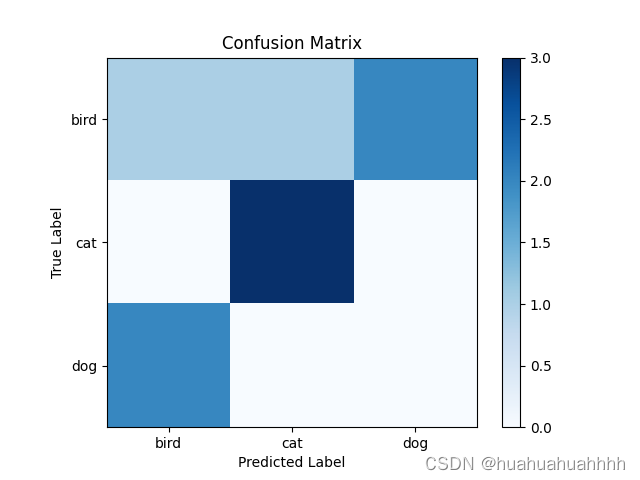
plt.imshow(cm, interpolation='nearest', cmap=plt.cm.Blues)
plt.title('Confusion Matrix')
plt.colorbar()
tick_marks = np.arange(len(unique_labels))
plt.xticks(tick_marks, unique_labels)
plt.yticks(tick_marks, unique_labels)
plt.xlabel('Predicted Label')
plt.ylabel('True Label')
plt.show()
[[1 1 2]
[0 3 0]
[2 0 0]]
