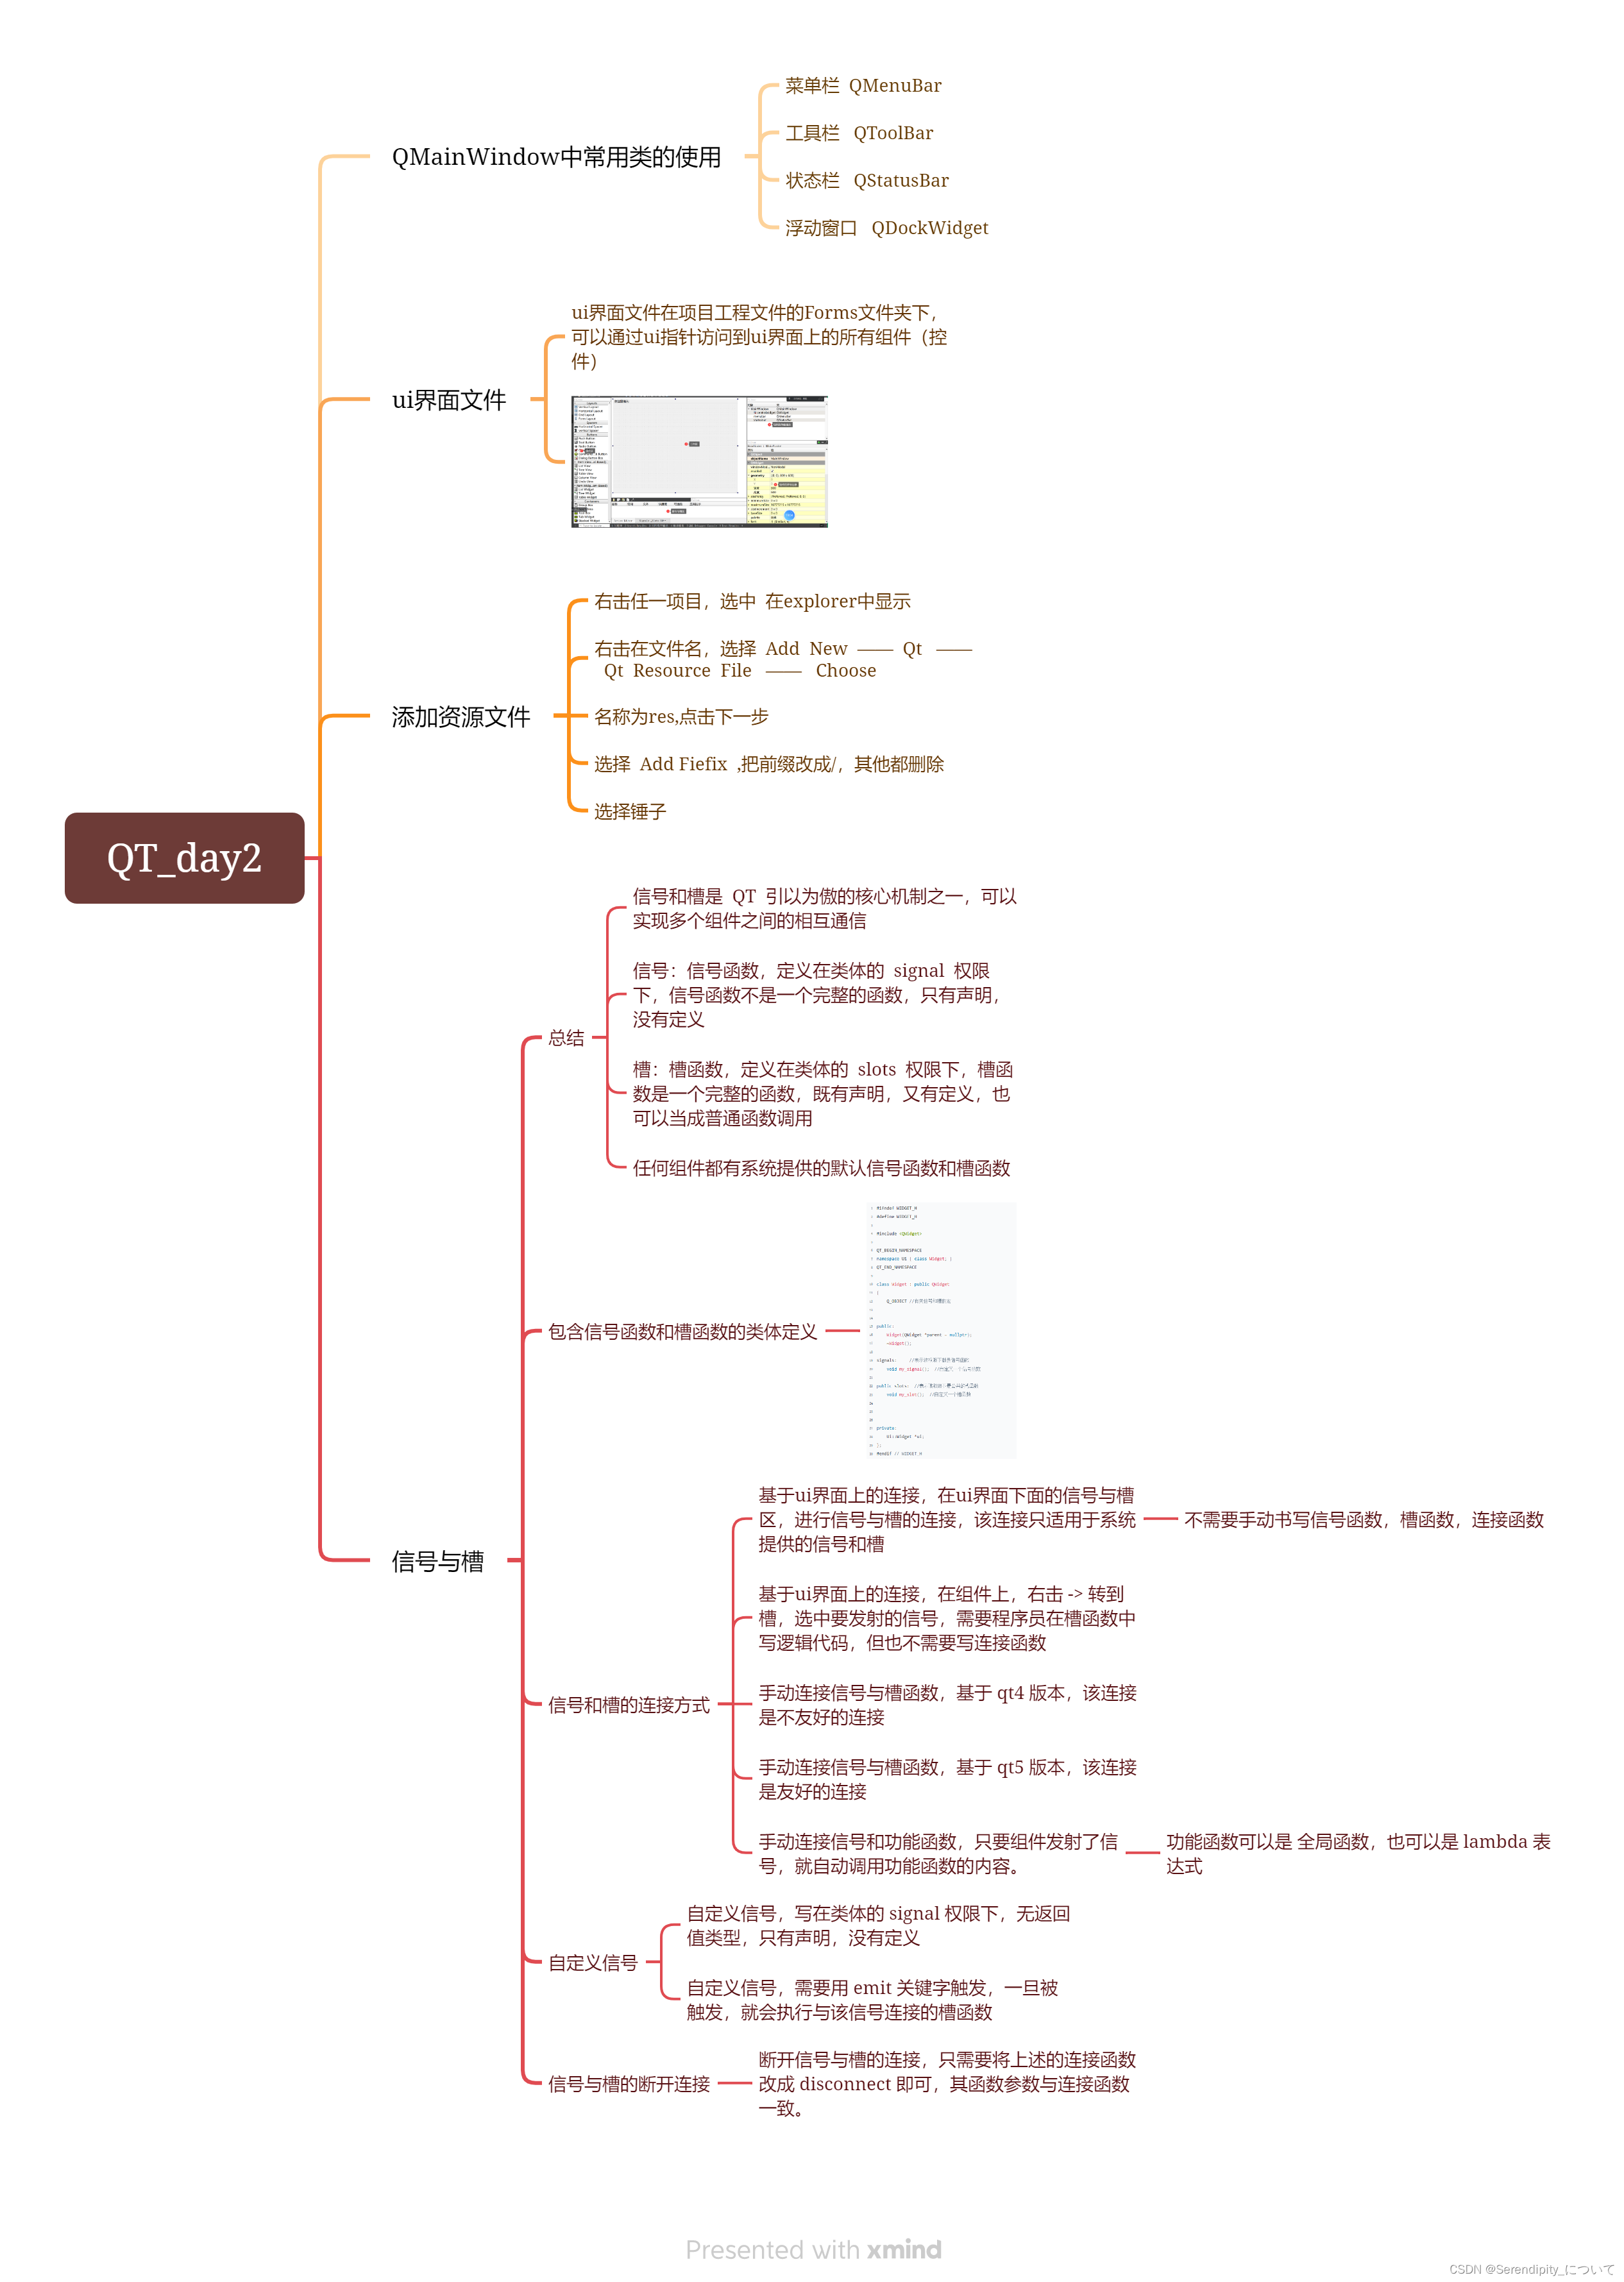
背景
实现一键导出excel
并且区分图表和表格为不同的sheet工作表
最终效果为

代码实现
功能实现
  <script lang="ts">
  import * as echarts from 'echarts';
  import ExcelJS from 'exceljs';
  import { saveAs } from 'file-saver';
import {getAsyncTempCurrentData} from '../../../api/fenxi'
import {  toRefs } from 'vue'
import FileSaver from "file-saver";
import * as XLSX from 'xlsx'
import { ref, reactive, onMounted ,getCurrentInstance,nextTick } from 'vue'


  export default {
    data() {
        const state = reactive({
    tableData: [] as any, // 表格数据
    dialog: false, // 模态框显示、隐藏
    name: '' // 自定义文件名
})

// const tableData = ref();
const { tableData, dialog, name } = toRefs(state)
      return {

        chart: null,
        tableData
      };
    },
    mounted() {

      this.chart = echarts.init(this.$refs.chart);
      this.fetchData();

    },
    methods: {
      fetchData() {
        getAsyncTempCurrentData().then((response) => {
          console.log(response);
            this.tableData = response.data;
          const years = response.data.map((item) => item.year + '年' + item.month + '月');
          const charges = response.data.map((item) => item.charge);
          const discharges = response.data.map((item) => item.discharge);
          const temps = response.data.map((item) => item.temp);

          const  option = {

          textStyle:{
            color:"gray"},
        tooltip: {
          trigger: 'axis',
          axisPointer: { // 坐标轴指示器,坐标轴触发有效
            type: 'shadow' // 默认为直线,可选为:'line' | 'shadow'
          },
          show: true,


        },
        grid: {
          left: '2%',
          right: '4%',
          bottom: '14%',
          top:'16%',
          containLabel: false
        },
         legend: {
        data: ['充电量', '放电量', '温度'],
        right: 10,
        top:12,
        textStyle: {
            color: "#fff"
        },

        // itemGap: 35
    },
        xAxis: {
          type: 'category',
          data: years,
          axisLine: {
            lineStyle: {
              color: 'white'

            }
          },
          axisLabel: {
            // interval: 0,
            // rotate: 40,
            textStyle: {
              fontFamily: 'Microsoft YaHei'
            }
          },
        },

        yAxis: [
        {
          type: 'value',
          scale: false,
          min: 0,
          axisLine: {
            show: false,
            lineStyle: {
              color: 'white'
            }
          },
          splitLine: {
            show: true,
            lineStyle: {
              color: 'rgba(255,255,255,0.3)'
            }
          },
          axisLabel: {}
        },
        {
          type: 'value',
          scale: true,
          axisLine: {
            show: false,
            lineStyle: {
              color: 'gray'
            }
          },
          splitLine: {
            show: true,
            lineStyle: {
              color: 'gray'
            }
          },
          axisLabel: {}
        }

      ],

        series: [{
          name: '充电量',
          type: 'bar',
          barWidth: '15%',
          yAxisIndex: 0,
          itemStyle: {
            normal: {
                color: new echarts.graphic.LinearGradient(0, 0, 0, 1, [{
                    offset: 0,
                    color: '#fccb05'
                }, {
                    offset: 1,
                    color: '#f5804d'
                }]),
                barBorderRadius: 12,
            },
          },
          data: charges,
        },
        {
          name: '放电量',
          type: 'bar',
          barWidth: '15%',
          yAxisIndex: 0,
          itemStyle: {
            normal: {
                color: new echarts.graphic.LinearGradient(0, 0, 0, 1, [{
                    offset: 0,
                    color: '#8bd46e'
                }, {
                    offset: 1,
                    color: '#09bcb7'
                }]),
                barBorderRadius: 11,
            }

          },
          data: discharges
        },
        {
          name: '温度',
          type: 'line',
          yAxisIndex: 1,
          itemStyle: {
            normal: {
                color: new echarts.graphic.LinearGradient(0, 0, 0, 1, [{
                    offset: 0,
                    color: '#248ff7'
                }, {
                    offset: 1,
                    color: '#6851f1'
                }]),
            barBorderRadius: 11,
            }
          },
          data: temps
        }]
        };

          this.chart.setOption(option);
        });
      },
      exportExcel() {
        const workbook = new ExcelJS.Workbook();


const tableData = Array.from(document.querySelectorAll('#el-table tbody tr')).map(row => {
      return Array.from(row.querySelectorAll('td')).map(cell => cell.innerText);
    });
    const header = ['序号', '年份', '月份', '充电量', '放电量', '温度']; // 表头数据
    tableData.unshift(header);
        const columnIndexToRemove = 0;

// 遍历 elTable 数组,将每一行的第一列数据删除
        tableData.forEach(row => {
    row.splice(columnIndexToRemove, 1);
    });


        const worksheet = workbook.addWorksheet('数据图形');
        const worksheet2 = workbook.addWorksheet('数据表格');
        const chart = echarts.getInstanceByDom(this.$refs.chart);
        const base64Image = chart.getDataURL({
          pixelRatio: 2,
          backgroundColor: '#fff',
        });
        let image = workbook.addImage({
          base64: base64Image,
          extension: 'png',
        });

        worksheet.addImage(image, 'A1:Z30');
        worksheet2.addRows(tableData);
        workbook.xlsx.writeBuffer().then(function (buffer) {
          saveAs.saveAs(
            new Blob([buffer], {
              type: 'application/octet-stream',
            }),
            'xchart.xlsx'
          );
        });
      },
    },
  };
  </script>
  <template>
    <div>
      <div ref="chart" id="lineChart" style="height: 400px; width: 1000px"></div>
      <el-button @click="exportExcel">导出图表</el-button>

      <el-table :data="tableData" style="width: 100%" id="el-table"  border ref="tableRef" v-show="true">
                            <el-table-column type="selection" width="50" align="center" />
                            <el-table-column prop="year" label="年份"></el-table-column>
                            <el-table-column prop="month" label="月份"></el-table-column>
                            <el-table-column prop="charge" label="充电量"></el-table-column>
                            <el-table-column prop="discharge" label="放电量"></el-table-column>
                            <el-table-column prop="temp" label="温度"></el-table-column>
                        </el-table>

    </div>

  </template>
## 模态框点击以及自定义文件名
添加模态框组件
 <el-dialog v-model="dialog" title="表格导出" width="30%" @close="closeDialog">
      <el-input v-model="name" placeholder="请输入导出文件的文件名"></el-input>
      <el-alert title="默认文件名为(站点名+数据文件)" type="info" :closable="false" style="margin-top: 10px;" />
      <template #footer>
        <span class="dialog-footer">
          <el-button @click="closeDialog">取消</el-button>
          <el-button type="primary" @click="exportExcel">确定</el-button>
        </span>
      </template>
    </el-dialog>
绑定开闭状态,在按钮上修改触发方法为开启模态框
<el-button @click="openExportDialog">导出图表</el-button> <!-- 导出按钮 -->
对应的方法是
      openExportDialog() {
      this.dialog = true; // 打开模态框
    },

    closeDialog() {
      this.dialog = false; // 关闭模态框
    },
然后修改相应的状态
全部代码
  <script lang="ts">
  import * as echarts from 'echarts';
  import ExcelJS from 'exceljs';
  import { saveAs } from 'file-saver';
import {getAsyncTempCurrentData} from '../../../api/fenxi'
import {  toRefs } from 'vue'
import FileSaver from "file-saver";
import * as XLSX from 'xlsx'
import { ref, reactive, onMounted ,nextTick } from 'vue'
import { selectedStoreHook,useselectedStore } from "../../../store/modules/selected";
const store = useselectedStore();
const state = reactive({
    tableData: [] as any, // 表格数据
    dialog: false, // 模态框显示、隐藏
    name: '' // 自定义文件名
})
let filename = '';
const { tableData, dialog, name } = toRefs(state)

  export default {
    data() {
        const state = reactive({
    tableData: [] as any, // 表格数据
    dialog: false, // 模态框显示、隐藏
    name: '' // 自定义文件名,

})

      return {

        chart: null,
        tableData,
        dialog,
        name,

      };
    },
    mounted() {

      this.chart = echarts.init(this.$refs.chart);
      this.fetchData();

    },
    methods: {
      fetchData() {
        getAsyncTempCurrentData().then((response) => {
          console.log(response);
            this.tableData = response.data;
          const years = response.data.map((item) => item.year + '年' + item.month + '月');
          const charges = response.data.map((item) => item.charge);
          const discharges = response.data.map((item) => item.discharge);
          const temps = response.data.map((item) => item.temp);

          const  option = {

          textStyle:{
            color:"gray"},
        tooltip: {
          trigger: 'axis',
          axisPointer: { // 坐标轴指示器,坐标轴触发有效
            type: 'shadow' // 默认为直线,可选为:'line' | 'shadow'
          },
          show: true,


        },
        grid: {
          left: '2%',
          right: '4%',
          bottom: '14%',
          top:'16%',
          containLabel: false
        },
         legend: {
        data: ['充电量', '放电量', '温度'],
        right: 10,
        top:12,
        textStyle: {
            color: "#fff"
        },

        // itemGap: 35
    },
        xAxis: {
          type: 'category',
          data: years,
          axisLine: {
            lineStyle: {
              color: 'white'

            }
          },
          axisLabel: {
            // interval: 0,
            // rotate: 40,
            textStyle: {
              fontFamily: 'Microsoft YaHei'
            }
          },
        },

        yAxis: [
        {
          type: 'value',
          scale: false,
          min: 0,
          axisLine: {
            show: false,
            lineStyle: {
              color: 'white'
            }
          },
          splitLine: {
            show: true,
            lineStyle: {
              color: 'rgba(255,255,255,0.3)'
            }
          },
          axisLabel: {}
        },
        {
          type: 'value',
          scale: true,
          axisLine: {
            show: false,
            lineStyle: {
              color: 'gray'
            }
          },
          splitLine: {
            show: true,
            lineStyle: {
              color: 'gray'
            }
          },
          axisLabel: {}
        }

      ],

        series: [{
          name: '充电量',
          type: 'bar',
          barWidth: '15%',
          yAxisIndex: 0,
          itemStyle: {
            normal: {
                color: new echarts.graphic.LinearGradient(0, 0, 0, 1, [{
                    offset: 0,
                    color: '#fccb05'
                }, {
                    offset: 1,
                    color: '#f5804d'
                }]),
                barBorderRadius: 12,
            },
          },
          data: charges,
        },
        {
          name: '放电量',
          type: 'bar',
          barWidth: '15%',
          yAxisIndex: 0,
          itemStyle: {
            normal: {
                color: new echarts.graphic.LinearGradient(0, 0, 0, 1, [{
                    offset: 0,
                    color: '#8bd46e'
                }, {
                    offset: 1,
                    color: '#09bcb7'
                }]),
                barBorderRadius: 11,
            }

          },
          data: discharges
        },
        {
          name: '温度',
          type: 'line',
          yAxisIndex: 1,
          itemStyle: {
            normal: {
                color: new echarts.graphic.LinearGradient(0, 0, 0, 1, [{
                    offset: 0,
                    color: '#248ff7'
                }, {
                    offset: 1,
                    color: '#6851f1'
                }]),
            barBorderRadius: 11,
            }
          },
          data: temps
        }]
        };

          this.chart.setOption(option);
        });
      },
      openExportDialog() {
      this.dialog = true; // 打开模态框
    },

    closeDialog() {
      this.dialog = false; // 关闭模态框
    },

       close() {
	// 模态框取消,重新获取数据
    this.fetchData();
},
      exportExcel() {
        if (state.name === '') {
      // 默认导出文件名
      filename = '站点' + store.siteid + '数据文件';
    } else {
      filename = state.name ;
    }


        const workbook = new ExcelJS.Workbook();


const tableData = Array.from(document.querySelectorAll('#el-table tbody tr')).map(row => {
      return Array.from(row.querySelectorAll('td')).map(cell => cell.innerText);
    });
    const header = ['序号', '年份', '月份', '充电量', '放电量', '温度']; // 表头数据
    tableData.unshift(header);
        const columnIndexToRemove = 0;

// 遍历 elTable 数组,将每一行的第一列数据删除
        tableData.forEach(row => {
    row.splice(columnIndexToRemove, 1);
    });


        const worksheet = workbook.addWorksheet('数据图形');
        const worksheet2 = workbook.addWorksheet('数据表格');
        const chart = echarts.getInstanceByDom(this.$refs.chart);
        const base64Image = chart.getDataURL({
          pixelRatio: 2,
          backgroundColor: '#fff',
        });
        let image = workbook.addImage({
          base64: base64Image,
          extension: 'png',
        });

        worksheet.addImage(image, 'A1:Z30');
        worksheet2.addRows(tableData);
        workbook.xlsx.writeBuffer().then(function (buffer) {
          saveAs.saveAs(
            new Blob([buffer], {
              type: 'application/octet-stream',
            }),
            filename+'.xlsx'
          );
        });
      },//
        save() {
  nextTick(function () {

    let filename = '';
        if (state.name === '') {
      // 默认导出文件名
      filename = '站点' + store.siteid + '数据文件.xlsx';
    } else {
      filename = state.name += '.xlsx';
    }
    const header = ['序号', '年份', '月份', '充电量', '放电量', '温度']; // 表头数据

// 将表头插入到 elTable 数组的开头

    // 创建工作簿
    const workbook = XLSX.utils.book_new();
    const xlsxParam = { raw: true }; // 转化成Excel使用原始格式

    // 获取表格数据
    const tableData = Array.from(document.querySelectorAll('#el-table tbody tr')).map(row => {
      return Array.from(row.querySelectorAll('td')).map(cell => cell.innerText);
    });
    tableData.unshift(header);

    const columnIndexToRemove = 0;

// 遍历 elTable 数组,将每一行的第一列数据删除
        tableData.forEach(row => {
    row.splice(columnIndexToRemove, 1);
    });
    // 创建工作表1
    const sheet1 = XLSX.utils.aoa_to_sheet(tableData);

    // 将工作表1添加到工作簿
    XLSX.utils.book_append_sheet(workbook, sheet1, '表格');


// 将echarts图表转换为图片

// 创建工作表2
const sheet2 = XLSX.utils.aoa_to_sheet([]);
const img = new Image();
img.src = 'http://localhost:4444/src/assets/admin.png';


// const chart = echarts.getInstanceByDom(this.$refs.chart) // 获取图表实例
//       const base64Image = chart.getDataURL({
//         pixelRatio: 2, // 导出图片的分辨率比例,默认为1,即图片的分辨率为屏幕分辨率的一倍
//         backgroundColor: '#fff' // 导出图片的背景色
//       })
//       let image= workbook.addImage({ // 添加图片
//           base64: base64Image, // 图片的base64编码
//           extension: 'png'  // 图片的扩展名
//         });
//         worksheet.addImage(image, 'A1:J20'); // 将图片添加到工作表中
//         workbook.xlsx.writeBuffer().then(function (buffer) { // 生成excel文件的二进制数据
//         saveAs.saveAs(new Blob([buffer], {  // 生成Blob对象
//           type: 'application/octet-stream'  // 指定文件的MIME类型
//         }), 'xchart.xlsx');  // 指定文件名
//       });


 XLSX.utils.book_append_sheet(workbook, sheet2, '图表');

    // 导出Excel文件
    XLSX.writeFile(workbook, filename);


  });
}
    }
  };
  </script>
  <template>
    <div ref="export" >
      <div ref="chart" id="lineChart" style="height: 400px; width: 1000px" v-show="false"></div>
      <!-- <el-button @click="exportExcel">导出图表</el-button>
      <el-button type="primary" @click="exportExcel">导出</el-button>导出按钮 -->
      <el-button @click="openExportDialog">导出图表</el-button> <!-- 导出按钮 -->

 <!-- 模态框 -->
 <el-dialog v-model="dialog" title="表格导出" width="30%" @close="closeDialog">
      <el-input v-model="name" placeholder="请输入导出文件的文件名"></el-input>
      <el-alert title="默认文件名为(站点名+数据文件)" type="info" :closable="false" style="margin-top: 10px;" />
      <template #footer>
        <span class="dialog-footer">
          <el-button @click="closeDialog">取消</el-button>
          <el-button type="primary" @click="exportExcel">确定</el-button>
        </span>
      </template>
    </el-dialog>
      <el-table :data="tableData" style="width: 100%" id="el-table"  border ref="tableRef" v-show="false">
                            <el-table-column type="selection" width="50" align="center" />
                            <el-table-column prop="year" label="年份"></el-table-column>
                            <el-table-column prop="month" label="月份"></el-table-column>
                            <el-table-column prop="charge" label="充电量"></el-table-column>
                            <el-table-column prop="discharge" label="放电量"></el-table-column>
                            <el-table-column prop="temp" label="温度"></el-table-column>
                        </el-table>

    </div>

  </template>

