〇、前言
本文主要完成MIT 6.S081 实验二:system call
一、Using gdb (easy)
Question requirements
In many cases, print statements will be sufficient to debug your kernel, but sometimes being able to single step through some assembly code or inspecting the variables on the stack is helpful.
To learn more about how to run GDB and the common issues that can arise when using GDB, check out this page.
To help you become familiar with gdb, run make qemu-gdb and then fire up gdb in another window (see the gdb bullet on the guidance page). Once you have two windows open, type in the gdb window:
我们启动 gdb:
$ make qemu-gdb
make qemu-gdb 命令通常是用于启动QEMU虚拟机并与GDB(GNU Debugger)连接以进行调试的命令。以下是它的主要作用:
- 启动QEMU虚拟机:make qemu-gdb 命令启动了一个QEMU虚拟机实例。QEMU是一个开源的虚拟化工具,它可以模拟多种处理器体系结构,并在模拟环境中运行操作系统和应用程序。
- 启用GDB调试:通过运行:make qemu-gdb,将启用GDB调试模式,使得QEMU虚拟机处于可调试状态。
- 建立GDB连接:一旦QEMU虚拟机启动,它将等待GDB连接。可以使用GDB来连接到虚拟机,以便执行调试操作,如断点设置、变量查看、单步执行等。
- 调试目标程序:通常,
make qemu-gdb命令会与要调试的目标程序相关联。
这时候,在另一个相同目录下的终端中,输入:
$ gdb-multiarch -x .gdbinit
gdb-multiarch -x .gdbinit 这个命令的作用是使用多体系结构(multi-architecture)版本的GDB,同时执行一个包含GDB命令的脚本文件 .gdbinit。各个部分的含义如下:
-
gdb-multiarch:这是GDB的一个命令,表示启动多体系结构版本的GDB。多体系结构版本的GDB支持在不同的CPU架构上进行调试。
-
-x .gdbinit:这是一个选项,指示GDB在启动时执行指定的脚本文件 .gdbinit。脚本文件通常包含GDB命令,这些命令在GDB启动时自动执行,用于配置调试环境、设置断点、查看变量等。
我的.gdbinit文件内容如下:
set confirm off
set architecture riscv:rv64
target remote 127.0.0.1:25000
symbol-file kernel/kernel
set disassemble-next-line auto
set riscv use-compressed-breakpoints yes
这一系列命令是用于配置GDB(GNU Debugger)以进行RISC-V 64位架构(rv64)的目标程序调试的设置。以下是这些命令的含义:
- set confirm off:这个命令将GDB的确认提示设置为关闭。通常,当你执行一些可能影响程序执行的命令时,GDB会要求你确认。通过将确认关闭,可以在不需要确认的情况下执行这些命令。
- set architecture riscv:rv64:这个命令设置目标程序的体系结构为RISC-V 64位架构(rv64)。这告诉GDB,将要调试的程序是针对RISC-V 64位架构编译的。
- target remote 127.0.0.1:25000:这个命令告诉GDB要连接到本地IP地址 127.0.0.1 和端口号 25000 上的远程调试目标。这通常用于与调试代理或硬件调试器建立连接。这个端口可能不是总是 25000,设置要视情况而定(一般都不需要设定,自动生成)
- symbol-file kernel/kernel:这个命令指定了符号文件的路径,该符号文件与要调试的程序相关联。符号文件包含了程序的符号信息,如函数名称、变量名称等,可以帮助GDB更好地理解和调试程序。
- set disassemble-next-line auto:这个命令设置GDB在逐行反汇编时自动显示反汇编代码。这使得在单步执行时,GDB会显示每一行的反汇编指令,以便更容易理解程序的执行过程。
- set riscv use-compressed-breakpoints yes:这个命令启用了对RISC-V压缩指令集(Compressed Instructions)的断点支持。压缩指令集是RISC-V的一种特性,允许使用更紧凑的指令编码。启用这个选项后,GDB会使用压缩指令集来设置断点,以便与压缩指令集编译的程序一起工作。
在 gdb 窗口:
(gdb) b syscall
Breakpoint 1 at 0x8000203c: file kernel/syscall.c, line 133.
(gdb) c
Continuing.

Thread 1 hit Breakpoint 1, syscall ()
    at kernel/syscall.c:133
133     {
(gdb) layout src
(gdb) backtrace
上面的步骤产生的结果:
#0  syscall () at kernel/syscall.c:133
#1  0x0000000080001d70 in usertrap ()
    at kernel/trap.c:67
#2  0x0505050505050505 in ?? ()
接着单步运行到这一行代码:
(gdb) n
(gdb) n
(gdb) p/x *p
$2 = {lock = {locked = 0x0, name = 0x800081b8,
    cpu = 0x0}, state = 0x4, chan = 0x0, killed = 0x0,
  xstate = 0x0, pid = 0x1, parent = 0x0,
  kstack = 0x3fffffd000, sz = 0x1000,
  pagetable = 0x87f73000, trapframe = 0x87f74000,
  context = {ra = 0x800014c2, sp = 0x3fffffde80,
    s0 = 0x3fffffdeb0, s1 = 0x80008d70, s2 = 0x80008940,
    s3 = 0x1, s4 = 0x0, s5 = 0x3, s6 = 0x80019a10,
    s7 = 0x8, s8 = 0x80019b38, s9 = 0x4, s10 = 0x1,
    s11 = 0x0}, ofile = {0x0 <repeats 16 times>},
  cwd = 0x80016e80, name = {0x69, 0x6e, 0x69, 0x74,
    0x63, 0x6f, 0x64, 0x65, 0x0, 0x0, 0x0, 0x0, 0x0,
    0x0, 0x0, 0x0}}
现在检查这个值:p->trapframe->a7
What is the value of p->trapframe->a7 and what does that value represent? (Hint: look user/initcode.S, the first user program xv6 starts.)
(gdb) p p->trapframe->a7
$3 = 7
可以看到,a7 的值为 7。
研究一下 kernel/proc.h中的trapframe 结构体中的字段:
struct trapframe {
  /*   0 */ uint64 kernel_satp;   // kernel page table
  /*   8 */ uint64 kernel_sp;     // top of process's kernel stack
  /*  16 */ uint64 kernel_trap;   // usertrap()
  /*  24 */ uint64 epc;           // saved user program counter
  /*  32 */ uint64 kernel_hartid; // saved kernel tp
  /*  40 */ uint64 ra;
  /*  48 */ uint64 sp;
  /*  56 */ uint64 gp;
  /*  64 */ uint64 tp;
  /*  72 */ uint64 t0;
  /*  80 */ uint64 t1;
  /*  88 */ uint64 t2;
  /*  96 */ uint64 s0;
  /* 104 */ uint64 s1;
  /* 112 */ uint64 a0;
  /* 120 */ uint64 a1;
  /* 128 */ uint64 a2;
  /* 136 */ uint64 a3;
  /* 144 */ uint64 a4;
  /* 152 */ uint64 a5;
  /* 160 */ uint64 a6;
  /* 168 */ uint64 a7; // a7普普通通
  /* 176 */ uint64 s2;
  /* 184 */ uint64 s3;
  /* 192 */ uint64 s4;
  /* 200 */ uint64 s5;
  /* 208 */ uint64 s6;
  /* 216 */ uint64 s7;
  /* 224 */ uint64 s8;
  /* 232 */ uint64 s9;
  /* 240 */ uint64 s10;
  /* 248 */ uint64 s11;
  /* 256 */ uint64 t3;
  /* 264 */ uint64 t4;
  /* 272 */ uint64 t5;
  /* 280 */ uint64 t6;
};
再来看下 syscall.h:
// System call numbers
#define SYS_fork    1
#define SYS_exit    2
#define SYS_wait    3
#define SYS_pipe    4
#define SYS_read    5
#define SYS_kill    6
#define SYS_exec    7
#define SYS_fstat   8
#define SYS_chdir   9
#define SYS_dup    10
#define SYS_getpid 11
#define SYS_sbrk   12
#define SYS_sleep  13
#define SYS_uptime 14
#define SYS_open   15
#define SYS_write  16
#define SYS_mknod  17
#define SYS_unlink 18
#define SYS_link   19
#define SYS_mkdir  20
#define SYS_close  21
恍然大悟,原来 7 指的是 SYS_exec,这意味着它加下来运行系统调用了:
void
syscall(void)
{
  int num;
  struct proc *p = myproc();

  num = p->trapframe->a7;
  // num = *(int*) 0;
  if(num > 0 && num < NELEM(syscalls) && syscalls[num]) {
    // Use num to lookup the system call function for num, call it,
    // and store its return value in p->trapframe->a0
    p->trapframe->a0 = syscalls[num]();
  } else {
    printf("%d %s: unknown sys call %d\n",
            p->pid, p->name, num);
    p->trapframe->a0 = -1;
  }
}
What was the previous mode that the CPU was in?
查一下它运行前 CPU 的模式是什么:
(gdb) p/t $sstatus
$4 = 100010
**根据RISC-V特权指令,SPP位指示在进入监控模式之前执行的HART的权限级别。**创建陷阱时,如果陷阱源自用户模式,则 SPP 设置为 0,否则设置为 1。当执行 SRET 指令(请参阅第 3.3.2 节)以从陷阱处理程序返回时,如果 SPP 位为 0,则权限级别设置为用户模式,如果 SPP 位为 1,则设置为主管模式;然后将 SPP 设置为 0。
SPP 位的值为 0,表示进入内核进行系统调用之前的权限级别是用户模式。
根据RISC-V特权指令,SPP位指示在进入监控器模式之前执行的HART的权限级别。创建陷阱时,如果陷阱源自用户模式,则 SPP 设置为 0,否则设置为 1。当执行 SRET 指令从陷阱处理程序返回时,如果 SPP 位为 0,则权限级别设置为用户模式,如果 SPP 位为 1,则设置为主管模式;然后将 SPP 设置为 0。

如我们所见,SPP 位的值(从右向左数,第8位)为 0,表示进入内核进行系统调用之前的权限级别是用户模式。也就是说,该陷入是由用户造成的。
然后,将 kernel/syscall.c 中的语句num = p->trapframe->a7 换成 num = * (int *) 0执行以下命令:
$ make qemu
Write down the assembly instruction the kernel is panicing at. Which
register corresponds to the variable num?
直接出错:
xv6 kernel is booting

hart 2 starting
hart 1 starting
scause 0x000000000000000d
sepc=0x0000000080002050 stval=0x0000000000000000
panic: kerneltrap
我们在汇编代码中直接搜:80002050
 num = *(int*) 0;
    80002050:	00002683          	lw	a3,0(zero) # 0 <_entry-0x80000000>
可以看到,正是num = * (int *) 0语句导致了错误。它给了 num 一个错误的值。
Why does the kernel crash? Hint: look at figure 3-3 in the text; is address 0 mapped in the kernel address space? Is that confirmed by the value in scause above?
重新启动,在发生错误的位置设置断点:
Thread 1 received signal SIGINT, Interrupt.
panic (s=s@entry=0x800083c0 "kerneltrap")
    at kernel/printf.c:127
(gdb) p $scause
$1 = 13
根据 RISC-V privileged instructions,13 代表着页面加载错误。

重新启动,直接打印出内核 panic时地用户进程名字:
(gdb) b *0x0000000080002050
Breakpoint 1 at 0x80002050: file kernel/syscall.c, line 138.
(gdb) c
Continuing.
[Switching to Thread 1.3]

Thread 3 hit Breakpoint 1, syscall ()
    at kernel/syscall.c:138
138       num = *(int*) 0;
(gdb) p p->name
$1 = "initcode\000\000\000\000\000\000\000"
(gdb)
可以看出这个用户进程的名字是initcode,这是 xv6 中第一个运行的进程。
我们还可以看看这个进程的 proc structure 长什么样:
(gdb) p *p
$2 = {lock = {locked = 0,
    name = 0x800081b8 "proc", cpu = 0x0},
  state = RUNNING, chan = 0x0, killed = 0,
  xstate = 0, pid = 1, parent = 0x0,
  kstack = 274877894656, sz = 4096,
  pagetable = 0x87f73000,
  trapframe = 0x87f74000, context = {
    ra = 2147488962, sp = 274877898368,
    s0 = 274877898416, s1 = 2147519856,
    s2 = 2147518784, s3 = 1, s4 = 0, s5 = 3,
    s6 = 2147588624, s7 = 8, s8 = 2147588920,
    s9 = 4, s10 = 1, s11 = 0}, ofile = {
    0x0 <repeats 16 times>},
  cwd = 0x80016e80 <itable+24>,
  name = "initcode\000\000\000\000\000\000\000"}
从这个proc结构的信息中可以得出:
-
进程状态:state字段的值为RUNNING,表示这个进程的状态为运行中,即它当前正在执行。
-
进程标识:pid字段的值为1,表示这是一个进程的唯一标识符。通常情况下,进程的第一个进程(通常是init进程)的pid为1。
-
父进程:parent字段的值为0x0,表示这个进程没有父进程。这在操作系统中的进程树中通常是初始进程(init)的情况。
-
进程内存信息:sz字段的值为4096,表示这个进程的内存大小为4096字节。
-
页表信息:pagetable字段的值为0x87f73000,表示这个进程的页表的地址。
-
陷阱帧信息:trapframe字段的值为0x87f74000,表示这个进程的陷阱帧(trap frame)的地址。陷阱帧通常包含了在进程执行时发生陷阱或异常时的寄存器状态等信息。
-
上下文信息:context字段包含了一系列寄存器的值,包括返回地址(ra)、栈指针(sp)、一般寄存器(s0到s11)等。这些寄存器状态可能用于在进程切换或陷阱处理中。
-
当前工作目录:cwd字段的值为0x80016e80,表示当前工作目录的地址。这是进程在执行时的当前工作目录。
-
进程名:name字段的值为 “initcode”,表示这个进程的名字是 “initcode”。
二、System call tracing (moderate)
Question requirements
In this assignment you will add a system call tracing feature that may help you when debugging later labs. You’ll create a new trace system call that will control tracing. It should take one argument, an integer “mask”, whose bits specify which system calls to trace. For example, to trace the fork system call, a program calls trace(1 << SYS_fork), where SYS_fork is a syscall number from kernel/syscall.h. You have to modify the xv6 kernel to print out a line when each system call is about to return, if the system call’s number is set in the mask. The line should contain the process id, the name of the system call and the return value; you don’t need to print the system call arguments. The trace system call should enable tracing for the process that calls it and any children that it subsequently forks, but should not affect other processes.
Some hints
- Add $U/_trace to UPROGS in Makefile
- Run make qemu and you will see that the compiler cannot compile user/trace.c, because the user-space stubs for the system call don’t exist yet: add a prototype for the system call to user/user.h, a stub to user/usys.pl, and a syscall number to kernel/syscall.h. The Makefile invokes the perl script user/usys.pl, which produces user/usys.S, the actual system call stubs, which use the RISC-V ecall instruction to transition to the kernel. Once you fix the compilation issues, run trace 32 grep hello README; it will fail because you haven’t implemented the system call in the kernel yet.
- Add a sys_trace() function in kernel/sysproc.c that implements the new system call by remembering its argument in a new variable in the proc structure (see kernel/proc.h). The functions to retrieve system call arguments from user space are in kernel/syscall.c, and you can see examples of their use in kernel/sysproc.c.
- Modify fork() (see kernel/proc.c) to copy the trace mask from the parent to the child process.
- Modify the syscall() function in kernel/syscall.c to print the trace output. You will need to add an array of syscall names to index into.
- If a test case passes when you run it inside qemu directly but you get a timeout when running the tests using make grade, try testing your implementation on Athena. Some of tests in this lab can be a bit too computationally intensive for your local machine (especially if you use WSL).
只需要沿着步骤就可以完成这个实验:
1. Add $U/_trace\ to UPROGS in Makefile
UPROGS=\
	...
	$U/_zombie\
	$U/_trace\
2. Add a prototype for the system call to user/user.h, a stub to user/usys.pl, and a syscall number to kernel/syscall.h.
// user/user.h
// system calls
...
int uptime(void);
int trace(int);
// user/usys.pl
...
entry("uptime");
entry("trace");
// kernel/syscall.h
// System call numbers
...
#define SYS_close  21
#define SYS_trace  22
3. Add a sys_trace() function in kernel/sysproc.c that implements the new system call by remembering its argument in a new variable in the proc structure (see kernel/proc.h). The functions to retrieve system call arguments from user space are in kernel/syscall.c, and you can see examples of their use in kernel/sysproc.c.
// kernel/proc.h
// Per-process state
struct proc {
  ...
  char name[16];               // Process name (debugging)
  uint64 syscall_trace;
};
// kernel/sysproc.c
uint64
sys_trace(void)
{
  int mask;
  argint(0, &mask);
  myproc()->syscall_trace = mask;
  return 0;
}
4. Modify fork in kernel/proc.c to copy the trace mask from the parent to the child process.
int
fork(void)
{
  ...
  safestrcpy(np->name, p->name, sizeof(p->name));
  np->syscall_trace = p->syscall_trace;
  pid = np->pid;
  ...
}
5. Modify the syscall function in kernel/syscall.c to print the trace output.
// Prototypes for the functions that handle system calls.
...
extern uint64 sys_close(void);
extern uint64 sys_trace(void);

// An array mapping syscall numbers from syscall.h
// to the function that handles the system call.
static uint64 (*syscalls[])(void) = {
...
[SYS_close]   sys_close,
[SYS_trace]   sys_trace,
};

// 添加识别名
char* syscalls_name[23] = {"", "fork", "exit", "wait", "pipe", "read", "kill", "exec",
                      "fstat", "chdir", "dup", "getpid", "sbrk", "sleep", "uptime",
                      "open", "write", "mknod", "unlink", "link", "mkdir", "close", "trace"};

void
syscall(void)
{
  ...
  num = p->trapframe->a7;
  if(num > 0 && num < NELEM(syscalls) && syscalls[num]) {
    // Use num to lookup the system call function for num, call it,
    // and store its return value in p->trapframe->a0
    p->trapframe->a0 = syscalls[num]();
    if (p->syscall_trace & (1 << num)) {
    // print trace info
      printf("%d: syscall %s -> %d\n",p->pid, syscalls_name[num], p->trapframe->a0);
    }
}
做到这里,就可以测试了:
root@*******:~/xv6-labs-2023# ./grade-lab-syscall trace
make: 'kernel/kernel' is up to date.
== Test trace 32 grep == trace 32 grep: OK (3.2s)
== Test trace all grep == trace all grep: OK (0.8s)
== Test trace nothing == trace nothing: OK (1.0s)
== Test trace children == trace children: OK (27.2s)
root@iZhp37m9qv6vg0r4zidw3oZ:~/xv6-labs-2023#
可以看到全部通过了测试。
但是依然需要回答一些问题:
Q1: usys.pl是什么文件?
usys.pl 是一个Perl脚本文件,用于生成名为 usys.S 的汇编语言源代码文件。这个脚本的目的是生成系统调用的存根(stubs),以便操作系统内核能够处理用户空间程序的系统调用请求。
具体来说,这个Perl脚本执行以下操作:
定义一个名为 entry 的Perl子例程,该子例程接受系统调用的名称作为参数,并生成与该系统调用相关的汇编代码。
使用 print 命令输出汇编代码,包括 .global 声明和汇编指令,以将系统调用名称与系统调用号码进行映射,并触发 ecall 指令以执行系统调用。
为一系列系统调用(如 fork、exit、read 等等)调用 entry 子例程,以生成相应的汇编代码。
输出注释,指出该文件是由 usys.pl 自动生成的,不应手动编辑。
生成的 usys.S 文件通常将作为操作系统内核的一部分,用于处理用户空间程序发起的系统调用请求。这种自动生成的方式可以确保系统调用存根的正确性,并简化了内核的开发和维护过程。
再来看看这个usys.S:
.global trace
trace:
 li a7, SYS_trace
 ecall
 ret
li a7, SYS_trace:这行代码将立即数 SYS_trace 加载到寄存器 a7 中。a7 寄存器通常用于存储系统调用号码,而 SYS_trace 是一个代表系统调用的符号常量,通常在C代码中定义,用于标识系统调用的类型。
ecall:这是一个特权指令,用于触发系统调用。当执行 ecall 指令时,处理器将进入特权模式(通常是监管模式),并跳转到操作系统内核中的相应系统调用处理程序。系统调用号码 a7 指示了要执行的系统调用类型。
ret:这是一个返回指令,用于返回到调用者的代码。在系统调用完成后,处理器会执行 ret 指令,将控制权返回给调用 SYS_trace 系统调用的代码。
Q2: 从用户态到内核态运行一个系统调用的过程大致是怎么样的?
用户态调用:在用户态运行的程序需要执行一个系统调用时,它会调用一个包含系统调用号码和参数的库函数,例如C库中的syscall函数。
void syscall(void) {
  int num;
  struct proc *p = myproc();
  num = p->trapframe->a7;
  if(num > 0 && num < NELEM(syscalls) && syscalls[num]) {
    // 用 num 来查阅指向系统调用的函数入口
    // p->trapframe->a0 来保存系统调用的返回值
    p->trapframe->a0 = syscalls[num]();
    if(p->syscall_trace & (1 << num)){
    // 将 1 左移 num 位,然后与p->syscall_trace 进行与运算,判断是否满足某个条件
      printf("%d: syscall %s -> %d\n",p->pid, syscalls_name[num], p->trapframe->a0);
    }
  } else {
    printf("%d %s: unknown sys call %d\n",
            p->pid, p->name, num);
    p->trapframe->a0 = -1;
  }
}
系统调用号码:库函数会将系统调用号码和参数加载到寄存器中,通常使用a7寄存器(或者其他体系结构中的类似寄存器),其中a7用于存储系统调用号码。
触发系统调用:用户态程序执行特殊的指令,例如ecall(在RISC-V架构中)或int 0x80(在x86架构中)。这些指令触发了从用户态到内核态的切换,将控制权传递给操作系统内核。
切换到内核态:当发生系统调用指令时,处理器将当前的用户态上下文保存到特定的寄存器或内存区域中,包括程序计数器(PC)和用户态栈指针(SP)。然后,处理器切换到内核态,切换到操作系统内核的地址空间。
系统调用处理:操作系统内核根据系统调用号码确定要执行的系统调用,并使用传递的参数执行相应的操作。这可能涉及到访问硬件资源、文件系统、网络等等。内核执行完成后,将结果存储在适当的寄存器或内存位置。
返回用户态:内核执行完系统调用后,将保存的用户态上下文恢复回处理器,包括将用户态栈指针(SP)和程序计数器(PC)还原到之前保存的值。然后,处理器切换回用户态,并继续执行用户程序,返回到调用系统调用的下一条指令。
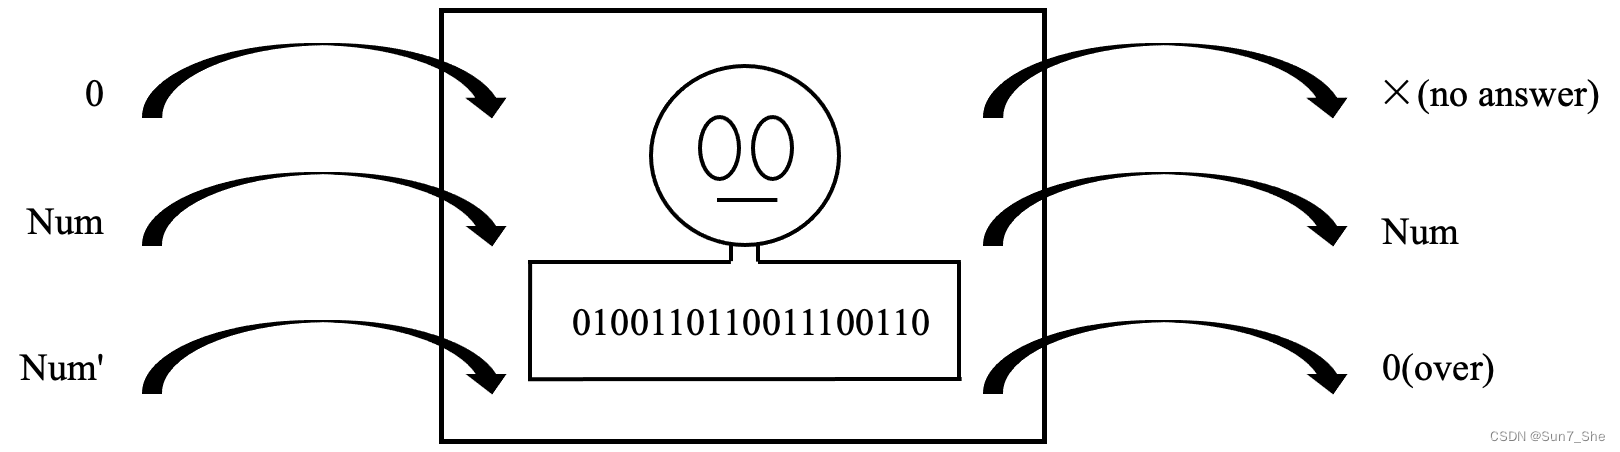
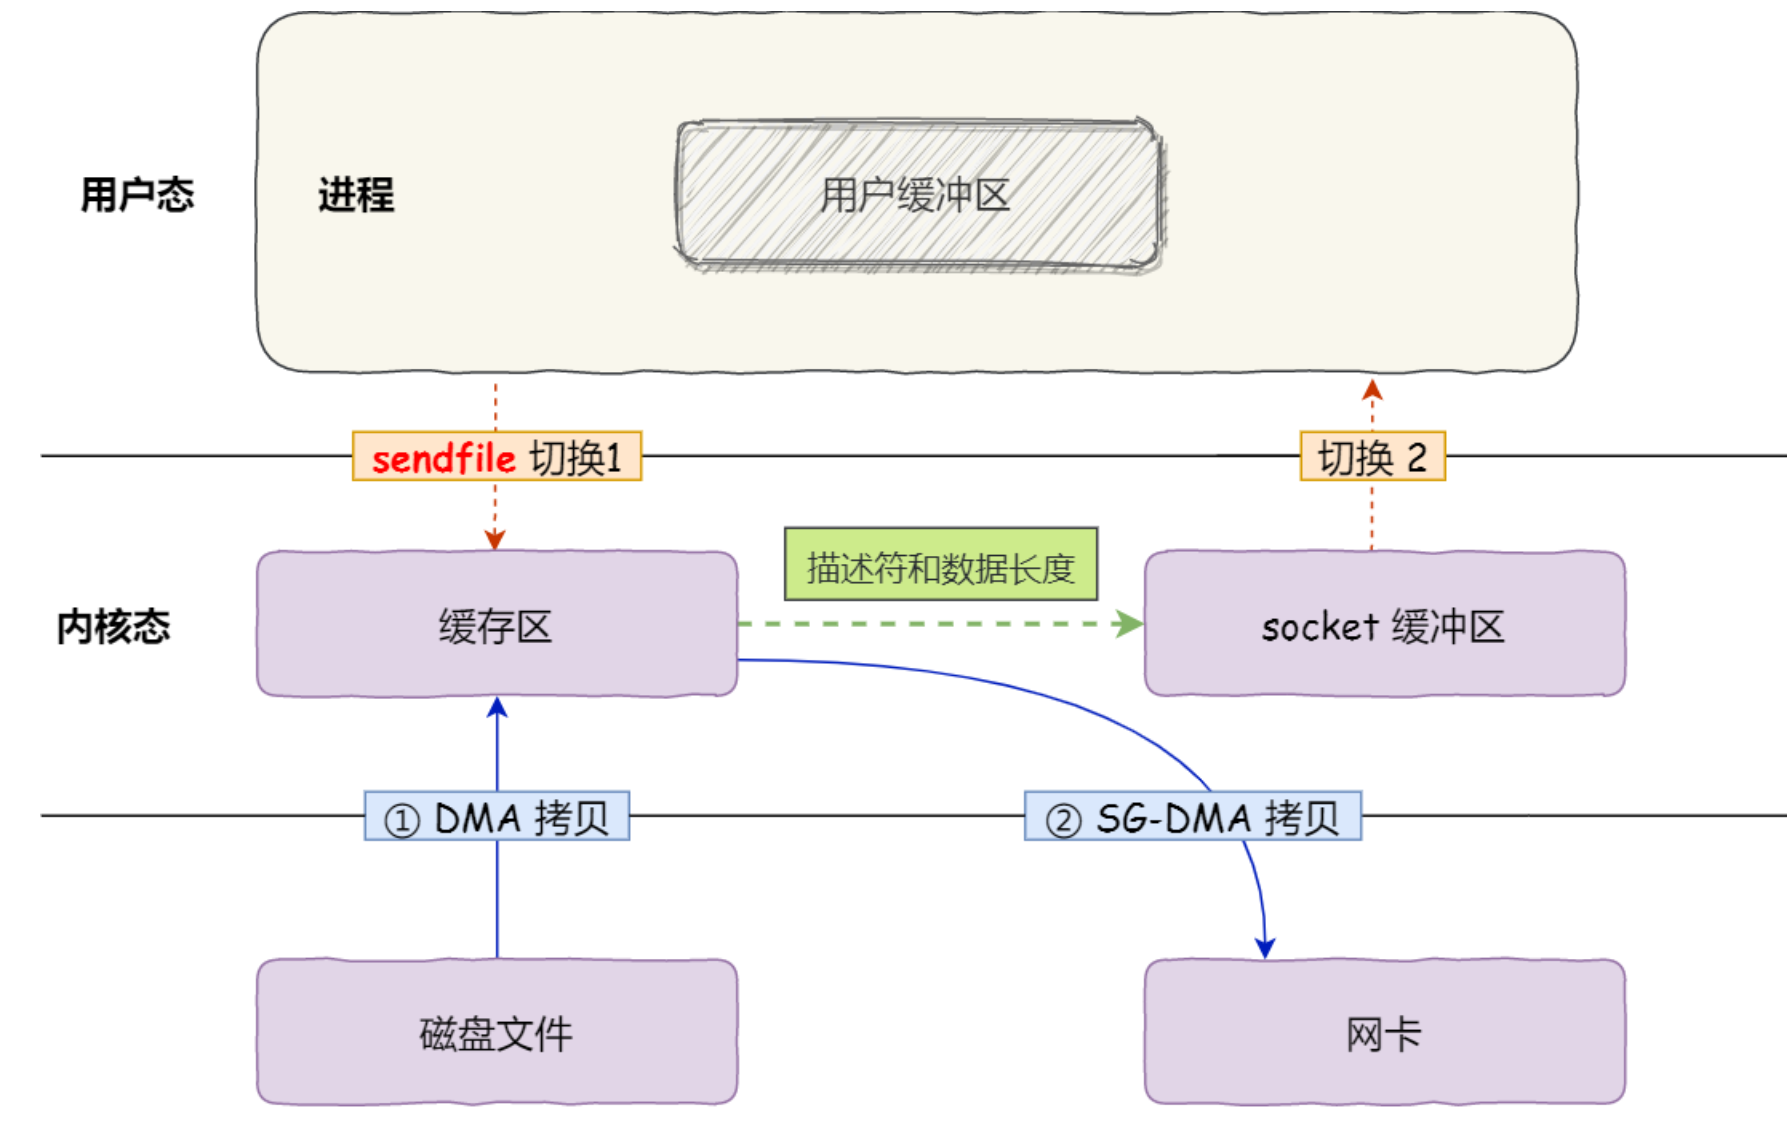
xv6 的系统调用过程大致如下所示:

三、Sysinfo (moderate)
Question requirements
In this assignment you will add a system call, sysinfo, that collects information about the running system. The system call takes one argument: a pointer to a struct sysinfo (see kernel/sysinfo.h). The kernel should fill out the fields of this struct: the freemem field should be set to the number of bytes of free memory, and the nproc field should be set to the number of processes whose state is not UNUSED. We provide a test program sysinfotest; you pass this assignment if it prints “sysinfotest: OK”.
Some hints
- Add $U/_sysinfotest to UPROGS in Makefile
- Run make qemu; user/sysinfotest.c will fail to compile. Add the system call sysinfo, following the same steps as in the previous assignment. To declare the prototype for sysinfo() in user/user.h you need predeclare the existence of struct sysinfo:
struct sysinfo; int sysinfo(struct sysinfo *);- Once you fix the compilation issues, run sysinfotest; it will fail because you haven’t implemented the system call in the kernel yet.
sysinfo needs to copy a struct sysinfo back to user space; see sys_fstat() (kernel/sysfile.c) and filestat() (kernel/file.c) for examples of how to do that using copyout().- To collect the amount of free memory, add a function to kernel/kalloc.c
- To collect the number of processes, add a function to kernel/proc.c
1. Add $U/_sysinfotest\ to UPROGS in Makefile.
UPROGS=\
	...
	$U/_trace\
	$U/_sysinfotest\
2. Add a prototype for the system call to user/user.h, a stub to user/usys.pl, and a syscall number to kernel/syscall.h.
// user/user.h
// system calls
...
int trace(int);
struct sysinfo;
int sysinfo(struct sysinfo *);
// user/usys.pl
...
entry("trace");
entry("sysinfo");
// kernel/syscall.h
// System call numbers
...
#define SYS_trace   22
#define SYS_sysinfo 23
3. Add a sys_sysinfo function in kernel/sysproc.c that copies a struct sysinfo back to user space.
// kernel/sysproc.c
...
#include "proc.h"
#include "sysinfo.h"
...
uint64
sys_info(void)
{
  uint64 addr;
  argaddr(0, &addr);

  struct sysinfo sinfo;
  sinfo.freemem = freemem_size();
  sinfo.nproc = count_proc();
  if (copyout(myproc()->pagetable, addr, (char *)&sinfo, sizeof(sinfo)) < 0)
    return -1;
  return 0;
}
4. Update the array of syscall names to index into in kernel/syscall.c.
// Prototypes for the functions that handle system calls.
...
extern uint64 sys_trace(void);
extern uint64 sys_info(void);

// An array mapping syscall numbers from syscall.h
// to the function that handles the system call.
static uint64 (*syscalls[])(void) = {
...
[SYS_trace]   sys_trace,
[SYS_sysinfo] sys_info,
};

const char *syscall_names[] = {
...
[SYS_trace]   "trace",
[SYS_sysinfo] "sysinfo",
};
5. Add a function to kernel/kalloc.c to collect the amount of free memory.
uint64
freemem_size(void)
{
  acquire(&kmem.lock); // prevent race condition

  uint64 size = 0;
  struct run *r = kmem.freelist;
  while (r) {
    size++;
    r = r->next;
  }

  release(&kmem.lock);

  return size * PGSIZE;
}
6. Add a function to kernel/proc.c to collect the number of processes.
uint64
count_proc(void)
{
  uint64 cnt = 0;
  for (int i = 0; i < NPROC; ++i) {
    if (proc[i].state != UNUSED) {
      cnt++;
    }
  }
  return cnt;
}
把系统调用的 helper 函数放进去:
// kalloc.c
...
void            kinit(void);
uint64          freemem_size(void);
...
// proc.c
...
uint64          count_proc(void);
四、测试
root@********:~/xv6-labs-2023# ./grade-lab-syscall
make: 'kernel/kernel' is up to date.
== Test answers-syscall.txt ==
answers-syscall.txt: OK
== Test trace 32 grep == trace 32 grep: OK (1.8s)
== Test trace all grep == trace all grep: OK (1.0s)
== Test trace nothing == trace nothing: OK (1.0s)
== Test trace children == trace children: OK (25.3s)
== Test sysinfotest == sysinfotest: OK (3.9s)
== Test time ==
time: OK
Score: 40/40
root@iZhp37m9qv6vg0r4zidw3oZ:~/xv6-labs-2023#