介绍
主要介绍qcustomplot及其用法
最新版本:QCustomPlot Patch Release 2.1.1//November 6, 2022
下载:https://www.qcustomplot.com/index.php/download
官网:https://www.qcustomplot.com/index.php
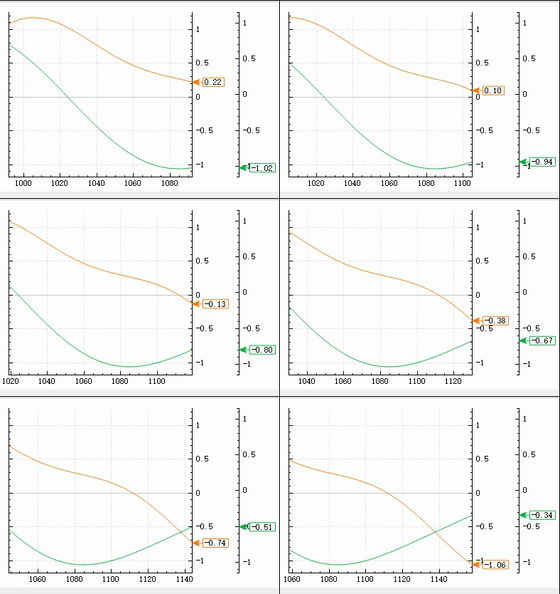
简单使用
mainwindow.h
/***************************************************************************
**                                                                        **
**  QCustomPlot, an easy to use, modern plotting widget for Qt            **
**  Copyright (C) 2011-2022 Emanuel Eichhammer                            **
**                                                                        **
**  This program is free software: you can redistribute it and/or modify  **
**  it under the terms of the GNU General Public License as published by  **
**  the Free Software Foundation, either version 3 of the License, or     **
**  (at your option) any later version.                                   **
**                                                                        **
**  This program is distributed in the hope that it will be useful,       **
**  but WITHOUT ANY WARRANTY; without even the implied warranty of        **
**  MERCHANTABILITY or FITNESS FOR A PARTICULAR PURPOSE.  See the         **
**  GNU General Public License for more details.                          **
**                                                                        **
**  You should have received a copy of the GNU General Public License     **
**  along with this program.  If not, see http://www.gnu.org/licenses/.   **
**                                                                        **
****************************************************************************
**           Author: Emanuel Eichhammer                                   **
**  Website/Contact: https://www.qcustomplot.com/                         **
**             Date: 06.11.22                                             **
**          Version: 2.1.1                                                **
****************************************************************************/

/************************************************************************************************************
**                                                                                                         **
**  This is the example code for QCustomPlot.                                                              **
**                                                                                                         **
**  It demonstrates basic and some advanced capabilities of the widget. The interesting code is inside     **
**  the "setup(...)Demo" functions of MainWindow.                                                          **
**                                                                                                         **
**  In order to see a demo in action, call the respective "setup(...)Demo" function inside the             **
**  MainWindow constructor. Alternatively you may call setupDemo(i) where i is the index of the demo       **
**  you want (for those, see MainWindow constructor comments). All other functions here are merely a       **
**  way to easily create screenshots of all demos for the website. I.e. a timer is set to successively     **
**  setup all the demos and make a screenshot of the window area and save it in the ./screenshots          **
**  directory.                                                                                             **
**                                                                                                         **
*************************************************************************************************************/

#ifndef MAINWINDOW_H
#define MAINWINDOW_H

#include <QMainWindow>
#include <QTimer>
#include "../../qcustomplot.h" // the header file of QCustomPlot. Don't forget to add it to your project, if you use an IDE, so it gets compiled.

namespace Ui {

class MainWindow;
}

class MainWindow : public QMainWindow
{

  Q_OBJECT

public:
  explicit MainWindow(QWidget *parent = 0);
  ~MainWindow();

  void setupDemo(int demoIndex);
  void setupQuadraticDemo(QCustomPlot *customPlot);
  void setupSimpleDemo(QCustomPlot *customPlot);
  void setupSincScatterDemo(QCustomPlot *customPlot);
  void setupScatterStyleDemo(QCustomPlot *customPlot);
  void setupLineStyleDemo(QCustomPlot *customPlot);
  void setupScatterPixmapDemo(QCustomPlot *customPlot);
  void setupDateDemo(QCustomPlot *customPlot);
  void setupTextureBrushDemo(QCustomPlot *customPlot);
  void setupMultiAxisDemo(QCustomPlot *customPlot);
  void setupLogarithmicDemo(QCustomPlot *customPlot);
  void setupRealtimeDataDemo(QCustomPlot *customPlot);
  void setupParametricCurveDemo(QCustomPlot *customPlot);
  void setupBarChartDemo(QCustomPlot *customPlot);
  void setupStatisticalDemo(QCustomPlot *customPlot);
  void setupSimpleItemDemo(QCustomPlot *customPlot);
  void setupItemDemo(QCustomPlot *customPlot);
  void setupStyledDemo(QCustomPlot *customPlot);
  void setupAdvancedAxesDemo(QCustomPlot *customPlot);
  void setupColorMapDemo(QCustomPlot *customPlot);
  void setupFinancialDemo(QCustomPlot *customPlot);
  void setupPolarPlotDemo(QCustomPlot *customPlot);

  void setupPlayground(QCustomPlot *customPlot);

private slots:
  void realtimeDataSlot();
  void bracketDataSlot();
  void screenShot();
  void allScreenShots();

private:
  Ui::MainWindow *ui;
  QString demoName;
  QTimer dataTimer;
  QCPItemTracer *itemDemoPhaseTracer;
  int currentDemoIndex;
};

#endif // MAINWINDOW_H
mainwindow.cpp
/***************************************************************************
**                                                                        **
**  QCustomPlot, an easy to use, modern plotting widget for Qt            **
**  Copyright (C) 2011-2022 Emanuel Eichhammer                            **
**                                                                        **
**  This program is free software: you can redistribute it and/or modify  **
**  it under the terms of the GNU General Public License as published by  **
**  the Free Software Foundation, either version 3 of the License, or     **
**  (at your option) any later version.                                   **
**                                                                        **
**  This program is distributed in the hope that it will be useful,       **
**  but WITHOUT ANY WARRANTY; without even the implied warranty of        **
**  MERCHANTABILITY or FITNESS FOR A PARTICULAR PURPOSE.  See the         **
**  GNU General Public License for more details.                          **
**                                                                        **
**  You should have received a copy of the GNU General Public License     **
**  along with this program.  If not, see http://www.gnu.org/licenses/.   **
**                                                                        **
****************************************************************************
**           Author: Emanuel Eichhammer                                   **
**  Website/Contact: https://www.qcustomplot.com/                         **
**             Date: 06.11.22                                             **
**          Version: 2.1.1                                                **
****************************************************************************/

/************************************************************************************************************
**                                                                                                         **
**  This is the example code for QCustomPlot.                                                              **
**                                                                                                         **
**  It demonstrates basic and some advanced capabilities of the widget. The interesting code is inside     **
**  the "setup(...)Demo" functions of MainWindow.                                                          **
**                                                                                                         **
**  In order to see a demo in action, call the respective "setup(...)Demo" function inside the             **
**  MainWindow constructor. Alternatively you may call setupDemo(i) where i is the index of the demo       **
**  you want (for those, see MainWindow constructor comments). All other functions here are merely a       **
**  way to easily create screenshots of all demos for the website. I.e. a timer is set to successively     **
**  setup all the demos and make a screenshot of the window area and save it in the ./screenshots          **
**  directory.                                                                                             **
**                                                                                                         **
*************************************************************************************************************/

#include "mainwindow.h"
#include "ui_mainwindow.h"
#include <QDebug>
#if QT_VERSION < QT_VERSION_CHECK(6, 0, 0)
#  include <QDesktopWidget>
#endif
#include <QScreen>
#include <QMessageBox>
#include <QMetaEnum>

MainWindow::MainWindow(QWidget *parent) :
  QMainWindow(parent),
  ui(new Ui::MainWindow)
{

  ui->setupUi(this);
  setGeometry(400, 250, 542, 390);

  setupDemo(0);
  //setupPlayground(ui->customPlot);
  // 0:  setupQuadraticDemo(ui->customPlot);
  // 1:  setupSimpleDemo(ui->customPlot);
  // 2:  setupSincScatterDemo(ui->customPlot);
  // 3:  setupScatterStyleDemo(ui->customPlot);
  // 4:  setupScatterPixmapDemo(ui->customPlot);
  // 5:  setupLineStyleDemo(ui->customPlot);
  // 6:  setupDateDemo(ui->customPlot);
  // 7:  setupTextureBrushDemo(ui->customPlot);
  // 8:  setupMultiAxisDemo(ui->customPlot);
  // 9:  setupLogarithmicDemo(ui->customPlot);
  // 10: setupRealtimeDataDemo(ui->customPlot);
  // 11: setupParametricCurveDemo(ui->customPlot);
  // 12: setupBarChartDemo(ui->customPlot);
  // 13: setupStatisticalDemo(ui->customPlot);
  // 14: setupSimpleItemDemo(ui->customPlot);
  // 15: setupItemDemo(ui->customPlot);
  // 16: setupStyledDemo(ui->customPlot);
  // 17: setupAdvancedAxesDemo(ui->customPlot);
  // 18: setupColorMapDemo(ui->customPlot);
  // 19: setupFinancialDemo(ui->customPlot);
  // 20: setupPolarPlotDemo(ui->customPlot);

  // for making screenshots of the current demo or all demos (for website screenshots):
  //QTimer::singleShot(1500, this, SLOT(allScreenShots()));
  //QTimer::singleShot(4000, this, SLOT(screenShot()));
}

void MainWindow::setupDemo(int demoIndex)
{

  switch (demoIndex)
  {

    case 0:  setupQuadraticDemo(ui->customPlot); break;
    case 1:  setupSimpleDemo(ui->customPlot); break;
    case 2:  setupSincScatterDemo(ui->customPlot); break;
    case 3:  setupScatterStyleDemo(ui->customPlot); break;
    case 4:  setupScatterPixmapDemo(ui->customPlot); break;
    case 5:  setupLineStyleDemo(ui->customPlot); break;
    case 6:  setupDateDemo(ui->customPlot); break;
    case 7:  setupTextureBrushDemo(ui->customPlot); break;
    case 8:  setupMultiAxisDemo(ui->customPlot); break;
    case 9:  setupLogarithmicDemo(ui->customPlot); break;
    case 10: setupRealtimeDataDemo(ui->customPlot); break;
    case 11: setupParametricCurveDemo(ui->customPlot); break;
    case 12: setupBarChartDemo(ui->customPlot); break;
    case 13: setupStatisticalDemo(ui->customPlot); break;
    case 14: setupSimpleItemDemo(ui->customPlot); break;
    case 15: setupItemDemo(ui->customPlot); break;
    case 16: setupStyledDemo(ui->customPlot); break;
    case 17: setupAdvancedAxesDemo(ui->customPlot); break;
    case 18: setupColorMapDemo(ui->customPlot); break;
    case 19: setupFinancialDemo(ui->customPlot); break;
    case 20: setupPolarPlotDemo(ui->customPlot); break;
  }
  setWindowTitle("QCustomPlot: "+demoName);
  statusBar()->clearMessage();
  currentDemoIndex = demoIndex;
  ui->customPlot->replot();
}

void MainWindow::setupQuadraticDemo(QCustomPlot *customPlot)
{

  demoName = "Quadratic Demo";
  // generate some data:
  QVector<double> x(101), y(101); // initialize with entries 0..100
  for (int i=0; i<101; ++i)
  {

    x[i] = i/50.0 - 1; // x goes from -1 to 1
    y[i] = x[i]*x[i];  // let's plot a quadratic function
  }
  // create graph and assign data to it:
  customPlot->addGraph();
  customPlot->graph(0)->setData(x, y);
  // give the axes some labels:
  customPlot->xAxis->setLabel("x");
  customPlot->yAxis->setLabel("y");
  // set axes ranges, so we see all data:
  customPlot->xAxis->setRange(-1, 1);
  customPlot->yAxis->setRange(0, 1);
}

void MainWindow::setupSimpleDemo(QCustomPlot *customPlot)
{

  demoName = "Simple Demo";

  // add two new graphs and set their look:
  customPlot->addGraph();
  customPlot->graph(0)->setPen(QPen(Qt::blue)); // line color blue for first graph
  customPlot->graph(0)->setBrush(QBrush(QColor(0, 0, 255, 20))); // first graph will be filled with translucent blue
  customPlot->addGraph();
  customPlot->graph(1)->setPen(QPen(Qt::red)); // line color red for second graph
  // generate some points of data (y0 for first, y1 for second graph):
  QVector<double> x(251), y0(251), y1(251);
  for (int i=0; i<251; ++i)
  {

    x[i] = i;
    y0[i] = qExp(-i/150.0)*qCos(i/10.0); // exponentially decaying cosine
    y1[i] = qExp(-i/150.0);              // exponential envelope
  }
  // configure right and top axis to show ticks but no labels:
  // (see QCPAxisRect::setupFullAxesBox for a quicker method to do this)
  customPlot->xAxis2->setVisible(true);
  customPlot->xAxis2->setTickLabels(false);
  customPlot->yAxis2->setVisible(true);
  customPlot->yAxis2->setTickLabels(false);
  // make left and bottom axes always transfer their ranges to right and top axes:
  connect(customPlot->xAxis, SIGNAL(rangeChanged(QCPRange)), customPlot->xAxis2, SLOT(setRange(QCPRange)));
  connect(customPlot->yAxis, SIGNAL(rangeChanged(QCPRange)), customPlot->yAxis2, SLOT(setRange(QCPRange)));
  // pass data points to graphs:
  customPlot->graph(0)->setData(x, y0);
  customPlot->graph(1)->setData(x, y1);
  // let the ranges scale themselves so graph 0 fits perfectly in the visible area:
  customPlot->graph(0)->rescaleAxes();
  // same thing for graph 1, but only enlarge ranges (in case graph 1 is smaller than graph 0):
  customPlot->graph(1)->rescaleAxes(true);
  // Note: we could have also just called customPlot->rescaleAxes(); instead
  // Allow user to drag axis ranges with mouse, zoom with mouse wheel and select graphs by clicking:
  customPlot->setInteractions(QCP::iRangeDrag | QCP::iRangeZoom | QCP::iSelectPlottables);
}

void MainWindow::setupSincScatterDemo(QCustomPlot *customPlot)
{

  demoName = "Sinc Scatter Demo";
  customPlot->legend->setVisible(true);
  customPlot->legend->setFont(QFont("Helvetica",9));
  // set locale to english, so we get english decimal separator:
  customPlot->setLocale(QLocale(QLocale::English, QLocale::UnitedKingdom));
  // add confidence band graphs:
  customPlot->addGraph();
  QPen pen;
  pen.setStyle(Qt::DotLine);
  pen.setWidth(1);
  pen.setColor(QColor(180,180,180));
  customPlot->graph(0)->setName("Confidence Band 68%");
  customPlot->graph(0)->setPen(pen);
  customPlot->graph(0)->setBrush(QBrush(QColor(255,50,30,20)));
  customPlot->addGraph();
  customPlot->legend->removeItem(customPlot->legend->itemCount()-1); // don't show two confidence band graphs in legend
  customPlot->graph(1)->setPen(pen);
  customPlot->graph(0)->setChannelFillGraph(customPlot->graph(1));
  // add theory curve graph:
  customPlot->addGraph();
  pen.setStyle(Qt::DashLine);
  pen.setWidth(2);
  pen.setColor(Qt::red);
  customPlot->graph(2)->setPen(pen);
  customPlot->graph(2)->setName("Theory Curve");
  // add data point graph:
  customPlot->addGraph();
  customPlot->graph(3)->setPen(QPen(Qt::blue));
  customPlot->graph(3)->setName("Measurement");
  customPlot->graph(3)->setLineStyle(QCPGraph::lsNone);
  customPlot->graph(3)->setScatterStyle(QCPScatterStyle(QCPScatterStyle::ssCross, 4));
  // add error bars:
  QCPErrorBars *errorBars = new QCPErrorBars(customPlot->xAxis, customPlot->yAxis);
  errorBars->removeFromLegend();
  errorBars->setAntialiased(false);
  errorBars->setDataPlottable(customPlot->graph(3));
  errorBars->setPen(QPen(QColor(180,180,180)));

  // generate ideal sinc curve data and some randomly perturbed data for scatter plot:
  QVector<double> x0(250), y0(250);
  QVector<double> yConfUpper(250), yConfLower(250);
  for (int i=0; i<250; ++i)
  {

    x0[i] = (i/249.0-0.5)*30+0.01; // by adding a small offset we make sure not do divide by zero in next code line
    y0[i] = qSin(x0[i])/x0[i]; // sinc function
    yConfUpper[i] = y0[i]+0.15;
    yConfLower[i] = y0[i]-0.15;
    x0[i] *= 1000;
  }
  QVector<double> x1(50), y1(50), y1err(50);
  for (int i=0; i<50; ++i)
  {

    // generate a gaussian distributed random number:
    double tmp1 = rand()/(double)RAND_MAX;
    double tmp2 = rand()/(double)RAND_MAX;
    double r = qSqrt(-2*qLn(tmp1))*qCos(2*M_PI*tmp2); // box-muller transform for gaussian distribution
    // set y1 to value of y0 plus a random gaussian pertubation:
    x1[i] = (i/50.0-0.5)*30+0.25;
    y1[i] = qSin(x1[i])/x1[i]+r*0.15;
    x1[i] *= 1000;
    y1err[i] = 0.15;
  }
  // pass data to graphs and let QCustomPlot determine the axes ranges so the whole thing is visible:
  customPlot->graph(0)->setData(x0, yConfUpper);
  customPlot->graph(1)->setData(x0, yConfLower);
  customPlot->graph(2)->setData(x0, y0);
  customPlot->graph(3)->setData(x1, y1);
  errorBars->setData(y1err);
  customPlot->graph(2)->rescaleAxes();
  customPlot->graph(3)->rescaleAxes(true);
  // setup look of bottom tick labels:
  customPlot->xAxis->setTickLabelRotation(30);
  customPlot->xAxis->ticker()->setTickCount(9);
  customPlot->xAxis->setNumberFormat("ebc");
  customPlot->xAxis->setNumberPrecision(1);
  customPlot->xAxis->moveRange(-10);
  // make top right axes clones of bottom left axes. Looks prettier:
  customPlot->axisRect()->setupFullAxesBox();
}

void MainWindow::setupScatterStyleDemo(QCustomPlot *customPlot)
{

  demoName = "Scatter Style Demo";
  customPlot->legend->setVisible(true);
  customPlot->legend->setFont(QFont("Helvetica", 9));
  customPlot->legend->setRowSpacing(-3);
  QVector<QCPScatterStyle::ScatterShape> shapes;
  shapes << QCPScatterStyle::ssCross;
  shapes << QCPScatterStyle::ssPlus;
  shapes << QCPScatterStyle::ssCircle;
  shapes << QCPScatterStyle::ssDisc;
  shapes << QCPScatterStyle::ssSquare;
  shapes << QCPScatterStyle::ssDiamond;
  shapes << QCPScatterStyle::ssStar;
  shapes << QCPScatterStyle::ssTriangle;
  shapes << QCPScatterStyle::ssTriangleInverted;
  shapes << QCPScatterStyle::ssCrossSquare;
  shapes << QCPScatterStyle::ssPlusSquare;
  shapes << QCPScatterStyle::ssCrossCircle;
  shapes << QCPScatterStyle::ssPlusCircle;
  shapes << QCPScatterStyle::ssPeace;
  shapes << QCPScatterStyle::ssCustom;

  QPen pen;
  // add graphs with different scatter styles:
  for (int i=0; i<shapes.size(); ++i)
  {

    customPlot->addGraph();
    pen.setColor(QColor(qSin(i*0.3)*100+100, qSin(i*0.6+0.7)*100+100, qSin(i*0.4+0.6)*100+100));
    // generate data:
    QVector<double> x(10), y(10);
    for (int k=0; k<10; ++k)
    {

      x[k] = k/10.0 * 4*3.14 + 0.01;
      y[k] = 7*qSin(x[k])/x[k] + (shapes.size()-i)*5;
    }
    customPlot->graph()->setData(x, y);
    customPlot->graph()->rescaleAxes(true);
    customPlot->graph()->setPen(pen);
    customPlot->graph()->setName(QCPScatterStyle::staticMetaObject.enumerator(QCPScatterStyle::staticMetaObject.indexOfEnumerator("ScatterShape")).valueToKey(shapes.at(i)));
    customPlot->graph()->setLineStyle(QCPGraph::lsLine);
    // set scatter style:
    if (shapes.at(i) != QCPScatterStyle::ssCustom)
    {

      customPlot->graph()->setScatterStyle(QCPScatterStyle(shapes.at(i), 10));
    }
    else
    {

      QPainterPath customScatterPath;
      for (int i=0; i<3; ++i)
        customScatterPath.cubicTo(qCos(2*M_PI*i/3.0)*9, qSin(2*M_PI*i/3.0)*9, qCos(2*M_PI*(i+0.9)/3.0)*9, qSin(2*M_PI*(i+0.9)/3.0)*9, 0, 0);
      customPlot->graph()->setScatterStyle(QCPScatterStyle(customScatterPath, QPen(Qt::black, 0), QColor(40, 70, 255, 50), 10));
    }
  }
  // set blank axis lines:
  customPlot->rescaleAxes();
  customPlot->xAxis->setTicks(false);
  customPlot->yAxis->setTicks(false);
  customPlot->xAxis->setTickLabels(false);
  customPlot->yAxis->setTickLabels(false);
  // make top right axes clones of bottom left axes:
  customPlot->axisRect()->setupFullAxesBox();
}

void MainWindow::setupLineStyleDemo(QCustomPlot *customPlot)
{

  demoName = "Line Style Demo";
  customPlot->legend->setVisible(true);
  customPlot->legend->setFont(QFont("Helvetica", 9));
  QPen pen;
  QStringList lineNames;
  lineNames << "lsNone" << "lsLine" << "lsStepLeft" << "lsStepRight" << "lsStepCenter" << "lsImpulse";
  // add graphs with different line styles:
  for (int i=QCPGraph::lsNone; i<=QCPGraph::lsImpulse; ++i)
  {

    customPlot->addGraph();
    pen.setColor(QColor(qSin(i*1+1.2)*80+80, qSin(i*0.3+0)*80+80, qSin(i*0.3+1.5)*80+80));
    customPlot->graph()->setPen(pen);
    customPlot->graph()->setName(lineNames.at(i-QCPGraph::lsNone));
    customPlot->graph()->setLineStyle((QCPGraph::LineStyle)i);
    customPlot->graph()->setScatterStyle(QCPScatterStyle(QCPScatterStyle::ssCircle, 5));
    // generate data:
    QVector<double> x(15), y(15);
    for (int j=0; j<15; ++j)
    {

      x[j] = j/15.0 * 5*3.14 + 0.01;
      y[j] = 7*qSin(x[j])/x[j] - (i-QCPGraph::lsNone)*5 + (QCPGraph::lsImpulse)*5 + 2;
    }
    customPlot->graph()->setData(x, y);
    customPlot->graph()->rescaleAxes(true);
  }
  // zoom out a bit:
  customPlot->yAxis->scaleRange(1.1, customPlot->yAxis->range().center());
  customPlot->xAxis->scaleRange(1.1, customPlot->xAxis->range().center());
  // set blank axis lines:
  customPlot->xAxis->setTicks(false);
  customPlot->yAxis->setTicks(true);
  customPlot->xAxis->setTickLabels(false);
  customPlot->yAxis->setTickLabels(true);
  // make top right axes clones of bottom left axes:
  customPlot->axisRect()->setupFullAxesBox();
}

void MainWindow::setupScatterPixmapDemo(QCustomPlot *customPlot)
{

  demoName = "Scatter Pixmap Demo";
  customPlot->axisRect()->setBackground(QPixmap("./solarpanels.jpg"));
  customPlot->addGraph();
  customPlot->graph()->setLineStyle(QCPGraph::lsLine);
  QPen pen;
  pen.setColor(QColor(255, 200, 20, 200));
  pen.setStyle(Qt::DashLine);
  pen.setWidthF(2.5);
  customPlot->graph()->setPen(pen);
  customPlot->graph()->setBrush(QBrush(QColor(255,200,20,70)));
  customPlot->graph()->setScatterStyle(QCPScatterStyle(QPixmap("./sun.png")));
  // set graph name, will show up in legend next to icon:
  customPlot->graph()->setName("Data from Photovoltaic\nenergy barometer 2011");
  // set data:
  QVector<double> year, value;
  year  << 2005 << 2006 << 2007 << 2008  << 2009  << 2010 << 2011;
  value << 2.17 << 3.42 << 4.94 << 10.38 << 15.86 << 29.33 << 52.1;
  customPlot->graph()->setData(year, value);

  // set title of plot:
  customPlot->plotLayout()->insertRow(0);
  customPlot->plotLayout()->addElement(0, 0, new QCPTextElement(customPlot, "Regenerative Energies", QFont("sans", 12, QFont::Bold)));
  // axis configurations:
  customPlot->xAxis->setLabel("Year");
  customPlot->yAxis->setLabel("Installed Gigawatts of\nphotovoltaic in the European Union");
  customPlot->xAxis2->setVisible(true);
  customPlot->yAxis2->setVisible(true);
  customPlot->xAxis2->setTickLabels(false);
  customPlot->yAxis2->setTickLabels(false);
  customPlot->xAxis2->setTicks(false);
  customPlot->yAxis2->setTicks(false);
  customPlot->xAxis2-></